A pilot-scale study of a powdered activated carbon-membrane bioreactor for the treatment of water with a high concentration of ammonia
Senlin
Shao
,
Fangshu
Qu
,
Heng
Liang
 *,
Haiqing
Chang
,
Huarong
Yu
and
Guibai
Li
State Key Laboratory of Urban Water Resource and Environment (SKLUWRE), Harbin Institute of Technology, 73 Huanghe Road, Nangang District, Harbin 150090, PR China. E-mail: shaosenlin@gmail.com; qufangshu@163.com; hitliangheng@163.com; Fax: +86 451 86283001; Tel: +86 451 86283001
First published on 1st September 2015
Abstract
A submerged, powdered activated carbon-membrane bioreactor (PAC-MBR) at a pilot-scale (2.2 m3 h−1) was used to treat surface water with a high concentration of ammonia (~2.64 mg L−1) and a low alkalinity. The ammonia removal efficiency and its influencing factors (i.e., temperature, alkalinity and aeration mode) were systematically investigated. The results showed that the PAC-MBR could effectively remove a high concentration of ammonia when the temperature was higher than 20 °C, and exhibited good resistance to ammonia fluctuation (fluctuation range: 1–3 mg L−1). The ammonia removal capacity of the PAC-MBR exponentially decreased as the temperature decreased over a temperature range from 13 °C to 24 °C. Alkalinity became the limiting factor when the temperature exceeded 24 °C, and ammonia removal linearly increased as the alkalinity increased. Moreover, intermittent aeration at an appropriate aeration interval was proven to provide enough oxygen for biological nitrification. Furthermore, the foulants attached on the membrane surface could also contribute to the ammonia removal during the filtration. The PAC-MBR process could serve as a potential option to address elevated levels of ammonia under steady and transient state operation.
Water impactThe drinking water sources of many regions are suffering from a high concentration (>1.5 mg L−1) of ammonia pollution, which could not be eliminated by a biofiltration process. The powdered activated carbon-membrane bioreactor (PAC-MBR) is supposed to be a promising process to address the problem. However, a systematic study of high concentration ammonia removal using the PAC-MBR process is still lacking. In this study, we found that the ammonia removal efficiency of the PAC-MBR was significantly influenced by water temperature and alkalinity in the influent, but rarely affected by intermittent aeration. In addition to the suspended solid in the bioreactor, the irreversible fouling cake layer could also remove a certain amount of ammonia. This pilot-scale study was intended to provide suggestions to the design and operation of a full-scale PAC-MBR process. |
1. Introduction
The drinking water sources (e.g., ground and surface waters) of many regions are suffering from a high concentration (>1.5 mg L−1) of ammonia (NH3–N) that mainly originates from metabolic, agricultural and industrial processes.1–3 Ammonia is not of direct health relevance at the concentrations expected to be in drinking water.4 However, the nitrification (biological conversion of ammonia to nitrite and nitrate) of ammonia in the drinking water system leads to the potential corrosion of distribution system materials, taste and odor problems, and elevated nitrite levels.4–7 A high concentration of ammonia also increases chlorine demand during disinfection, and consequently produces more carcinogenic disinfection by-products.6 Therefore, it is crucial to remove the high concentration of ammonia during the drinking water treatment process.A biological approach, i.e., nitrification, is widely used to reduce ammonia in source water. Nitrification takes place in two sequential oxidation steps: (i) ammonia oxidizing bacteria (AOB) convert ammonia to nitrite (NO2−–N), and (ii) nitrite oxidizing bacteria (NOB) convert nitrite to nitrate (NO3−–N). Nitrification consumes alkalinity and dissolved oxygen (DO); nitrification can be inhibited in waters with a low concentration of DO and alkalinity. According to the stoichiometry of nitrification, 7.14 mg (as CaCO3) alkalinity and 4.57 mg O2 are consumed for every mg of NH3–N oxidized to nitrate. The biofiltration process is commonly used for nitrification during drinking water treatment.6,8,9 However, in waters containing excessive levels of ammonia (>1.5 mg L−1), more than 6.9 mg L−1 oxygen is required for nitrification, and the natural water environment can hardly afford that much oxygen. Consequently, the ability of biofiltration in completely oxidizing a high concentration of ammonia (>1.5 mg L−1) to nitrate is limited by the availability of oxygen that can be supplied to the system.6,8
The powdered activated carbon-membrane bioreactor (PAC-MBR) is proposed to be an effective process to remove a high concentration of ammonia (>1.5 mg L−1) in source water, because the aeration system of the PAC-MBR could supply adequate oxygen for nitrification. The operation of the PAC-MBR in previous studies generally referred to that of MBR for municipal wastewater treatment.10 Previous bench-scale studies have demonstrated that the PAC-MBR had the capacity to effectively remove NH3–N at the concentration of more than 3 mg L−1.11,12 The process could even effectively reduce ~10 mg L−1 NH3–N at a low temperature (2–4 °C);13 high concentration of PAC in the bioreactor was found to facilitate ammonia removal at a low temperature. A previous study also concluded that the PAC-MBR was superior to the biofiltration process for ammonia (0.14 mg L−1) removal at 7 °C.14 However, all of these studies simply gave the ammonia removal efficiency; a systematic study on the treatment of water containing a high concentration of ammonia using the PAC-MBR process is still lacking. Moreover, these reported bench-scale research results have yet to be verified by pilot-scale studies.
To this end, the removal of a high concentration of ammonia in a pilot-scale PAC-MBR system with a short hydraulic retention time (HRT, 20 min) was systematically investigated. The ammonia removal efficiency of the PAC-MBR in different situations was assessed, and the factors affecting ammonia removal (i.e. temperature, alkalinity and aeration mode) were investigated. This practice was intended to show that the PAC-MBR could act as an alternative to biofiltration to address elevated levels of ammonia (>1.5 mg L−1) in source water.
2. Materials and methods
2.1 Experimental setup
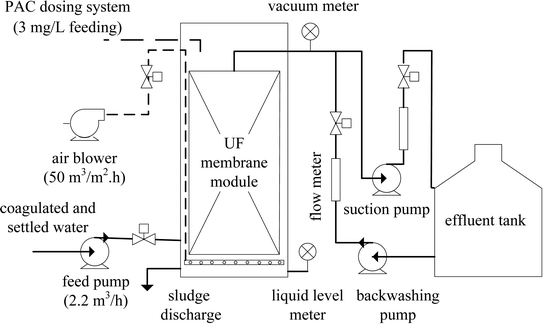
The pilot-scale PAC-MBR was installed at a drinking water treatment plant (Dongguan, southern China). A schematic diagram of the pilot-scale PAC-MBR (2.2 m3 h−1) is illustrated in Fig. 1. The ultrafiltration (UF) membrane module implemented in this study was originally used for full-scale applications. The PAC was sieved through a 100 mesh screen and was used without further purification. Detailed information about the membrane and the PAC is listed in Table 1.| Parameters | Values |
|---|---|
| Membrane | |
| Manufacturer | Litree, China |
| Type | Polyvinylchloride (PVC) hollow fiber ultrafiltration (UF) membrane |
| Nominal pore size | 10 nm |
| Membrane area | 110 m2 |
| Flux | 20 L (m−2 h−1) |
| Filtration/backwash duration | 15 min 20 s−1 |
| Powdered activated carbon (PAC) | |
| Manufacturer | Longchuang, China |
| Type | Wood-base |
| Iodine number | 522 mg g−1 |
| Methylene blue | 108 mg g−1 |
| Diameter | D 50 = 22.7 μm |
| Dosage | 3 mg L−1 feed water |
| Bioreactor | |
| Effective volume | 750 L |
| Intermittent aeration rate | 50 m3 (m−2 h−1) |
| Aeration duration/interval | 20 s 4–15 min−1 |
| Hydraulic retention time (HRT) | 20 min |
| Sludge retention time (SRT) | 15 d |
| Mixed liquor suspended solids (MLSS) | 2.3–2.6 g L−1 |
The PAC-MBR system was controlled using a programmable logic controller (PLC). Trans-membrane pressure (TMP) was recorded using the PLC during operation. Detailed operating parameters are listed in Table 1. The sludge retention time (SRT) was controlled by draining the mixed liquor every day, and the daily waste volume was 750/15 = 50 L. The PAC was directly added to the bioreactor once a day, and the mass of PAC added each day was 3 mg L−1 × 2.2 m3 h−1 × 24 h = 158.4 g. PAC can enhance the removal efficiency of organic matter through adsorption, and it is also an ideal microbial carrier.11 The water quality of the produced water is generally better at a higher PAC dosage. In the published literature, the PAC dosages were generally selected at the range of 5–10 mg L−1 feed water,15 and continuous aeration was used.10 In this study, a low PAC dosage (3 mg L−1 feed water) and intermittent aeration were employed to reduce operating costs. A short HRT of 20 min was adopted considering the replacement of the biofiltration process with the PAC-MBR.
The feed water of the PAC-MBR was the settled water in the drinking water treatment plant. Polyaluminium chloride (PACl) at a dosage of 6–8 mg PACl per L raw water was adopted in the coagulation process of the water plant. The feed water had low levels of hardness and alkalinity, approximately 40 mg L−1 and 30 mg L−1 as CaCO3 respectively. To simulate severe ammonia pollution, NH4Cl (analytical grade, Benchmark®, China) was dosed into the feed water. In most instances, the ammonia in the feed water (c0) was kept at a higher level than the ammonia removal capacity of the PAC-MBR (cm), so that the ammonia would not be completely removed (i.e., ammonia in the effluent cf > 0), and the ammonia removal capacity of the PAC-MBR could be determined by the amount of ammonia removed by the system (i.e., when cf > 0, cm ≈ c0 − cf). In the current study, the ammonia removal was referred to as the amount of ammonia removed rather than the removal percentage. Alkalinity of the feed water was improved using NaHCO3 (analytical grade, Benchmark®, China). The characteristics of the feed water are listed in Table 2.
| Water quality index | Influent | Effluent | Removal/% |
|---|---|---|---|
| Turbidity/NTU | 1.57 ± 0.57 | 0.10 ± 0.02 | 93.6 ± 0.9 |
| DOC/mg L−1 | 1.72 ± 0.39 | 1.29 ± 0.32 | 25.0 ± 14.3 |
| CODMn/mg L−1 | 1.54 ± 0.35 | 1.46 ± 0.58 | 5.3 ± 26.2 |
| UV254/cm−1 | 0.022 ± 0.004 | 0.015 ± 0.004 | 31.8 ± 12.3 |
| NH3–N/mg L−1 | 2.64 ± 0.75 | 0.45 ± 0.43 | 83.0 ± 11.7 |
| NO2−–N/mg L−1 | 0.12 ± 0.04 | 0.46 ± 0.52 | — |
| NO3−–N/mg L−1 | 2.90 ± 0.40 | 4.73 ± 1.11 | — |
The PAC-MBR was continuously operated for six months (December 29, 2011 to June 25, 2012). During this period, the effects of temperature and ammonia fluctuation on ammonia removal were investigated. The ammonia removal of the PAC-MBR under intermittent and continuous mode was also compared by occasionally altering the aeration to continuous mode for several hours. At the end of the operating period, the ammonia removal capacity of the fouling layer was assessed by discarding all the suspended solids in the bioreactor. An additional operation was performed from July 17, 2012 to August 5, 2012 to explore the relationship between alkalinity and ammonia removal using another new membrane module (the former fouled membrane module was taken out for membrane foulant analysis, and the results have been published16).
2.2 Analytical methods
The sample was analyzed immediately after collection. The analysis was conducted following the standard methods.17 Permanganate index (CODMn) was analyzed using the potassium permanganate oxidation method. Alkalinity was analyzed using the titration method. NH3–N, NO2−–N and NO3−–N concentrations were determined by the colorimetric methods using a UV/vis spectrophotometer (T6, Puxi, China); ultraviolet absorbance (UV254) was also measured using the spectrophotometer. Dissolved organic carbon (DOC) was determined using a total organic carbon analyzer (Phoenix 8000, Tekmar Dohrmann, USA). Prior to NH3–N, NO2−–N, NO3−–N, UV254 and DOC measurement, the samples were filtered through a 0.45 μm cellulose ester membrane (Taoyuan, China). Turbidity was monitored using a turbidimeter (2100N, HACH, USA). Dissolved oxygen (DO) was determined using a digital DO meter (HQ30d, HACH, USA).3 Results and discussion
3.1 Process performance
3.2 Ammonia removal in different conditions
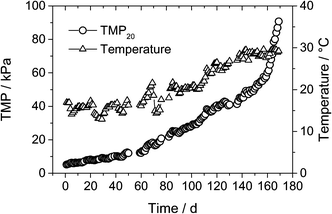
The influent and effluent concentration of NH3–N and NO2−–N of the PAC-MBR is illustrated in Fig. 3. The total nitrogen in the influent and effluent showed a good mass balance (Table 2), thus the concentration of NO3−–N was not given. According to the operation conditions, the overall experimental duration could be roughly separated into four periods: start-up period (0–18 d), low temperature period (19–80 d), high temperature period (81–127 d) and ammonia fluctuation period (128–169 d).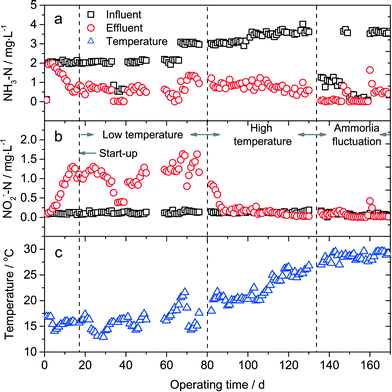 | ||
| Fig. 3 Concentration of NH3–N (a) and NO2−–N (b) in the influent and effluent, and water temperature (c) during the experimental period. | ||
During the start-up period, the NH3–N concentration in the effluent began to decrease on the 4th day, and followed by an increase of NO2−–N concentration in the effluent. After 18 days, the concentration of NH3–N and NO2−–N in the effluent was stabilized, and thus it was assumed that steady-state was attained. The start-up time of the PAC-MBR was much shorter than that of the biofiltration process (several months3), due to the fact that the nitrifying bacteria were completely retained by the UF membrane. Complete nitrification (oxidation of ammonia into nitrate) was not achieved due to the low temperature (14.1–16.9 °C) during the start-up period.
During the low temperature period (12.6–21.9 °C), the PAC-MBR showed a relatively poor performance for ammonia removal. The average concentration of NH3–N in the influent and the effluent was 2.14 and 0.63 mg L−1, respectively. Nitrite accumulation was clearly observed in the effluent and the average amount of nitrite accumulation was 0.95 mg L−1, indicating that only 37% of ammonia was oxidized to nitrate. Complete nitrification still could not be achieved even when the influent contained low levels of NH3–N (approximately 0.6 mg L−1) in days 36–39. These results showed that NOB in the PAC-MBR might exhibit a lower bacterial activity at low temperature.
At the beginning of the high temperature period, the ammonia removal increased dramatically compared to that in the low temperature period. Especially when the temperature was higher than 21 °C, complete nitrification was observed. In drinking water systems, the optimal temperature for biological nitrification and nitrifying bacteria growth is 25–30 °C.7 However, the ammonia removal capacity did not show a significant increase when the temperature further raised during the high temperature period (Fig. 3a). This discrepancy will be discussed in detail in section 3.3.
On days 51–58 and 131–135, the equipment did not function well, and the experiment was ceased for several days. In such a case, the suspended solid precipitated at the bottom of the bioreactor. The water samples were collected immediately after the restart of the equipment. It could be seen in Fig. 3 that the ammonia removal efficiency did not significantly decrease, suggesting that short-term pauses of the operation rarely affected the biological activity of nitrifying bacteria in the bioreactor. Accordingly, the sludge of the PAC-MBR could be stored (at least for short terms) and used for other purposes such as inoculation.
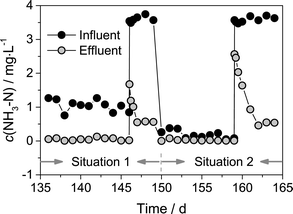
The concentration of NH3–N in the influent and effluent during the ammonia fluctuation period in Fig. 3 is magnified in Fig. 4. In this period, the water temperature and alkalinity in the influent were almost identical. Water samples were additionally collected at 1, 5, and 12 h after a sudden increase in ammonia concentration. If ammonia in the influent was suddenly increased from ~1 mg L−1 to 3.5 mg L−1 (designated as Situation 1, days 136–146), approximately 1.9 mg L−1 ammonia could still be removed by the process after the ammonia shock. Less than 24 h was required for the recovery of the ammonia removal capacity. Nitrite accumulation did not occur (Fig. 3b) in Situation 1 either. If ammonia in the influent was suddenly increased from <0.2 mg L−1 to 3.6 mg L−1 (designated as Situation 2, days 150–159), only approximately 1 mg L−1 ammonia could be removed at 1 h after the sudden increase of ammonia, and the recovery time was more than 3 days. Unlike Situation 1, nitrite accumulation occurred in Situation 2 (Fig. 3b). Obviously, the PAC-MBR had a better resistance to ammonia fluctuation in Situation 1. The difference between Situation 1 and Situation 2 was that the feed water contained ~1 mg L−1 ammonia in Situation 1, whereas it rarely contained ammonia in Situation 2. The lack of ammonia in the feed water in Situation 2 limited the growth of nitrifying bacteria in the bioreactor, and the discharge of mixed liquor every day resulted in a wash-out of nitrifying bacteria. So the PAC-MBR exhibited a relatively poor resistance to the ammonia fluctuation in Situation 2. When using the PAC-MBR to treat source waters with highly varying ammonia concentration, the ammonia fluctuation in Situation 2 should be noted.
3.3 Factors influencing ammonia removal
| r(T1) = r(T2) × exp(k(T1 − T2)) | (1) |
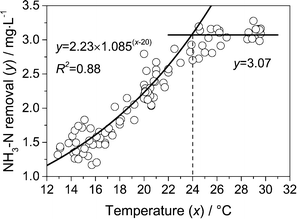
Fig. 5 shows the relationship between ammonia removal and temperature. Only the data in the low and high temperature periods in Fig. 3 were collected, and the data in which the ammonia was totally removed (effluent ammonia cf ≈ 0) were deleted from the dataset. So the data of ammonia removal in Fig. 5 could reflect the ammonia removal capacity of the PAC-MBR at different temperatures. It could be seen that the ammonia removal exponentially increased as the temperature increased when the temperature was between 13 °C and 24 °C. The ammonia removal and the corresponding temperature fit well with eqn (1) (R2 = 0.88). Temperature coefficient k was 0.082 according the fitting. The coefficient was lower than the value of 0.122 measured in previous studies.20,21 The difference could be attributed to the fact that the PAC-MBR is a suspended-growth reactor, while biofiltration is a biofilm reactor. Moreover, the amount of nitrifying bacteria in the bioreactor was probably different at different temperatures.
A previous study has reported that the bench-scale PAC-MBR with a high PAC concentration of 40 g L−1 had an excellent ammonia removal capacity at water temperatures below 4 °C.13 The process could also remove more than 6 mg L−1 ammonia at 10 °C.22 In the current study, however, the ammonia removal was relatively poor although the temperature was higher than that in the previous studies. This difference is partially ascribed to the fact that the PAC concentration in the bioreactor used in this study was approximately 3.2 g L−1, which was much lower than that used in the previous works.13,22 It was demonstrated that the increase of PAC concentration in the bioreactor was beneficial for ammonia removal.23 Moreover, the HRT adopted in the current work (20 min) was much lower than that in the previous studies (2–3.3 h). Compared with a bench-scale experiment, a pilot-scale experiment has more complex hydrodynamic and environmental conditions, which might also contribute to the poor ammonia removal.24 Overall, the ammonia removal capacity of the PAC-MBR at low temperatures and its underlying mechanism need to be further investigated.
When the temperature was higher than 24 °C, the ammonia removal was almost kept constant around 3.07 mg L−1 (Fig. 5). It is generally believed that the biological activity of nitrifying bacteria still increased when the temperature increased in the range of 24–30 °C.7 This suggested that other factors other than temperature limited the ammonia removal when the temperature was higher than 24 °C.
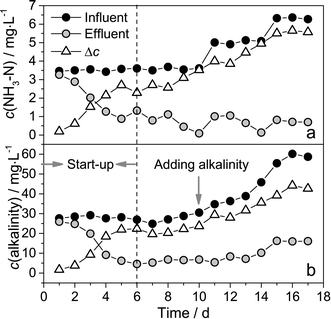 | ||
| Fig. 6 NH3–N concentration (a) and alkalinity (b) of the influent and effluent, Δc refers to NH3–N removal or alkalinity consumption. | ||
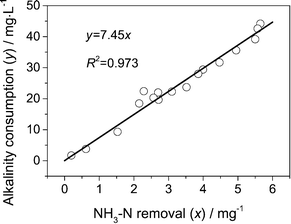
The relationship between NH3–N removal and alkalinity consumption is illustrated in Fig. 7. Alkalinity consumption was highly correlated with ammonia removal (R2 = 0.973, n = 17) in our experimental condition. The slope of the linear regression was equal to 7.45 mg CaCO3 per mg ammonia, and was close to the theoretical value of 7.14. Consequently, the total consumption of alkalinity could be roughly calculated using this relationship. Whether the influent alkalinity is sufficient for nitrification can be also justified by this relationship. In this study, nitrification was stopped when the alkalinity was lower than 4.5–7.1 mg L−1 as CaCO3. Therefore, in the current experimental condition, when the influent alkalinity <7.1 + 7.45 × ammonia removal, the alkalinity was the limiting factor for ammonia removal.
Nitrifying bacteria are obligate aerobes. The limiting DO concentration is typically 2 mg L−1 for nitrifying bacteria in activated sludge reactors.27 As mentioned above, it is the DO that limited the ammonia removal capacity during the biofiltration process. Intermittent aeration was employed in the PAC-MBR in this study, and its effects on ammonia removal efficiency were investigated.
The effluent DO concentration in two different intermittent aeration conditions is illustrated in Fig. 8. When the temperature was 17.6 °C (Fig. 8a), the average ammonia removal was 1.58 mg L−1, and only 7.2 mg L−1 oxygen was needed according to the stoichiometry of nitrification. Accordingly, aeration was only conducted during the backwashing period (aeration interval = 15 min). It could be observed in Fig. 8a that the effluent DO concentration gradually reduced during the filtration period, and suddenly increased after aeration. The effluent DO concentration was higher than 2 mg L−1, suggesting that intermittent aeration could provide sufficient oxygen in that case as expected. When the aeration turned to continuous mode, the ammonia removal increased to 1.89 mg L−1, which was slightly higher than that in intermittent aeration mode. This increase could be ascribed to the resuspension of the precipitated solids during continuous aeration mode. When the temperature was 28.5 °C (Fig. 8b), the average ammonia removal was as high as 2.96 mg L−1, and therefore more DO was needed. Aeration with a duration of 20 s was conducted every 4 min. The effluent DO concentration did not dramatically fluctuate due to the short aeration interval. Like the former case in Fig. 8a, the high effluent DO concentration suggested that intermittent aeration could provide adequate oxygen. When the aeration turned to continuous mode, the ammonia removal did not increase because alkalinity was the limiting factor for ammonia removal.
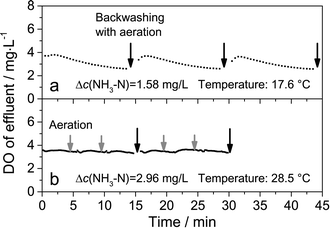 | ||
| Fig. 8 DO concentration in the effluent in the intermittent aeration mode at an aeration interval of 15 min (a) and 4 min (b). | ||
According to the results above, it could be seen that intermittent aeration could provide sufficient oxygen for nitrification by adjusting the aeration interval. Intermittent aeration can result in the sedimentation of suspended solids at the aeration interval, but this study found that the sedimentation did not significantly affect the ammonia removal efficiency. One reason for the result was that the sediment would be re-suspended by the periodic aeration. Another reason was that approximately 0.92 mg L−1 ammonia could be removed by the physical irreversible fouling cake formed on the membrane surface (section 3.4), and the ammonia removal capacity of the fouling cake did not decrease during the aeration interval.
As intermittent aeration did not significantly affect the ammonia removal efficiency in the PAC-MBR, it was recommended during the operation of the PAC-MBR. It was also reported that complete nitrification was achieved in a fluidized bed reactor-membrane bioreactor with intermittent aeration,28 and that the effluent pH, membrane fouling and pollutant removal efficiency were affected by intermittent aeration. Accordingly, an optimal parameter for intermittent aeration exists for a specific PAC-MBR.
3.4 Ammonia removed by membrane fouling cake
To identify the capacity of the fouling cake for ammonia removal, an additional trial was conducted at the end of the experiment. All the suspended solids of the mixed liquor in the bioreactor were discarded, and the bioreactor was emptied every 8 h, and no PAC was added during the trial. The NH3–N concentration in the influent, effluent and mixed liquor was measured (Fig. 9). It could be seen that approximately 0.92 mg L−1 NH3–N could still be removed by the system, and the NH3–N concentration of the influent and the mixed liquor was almost equal after discarding all the suspended solids. Nitrifying bacteria could not accumulate in the bioreactor owing to the fact that the bioreactor was emptied every 8 h. Therefore, the nitrifying bacteria in the mixed liquor had negligible ammonia removal capacity. Moreover, the UF membrane pore was too large to reject ammonia. Consequently, the source of the ammonia removal was derived from the fouling cake formed on the membrane surface of the PAC-MBR.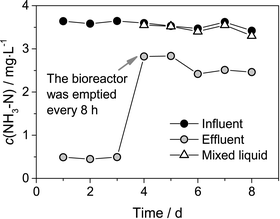 | ||
| Fig. 9 NH3–N concentration in the influent, effluent and mixed liquor after draining the bioreactor every 8 h. | ||
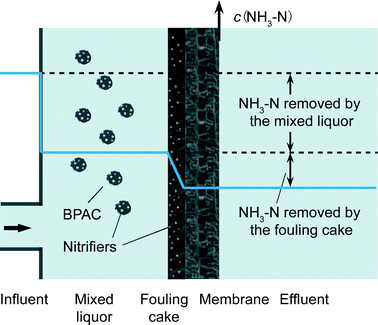
According to the results of the fouling analysis,16 the fouled membrane surface was covered with a layer of external foulants which were mainly comprised of biological PAC; and the mass of the external foulants on the membrane surface was comparable to the mass of the suspended solids in the mixed liquor. It is undeniable that these external foulants could also carry a certain amount of nitrifying bacteria, and thereby remove ammonia (Fig. 10). The ammonia removal capacity of the cake layer was much lower than that of the suspended solids, although their total mass was comparable. Ammonia was removed when the water passed through the fouling cake (the filtration rate was approximately 5.6 μm s−1), and the contact time of water with fouling cake was much shorter than that with suspended solids (20 min). Therefore, the ammonia removal capacity of the fouling cake was inferior to that of the suspended solid.
However, the fouling cake showed a negligible organic matter removal capacity (data not shown). The phenomenon may be due to the fact that the adsorption capacity of the PAC in the fouling cake was depleted, and that the biological removal of organics by the fouling cake was negligible. This result was different from the results obtained by Li and Chu,29 who suggested that the cake layer of the MBR could function as an additional barrier for large molecules and hydrophobic organic matter. The difference could be derived from the different characteristics of the organic matter (e.g., biodegradability, molecular weight distribution) in the feed water used in the two studies.
As the cake layer that formed on the membrane surface had the capacity for nitrification, it was assumed that a membrane biofilm reactor system could be established. A fouling cake would form on the membrane surface during operation, and this study suggested that the biofilm could remove approximately 0.92 mg L−1 ammonia. Therefore, when facing source water with a low concentration of organic matter and a moderate concentration of ammonia, we could discard the suspended solids in the bioreactor and utilize the fouling cake to remove ammonia. The system did not need the addition of PAC and it was also possible to reduce membrane fouling, and thereby lower the operating costs. The membrane biofilm reactor and the PAC-MBR system could be easily transformed back and forth to address source waters with varying concentrations of ammonia.
4. Conclusions
A pilot-scale PAC-MBR was constructed to treat source water with elevated concentrations of ammonia (>1.5 mg L−1). The ammonia removal efficiency and its influencing factors were systematically investigated. The following conclusions could be drawn:(1) When the water temperature was lower than 20 °C, the PAC-MBR did not show a good performance for ammonia removal, and complete nitrification could not be achieved. When the temperature was between 13 °C and 24 °C, ammonia removal exponentially increased as a function of temperature.
(2) When the temperature was higher than 24 °C, alkalinity became the limiting factor. The ammonia removal capacity of the PAC-MBR increased as the alkalinity in the influent increased. The ammonia removal and the alkalinity consumption showed a good linear relationship.
(3) The PAC-MBR exhibited a good resistance to the ammonia fluctuation if the feed water contained >1 mg L−1 ammonia.
(4) Intermittent aeration, which could substantially reduce the operating costs, could supply sufficient DO and did not significantly affect the ammonia removal.
(5) A great amount of external foulants were deposited on the membrane surface and formed a physically irreversible fouling cake. This fouling cake could remove approximately 0.92 mg L−1 ammonia.
Acknowledgements
This research was jointly supported by the National Natural Science Foundation of China (51138008), the Fundamental Research Funds for the Central University (NSRIF.2014096), the State Key Laboratory of Urban Water Resource and Environment (2014DX04), the Funds for Creative Research Groups of China (51121062) and Science and Technology Planning Project of Chancheng District (2013A1044).References
- Q. Fu, B. Zheng, X. Zhao, L. Wang and C. Liu, J. Environ. Sci., 2012, 24, 1739–1743 CrossRef CAS.
- D. A. Lytle, C. White, D. Williams, L. Koch and E. Nauman, J. - Am. Water Works Assoc., 2013, 105, 87–88 CAS.
- A. G. Tekerlekopoulou, S. Pavlou and D. V. Vayenas, J. Chem. Technol. Biotechnol., 2013, 88, 751–773 CrossRef CAS.
- WHO, Guidelines for drinking-water quality, 4th edn, 2011 Search PubMed.
- Y. Zhang, A. Griffin and M. Edwards, J. - Am. Water Works Assoc., 2010, 102, 83–93 CAS.
- X. Yu, Z. Qi, X. Zhang, P. Yu, B. Liu, L. Zhang and L. Fu, Water Res., 2007, 41, 1455–1464 CrossRef CAS PubMed.
- Y. Zhang, N. Love and M. Edwards, Crit. Rev. Environ. Sci. Technol., 2009, 39, 153–208 CrossRef CAS.
- S. Feng, S. Xie, X. Zhang, Z. Yang, W. Ding, X. Liao, Y. Liu and C. Chen, J. Environ. Sci., 2012, 24, 1587–1593 CrossRef CAS.
- I. Kasuga, H. Nakagaki, F. Kurisu and H. Furumai, Water Res., 2010, 44, 5039–5049 CrossRef CAS PubMed.
- S. Shao, F. Qu, H. Liang, K. Li, H. Yu, H. Chang and G. Li, Int. Biodeterior. Biodegrad., 2015, 102, 81–88 CrossRef CAS.
- C. Ma, S. Yu, W. Shi, W. Tian, S. G. Heijman and L. C. Rietveld, Bioresour. Technol., 2012, 113, 136–142 CrossRef CAS PubMed.
- J.-Y. Tian, H. Liang, Y.-L. Yang, S. Tian and G.-B. Li, J. Membr. Sci., 2008, 325, 262–270 CrossRef CAS.
- G. Seo, S. Takizawa and S. Ohgaki, Water Sci. Technol.: Water Supply, 2002, 2, 169–176 CAS.
- S. Leveille, A. Carriere, S. Charest and B. Barbeau, J. Water Supply: Res. Technol.--AQUA, 2013, 62, 23–33 CrossRef CAS.
- C. Stoquart, P. Servais, P. R. Bérubé and B. Barbeau, J. Membr. Sci., 2012, 411–412, 1–12 CrossRef CAS.
- S. Shao, F. Qu, H. Liang, H. Chang, H. Yu and G. Li, Process Biochem., 2014, 49, 1741–1746 CrossRef CAS.
- A. P. H. Association, Standard methods for the examination of water and wastewater, 20th edn, American Public Health Association/American Water Works Association/Water Environment Federation, Washington DC, USA, 1998 Search PubMed.
- C. Stoquart, P. Servais and B. Barbeau, Water Res., 2014, 67, 255–266 CrossRef CAS PubMed.
- USEPA, Membrane filtration guidance manual, EPA 815-R-06-009, Washington DC, 2005 Search PubMed.
- P. Bouillot, J. Roustan, G. Albagnac and J. Cadet, Water Supply, 1992, 10, 137–144 CAS.
- A. Andersson, P. Laurent, A. Kihn, M. Prévost and P. Servais, Water Res., 2001, 35, 2923–2934 CrossRef CAS PubMed.
- C. Ma, S. Yu, W. Shi, S. G. Heijman and L. C. Rietveld, Bioresour. Technol., 2013, 141, 19–24 CrossRef CAS PubMed.
- J. Y. Hu, R. Shang, H. P. Deng, S. G. J. Heijman and L. C. Rietveld, Bioresour. Technol., 2014, 154, 290–296 CrossRef CAS PubMed.
- M. Kraume, D. Wedi, J. Schaller, V. Iversen and A. Drews, Desalination, 2009, 236, 94–103 CrossRef CAS.
- M. Henze, Biological wastewater treatment: principles, modelling and design, IWA, 2008 Search PubMed.
- E. Braak, M. Alliet, S. Schetrite and C. Albasi, J. Membr. Sci., 2011, 379, 1–18 CrossRef CAS.
- H. Abu Hasan, S. R. S. Abdullah, S. K. Kamarudin, N. T. Kofli and N. Anuar, Sep. Purif. Technol., 2013, 118, 547–556 CrossRef CAS.
- A. Guadie, S. Xia, Z. Zhang, J. Zeleke, W. Guo, H. H. Ngo and S. W. Hermanowicz, Bioresour. Technol., 2014, 156, 195–205 CrossRef CAS PubMed.
- X.-Y. Li and H. P. Chu, Water Res., 2003, 37, 4781–4791 CrossRef CAS PubMed.
| This journal is © The Royal Society of Chemistry 2016 |

