 Open Access Article
Creative Commons Attribution 3.0 Unported Licence
Bacterial production of transparent exopolymer particles during static and laboratory-based cross-flow experiments†
Tamar
Jamieson
a,
Amanda V.
Ellis
b,
Dmitriy A.
Khodakov
b,
Sergio
Balzano
a,
Deevesh A.
Hemraj
a and
Sophie C.
Leterme
*a
aSchool of Biological Sciences, Flinders University, GPO BOX 2100, Adelaide SA 5001, Australia. E-mail: sophie.leterme@flinders.edu.au; Tel: +61 8 8201 3774
bFlinders Centre for Nanoscale Science and Technology, School of Chemistry and Physical Sciences, Flinders University, GPO BOX 2100, Adelaide SA 5001, Australia
First published on 28th January 2016
Abstract
Biofouling of seawater reverse osmosis (SWRO) membranes represents one of the leading causes of performance deterioration in the desalination industry. This work investigates the biofouling potential of microbial communities present in a reverse osmosis (RO) feed tank. As an example, water from the RO feed tank of the Penneshaw desalination plant (Kangaroo Island, South Australia) was used in a static biofilm formation experiment. Cultures of the indigenous biofilms formed during the static experiment showed that α-Proteobacteria and γ-Proteobacteria accounted for nearly 80% of the classes of bacteria present in the RO feed tank. Pseudomonas sp. was identified as the major species and isolated for testing in static and laboratory-based cross flow biofilm formation experiments. Results showed that the volume of TEPs generated by Pseudomonas sp. during the laboratory-based cross-flow experiment was 10 fold higher to that produced during the static experiment for the same time period, while both experiments were inoculated with cell concentrations of the same order of magnitude. The availability of nutrients was also shown to be a key driver in TEP production, particularly for the static experiments. This study provides insights into the phenomenon of biofouling by assessing the production of biofouling precursors from one of the main genera of biofilm-forming bacteria, namely Pseudomonas sp.
Water impactSeawater reverse osmosis (SWRO) desalination is considered one of the most effective methods to combat world water shortages. However, loss of productivity and costs in SWRO are associated with biofouling issues. This paper provides new insights on the precursors of biofilm formation on RO membranes. Results show that nutrient availability has a significant impact on the production of biofouling precursors. |
Introduction
Throughout the world, the desalination of seawater is expanding in response to climate change and associated increases in temperature, desertification and drought.1 Water shortages are further exacerbated due to the stress of an increasing population, uneven water distribution and stringent water quality regulations.1Desalination plants are extensively recognized as an effective treatment of seawater and/or brackish water to produce fresh water, especially with the advances made in membrane materials and components.2 Seawater reverse osmosis (SWRO) is considered the simplest and most cost effective method of freshwater production in comparison to other separation methods such as distillation, solvent extraction, ion-exchange and adsorption.3 However, SWRO systems are prone to clogging and biofilm formation on the RO membrane. Membrane fouling still occurs even after seawater pre-treatment and cross-flowing within the RO system.4 This results in a negative impact on the performance of the system through a decline in the water flux as well as an increase in the amount of seawater rejected, energy requirement and system pressure.2,5,6
The control of biofilm formation is a complicated and controversial process involving the reduction of microorganisms within the RO water, monitoring strategies and controlling factors such as nutrient concentrations and physico-chemical interactions between microorganism and membrane surface.7 In particular, bacteria are highly abundant organisms in aquatic habitats and can take part in the biofouling process.8
The inflow of live biofilm forming bacteria, organics and nutrients onto the RO membrane allows for growth and proliferation of the bacteria leading to biofouling.9 The accumulation of nutrients from the water and metabolites produced by bacteria such as extracellular polymeric substances (EPS), proteins, and lipids further allow microorganisms to adhere and grow on the membrane surface.6
Biofilms consist of sessile microbial cells contained within a heterogeneous matrix of EPS, which attach irreversibly to a solid surface.10 These cells differ from free-living cells of the same species in terms of growth rate and gene expression as they have an altered phenotype.10 The physical and chemical processes that are involved in the early formation of a biofilm are not well understood. However, a sequence of processes is thought to lead to the formation of a biofilm such as a) the adsorption of organic and inorganic particles on the surface, b) attachment of pioneer microorganisms, c) growth and reproduction of primary colonisers and d) maturation of the biofilm matrix.11
Transparent exopolymer particles (TEPs) are often found in the marine environment and play a crucial role in the formation and development of marine biofilms.12 They are deformable, gel like transparent particles that appear in many forms, such as amorphous blobs, clouds, sheets, filaments or clumps.13 TEPs can be formed spontaneously from the aggregation of dissolved precursor substances, which is controlled by environmental parameters such as turbulence, ion density and concentration of inorganic colloids as well as the type and concentration of precursors present in water.14 In the marine environment, TEPs serve as “hot spots” of intense microbial and chemical activity within the water column facilitating the attachment of planktonic TEPs to surfaces.15 Within the desalination process, high levels of potential biofilm forming TEPs have been found to reach the RO membrane.12
EPS, a main component of TEPs, is produced by phytoplankton and bacteria.16 EPS production has been found to be species specific and dependent on surrounding growth conditions.17 When attached to surfaces such as biofilms, bacteria produce EPS in large amounts.18 In contrast, when in a planktonic state within the water column, bacteria produce TEP.19 However, the role of bacteria in the production of TEPs is not yet known due to the close association between phytoplankton and bacteria when experiments are conducted in situ.17
Biofilms have been strongly implicated in the biofouling of the SWRO membranes present in desalination plants. However, only very small portions of biofouling microbes have been identified thus far. As the microbial community composition changes seasonally, so do the conditions that influence biofouling. Therefore, the present study aims to fill this gap in knowledge by identifying the composition, diversity and biofouling potential of the cultivable microbial communities present after seawater pre-treatments but before the RO process (i.e., RO feed tank water) within a desalination plant. This study thus identifies the bacteria likely to be involved in biofilm formation on the SWRO membranes. In particular, the bacteria Pseudomonas sp., which was isolated from RO feed tank water and tested.
Experimental methods
Study site
The Penneshaw SWRO desalination plant has a capacity of 3 × 10⁵ L per day and has been described in detail in previous studies.20,21 Seawater from a depth of 6 m is pumped from the coastal waters north of Kangaroo Island at a site located 190 m from the Penneshaw desalination plant and enters the system through two pre-filtration screens (10 cm and 0.5 mm pore sizes, respectively). This is then followed by the pre-treatment system which includes an MP-UV disinfection unit, four parallel MMF (gravel, garnet, sand and coal with grain size ranging from 0.3 to 10 mm), and two consecutive sets of three CFs each with a pore size of 15 μm and 5 μm, respectively. The flow rate through the system is typically 8.4 L s−1 after which the seawater enters the RO feed tank. For the study, the fully operational Penneshaw SWRO plant was selected due to its small size and simple configuration along with the lack of biocide and coagulant applications in its pre-treatment.Seawater samples used in this study were obtained from the RO feed tank of the desalination plant at Penneshaw. Samples from the RO feed tank were collected in 20 L white opaque carboys and kept on ice during transportation to the laboratory where they were stored at 4 °C in the dark to minimize changes in the water properties (i.e., nutrients and microbial content).
Biofilm formation from RO feed tank water
![[thin space (1/6-em)]](https://www.rsc.org/images/entities/char_2009.gif) :
:![[thin space (1/6-em)]](https://www.rsc.org/images/entities/char_2009.gif) 12 hour light/dark cycle as a control to emulate the natural day/night cycle conditions of seawater. The RO feed tank water in each container was replaced every three days and assessed for microbial abundance.
12 hour light/dark cycle as a control to emulate the natural day/night cycle conditions of seawater. The RO feed tank water in each container was replaced every three days and assessed for microbial abundance.
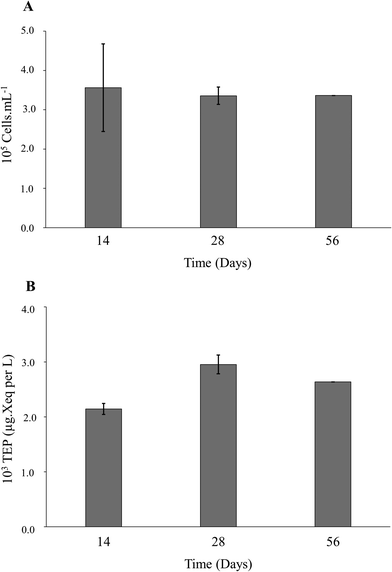
The six membranes placed in the containers were dedicated to a specific incubation period (i.e., 14, 28 or 56 days) (see ESI† Table S1). At the end of the incubation periods of 14, 28 and 56 days, one membrane was removed from each container for bacteria isolation and a second membrane was removed to analyze the amount of TEP accumulated in the biofilm formed on the membrane. Those membranes were then replaced by a clean membrane (see ESI† Table S1).
![[thin space (1/6-em)]](https://www.rsc.org/images/entities/char_2009.gif) :
:![[thin space (1/6-em)]](https://www.rsc.org/images/entities/char_2009.gif) 10, 1
10, 1![[thin space (1/6-em)]](https://www.rsc.org/images/entities/char_2009.gif) :
:![[thin space (1/6-em)]](https://www.rsc.org/images/entities/char_2009.gif) 50 and 1
50 and 1![[thin space (1/6-em)]](https://www.rsc.org/images/entities/char_2009.gif) :
:![[thin space (1/6-em)]](https://www.rsc.org/images/entities/char_2009.gif) 100 in sterile seawater were spread plated onto either Luria–Bertani (LB) agar or nutrient agar and incubated in the dark at 20 °C in a temperature cycling chamber (Labec, Australia).
100 in sterile seawater were spread plated onto either Luria–Bertani (LB) agar or nutrient agar and incubated in the dark at 20 °C in a temperature cycling chamber (Labec, Australia).
Single colonies were patched on LB agar, or nutrient agar, and incubated in the dark at 20 °C in the temperature cycling chamber. Individual colonies were subsequently inoculated into 5 mL of the sterile liquid phase of the same medium and incubated as previously described.
TEP production by Pseudomonas sp. under static conditions
TEP production by Pseudomonas sp. under cross-flow conditions
Pseudomonas sp. was used as an inoculum for an overnight culture grown in 250 mL of autoclaved raw seawater (15 min at 121 °C). This overnight culture was diluted in 5 L of TFF filtered raw seawater to be used as the inoculum for the laboratory-based cross-flow experiment.Statistical analysis
All environmental and bacterial abundance data were tested for normality using Shapiro–Wilks tests computed with the R statistical package. However, due to the data not being of normal distribution, non-parametric tests were applied to determine correlations (Spearman's rank correlation coefficient) and for the comparison for mean (Kruskal–Wallis/Wilcoxon rank sum test).Results
Biofilm formation from RO feed tank water
TEP production by Pseudomonas sp. under static conditions
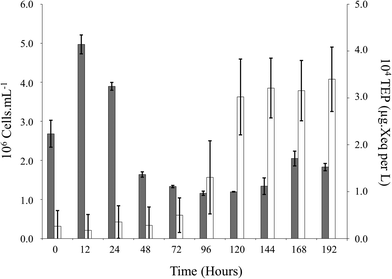
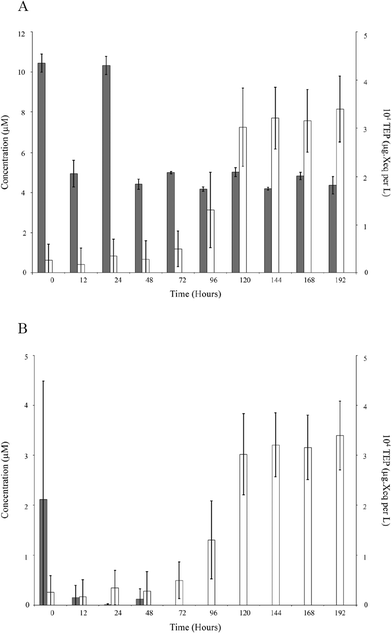
Exponential growth of Pseudomonas sp. was evident as well as daily variations in TEP production (Fig. 2). An inverse correlation was apparent between population growth and the production of TEP (population ρ = −0.371, p < 0.05). However, nutrients were negatively correlated to TEP (phosphate ρ = −0.466, p < 0.05, nitrate ρ = −0.364, p < 0.05; Fig. 3) suggesting that the production of TEP is influenced by the nutrients that were available in solution. | ||
| Fig. 2 Fluctuations in Pseudomonas sp. population (black) and TEP production (white) overtime during static conditions. | ||
TEP production by Pseudomonas sp. under cross-flow conditions
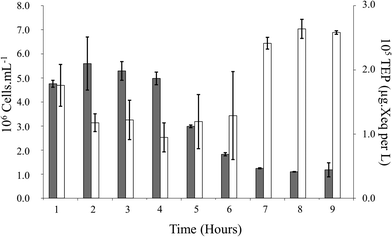
Laboratory-based cross-flow experiments are the closest mimicry of what happens to the water circulated within a desalination plant system. Here, a mono-culture of Pseudomonas sp. isolated from RO feed tank water was circulated within a laboratory-based cross-flow system at a pressure of 500 psi for 8 h at approximately 20 °C. A significant correlation between Pseudomonas sp. and the TEP in the reservoir water of the laboratory-based cross-flow system was apparent (ρ = −0.595, p < 0.05) (Fig. 4). Here no variation was observed in nutrients. | ||
| Fig. 4 Fluctuations in Pseudomonas sp. population (black) and TEP production (white) overtime during the laboratory-based cross-flow experiments. | ||
Discussion
As a result of the recognition of biofouling as a leading cause of system inefficiency within SWRO desalination plants, considerable efforts have been made to elucidate details about the mechanisms involved and the significance of TEP in biofouling.5,6,13,28–31 Here, biofilms were formed on SWRO membranes using RO feed tank water and showed that the prevailing cultivable phylum was Proteobacteria (>70%) and that the α-Proteobacteria class dominated the samples (see ESI† Fig. S1). These results are in agreement with Ayache et al.,32 Zhang et al.,33 and Chen et al.,34 although the ratio of α- and γ-Proteobacteria varied between the studies. It has been suggested that the α-Proteobacteria class are present in larger quantities in mature biofilms and replace β-Proteobacteria, which are generally thought to be instrumental in initial biofilm development.35TEPs also play an important role in biofilm formation within aquatic environments,13,14,17 facilitating and accelerating biofilm development.13,36 In particular, TEPs have a role in the conditioning of surfaces by creating a more favourable environment for the attachment of planktonic cells and the proceeding biofilm that is developed.14,17,37 It has been suggested that TEP precursors, through the formation of a conditioning film, could reduce the diffusion of ions (Na+, Ca2+, Mg2+, Cl−, SO42−) and organics from the membrane surface to the bulk flow, enhancing the concentration polarization on the membrane surface.36 Here, the concentration of TEPs produced by the biofilm suggests that production reflects the growth stages of the biofilm from the initial adherence of bacteria to the membrane, resulting in low levels of TEPs which increase over time as the biofilm expands. This increase in TEP production, due to an increase in the abundance of bacteria, has been seen in situ38,39 as well as under laboratory conditions.36 While these studies were conducted on planktonic bacteria the assumption could still stand as a reduction in organic matter results in the increased production of TEPs.39
Here, the volume of TEPs generated by Pseudomonas sp. under static conditions was of the same order of magnitude of that presented by Sheng et al.36 for static experiments on Pseudoalteromonas atlantica. However, the volume of TEPs generated by Pseudomonas sp. during the laboratory-based cross-flow experiment was 10 fold higher to that produced during the static experiment for the same time period, while both experiments were inoculated with cell concentrations of the same order of magnitude. Our study corroborates findings by Passow40 who showed that indigenous bacteria under shear conditions produced a significant amount of TEPs in comparison to that produced under static conditions. In particular, they showed that shear and turbulent conditions impacted on the TEP production. Others have shown that shear can impact the structure and polysaccharides composition of biofilms.41,42 While bacteria are known to generate large amounts of polysaccharide, through the renewal of capsules and films as well as free exopolmers,40 an increase in TEP production in such a short period of time (8 hours) could be due to the shear conditions resulting in abiotic formation of TEP particles as opposed to spontaneously.40 As shear conditions have been found to enhance the growth rate of bacteria,40 an increase in shear could also possibly result in an higher production of polysaccharides which form into TEP particles.
Microorganisms are constantly subject to the environment and their ability to sense and respond accordingly is therefore essential to their survival.43 In response to nutrient starvation, or limitation, bacteria adapt to the environment through a number of different activities, and in an attempt to maintain viability they may adopt a more resistant state.43–45 Prior to nutrient starvation bacteria are well dispersed; however, it has been observed that during nutrient limited conditions there is increased adhesion and surface hydrophobicity.45–47 In addition, limitation of nutrients such as carbon, nitrogen and phosphorous within aquatic ecosystems has been found to affect not only bacterial growth and EPS production but also biomass.47–49 Moreover, phosphate deprivation can result in the production of larger quantities of EPS in comparison to eutrophic environments.50–53 The production of large amounts of EPS has thus been suggested as a survival mechanism with the matrix being an effective strategy to trap nutrients from the surrounding environment.54 Under continuing starvation conditions Myszka and Czaczyk52 found that P. aeruginosa had a high level of EPS output and produced the highest amount of EPS after an incubation period of 120 h.
Conclusion
This study demonstrates the importance of TEP production by microorganisms in the biofouling process within desalination plants. Our results indicate that in a planktonic state within the natural environment the production of TEP is relatively controlled, in particular by the availability of nutrients, however, within the desalination system microbial composition and turbulence determine the generation of TEP. Therefore, both direct and indirect approaches need to be undertaken in order to reduce the biofouling capacity of the microorganisms present within the RO feed tank and make the system more economical.Acknowledgements
The authors acknowledge the financial support of the National Centre of Excellence in Desalination Australia, which is funded by the Australian Government through the National Urban Water and Desalination Plan. The authors are also grateful to T. Kirby, T. Kildea, N. Nedelkov and G. Ralston for their assistance in sampling from the Penneshaw desalination plant and to C. Le Lan for assistance with measuring TEP concentration.References
- L. F. Greenlee, D. F. Lawler, B. D. Freeman, B. Marrot and P. Moulin, Water Res., 2009, 43, 2317–2348 CrossRef CAS PubMed.
- T. Harif, H. Elifantz, E. Margalit, M. Herzberg, T. Lichi and D. Minz, Desalin. Water Treat., 2011, 31, 151–163 CrossRef CAS.
- A. Matin, Z. Khan, S. M. J. Zaidi and M. C. Boyce, Desalination, 2011, 281, 1–16 CrossRef CAS.
- R. Komlenic, Filtr. Sep., 2010, 47, 26–28 CrossRef.
- J. Lee and I. S. Kim, Desalination, 2011, 273, 118–126 CrossRef CAS.
- L. Katebian and S. C. Jiang, J. Membr. Sci., 2013, 425, 182–189 CrossRef.
- R. A. Al-Juboori, T. Yusaf and V. Aravinthan, Desalination, 2012, 286, 349–357 CrossRef CAS.
- B. R. Borlee, A. D. Goldman, K. Murakami, R. Samudrala, D. J. Wozniak and M. R. Parsek, Mol. Microbiol., 2010, 75, 827–842 CrossRef CAS PubMed.
- C. L. D. Manes, N. West, S. Rapenne and P. Lebaron, Biofouling, 2011, 27, 47–58 CrossRef CAS PubMed.
- R. M. Donlan and J. W. Costerton, Clin. Microbiol. Rev., 2002, 15, 167–193 CrossRef CAS PubMed.
- E. Bar-Zeev, I. Berman-Frank, O. Girshevitz and T. Berman, Proc. Natl. Acad. Sci. U. S. A., 2012, 109, 9119–9124 CrossRef CAS PubMed.
- E. Bar-Zeev, I. Berman-Frank, B. Liberman, E. Rahav, U. Passow and T. Berman, Desalin. Water Treat., 2009, 3, 136–142 CrossRef CAS.
- R. V. Linares, V. Yangali-Quintanilla, Z. Y. Li and G. Amy, J. Membr. Sci., 2012, 421, 217–224 CrossRef.
- U. Passow, Prog. Oceanogr., 2002, 55, 287–333 CrossRef.
- T. Berman, R. Mizrahi and C. G. Dosoretz, Desalination, 2011, 276, 184–190 CrossRef CAS.
- U. Passow and A. L. Alldredge, Mar. Ecol.: Prog. Ser., 1994, 113, 185–198 CrossRef.
- M. Simon, H. P. Grossart, B. Schweitzer and H. Ploug, Aquat. Microb. Ecol., 2002, 28, 175–211 CrossRef.
- K. E. Stoderegger and G. J. Herndl, Limnol. Oceanogr., 1998, 43, 877–884 CrossRef CAS.
- K. E. Stoderegger and G. J. Herndl, Mar. Ecol.: Prog. Ser., 1999, 189, 9–16 CrossRef CAS.
- C. Pelekani, S. A. Jewell and G. Kilmore, IDA World Congress-Maspalomas, Gran Canaria, Spain, 2007 Search PubMed.
- M. B. Dixon, T. Qiu, M. Blaikie and C. Pelekani, Desalination, 2012, 284, 245–252 CrossRef CAS.
- K. Rudi, O. M. Skulberg, F. Larsen and K. S. Jakobsen, Appl. Environ. Microbiol., 1997, 63, 2593–2599 CAS.
- K. Tamura, D. Peterson, N. Peterson, G. Stecher, M. Nei and S. Kumar, Mol. Biol. Evol., 2011, 28, 2731–2739 CrossRef CAS PubMed.
- U. Passow and A. L. Alldredge, Limnol. Oceanogr., 1995, 40, 1326–1335 CrossRef CAS.
- P. Claquin, I. Probert, S. Lefebvre and B. Veron, Aquat. Microb. Ecol., 2008, 51, 1–11 CrossRef.
- D. Marie, F. Partensky, D. Vaulot and C. Brussaard, Curr. Protoc. Cytom., 2007, 11, 1–14 Search PubMed.
- H. P. Hansen and F. Koroleff, Determination of nutrients, in methods of seawater analysis, Wiley, Weinheim, Germany, 2007 Search PubMed.
- M. Krivorot, A. Kushmaro, Y. Oren and J. Gilron, J. Membr. Sci., 2011, 376, 15–24 CrossRef CAS.
- R. A. Al-Juboori and T. Yusaf, Desalination, 2012, 302, 1–23 CrossRef CAS.
- T. Nguyen, F. A. Roddick and L. Fan, Membranes, 2012, 2, 804–840 CrossRef CAS PubMed.
- S. Huang, N. Voutchkov and S. C. Jiang, Desalination, 2013, 319, 1–9 CrossRef CAS.
- C. Ayache, C. Manes, M. Pidou, J. P. Croue and W. Gernjak, Water Res., 2013, 47, 3291–3299 CrossRef CAS PubMed.
- M. L. Zhang, S. Jiang, D. Tanuwidjaja, N. Voutchkov, E. M. V. Hoek and B. L. Cia, Appl. Environ. Microbiol., 2011, 77, 4390–4398 CrossRef CAS PubMed.
- C. L. Chen, W. T. Liu, M. L. Chong, M. T. Wong, S. L. Ong, H. Seah and W. J. Ng, Appl. Microbiol. Biotechnol., 2004, 63, 466–473 CrossRef CAS PubMed.
- L. A. Bereschenko, H. Prummel, G. J. W. Euverink, A. J. M. Stams and M. C. M. van Loosdrecht, Water Res., 2011, 45, 405–416 CrossRef CAS PubMed.
- S. Li, H. Winters, S. Jeaong, A.-H. Emwas, S. Vigneswaran and G. L. Amy, Desalination, 2016, 379, 68–74 CrossRef CAS.
- T. Berman and M. Holenberg, Filtr. Sep., 2005, 42, 30–32 CrossRef.
- I. De Vicente, E. Ortega-Retuerta, I. P. Mazuecos, M. L. Pace, J. J. Cole and I. Reche, Aquat. Sci., 2010, 72, 443–453 CrossRef.
- E. Ortega-Retuerta, C. M. Duarte and I. Reche, Microb. Ecol., 2010, 59, 808–818 CrossRef PubMed.
- U. Passow, Mar. Ecol.: Prog. Ser., 2002, 236, 1–12 CrossRef.
- P. Stoodley, I. Dodds, J. D. Boyle and H. M. Lappin-Scott, J. Appl. Microbiol., 1999, 85, 19–28 CrossRef PubMed.
- P. Stoodley, R. Cargo, C. J. Rupp, S. Wilson and L. Klapper, J. Ind. Microbiol. Biotechnol., 2002, 29, 361–367 CrossRef CAS PubMed.
- S. N. Wai, Y. Mizunoe and S. Yoshida, FEMS Microbiol. Lett., 1999, 180, 123–131 CrossRef CAS PubMed.
- A. S. Seshasayee, P. Bertone, G. M. Fraser and N. M. Luscombe, Curr. Opin. Microbiol., 2006, 9, 511–519 CrossRef CAS PubMed.
- S. Kjelleberg and M. Hermansson, Appl. Environ. Microbiol., 1984, 48, 497–503 CAS.
- S. L. Sanin, S. D. Sanin and J. D. Bryers, Process Biochem., 2003, 38, 909–914 CrossRef CAS.
- V. F. Farjalla, F. A. Esteves, R. L. Bozelli and F. Roland, Hydrobiologia, 2002, 489, 197–205 CrossRef CAS.
- W. Graneli, S. Bertilsson and A. Philibert, Aquat. Sci., 2004, 66, 430–439 CrossRef CAS.
- M. Jansson, A. K. Bergstrom, D. Lymer, K. Vrede and J. Karlsson, Microb. Ecol., 2006, 52, 358–364 CrossRef CAS PubMed.
- I. W. Sutherland, in Microbial Extracellular Polymeric Substances, ed. J. Wingender, T. R. Neu and H. C. Flemming, Springer-Verlag, Berlin, 1st edn, 1999, vol. 4, pp. 73–89 Search PubMed.
- P. J. Looijesteijn, W. H. M. van Casteren, R. Tuinier, C. H. L. Doeswijk-Voragen and J. Hugenholtz, J. Appl. Microbiol., 2000, 89, 116–122 CrossRef CAS PubMed.
- K. Myszka and K. Czaczyk, Curr. Microbiol., 2009, 58, 541–546 CrossRef CAS PubMed.
- C. M. Kim, S. J. Kim, L. H. Kim, M. S. Shin, H. W. Yu and I. S. Kim, Desalination, 2014, 349, 51–59 CrossRef CAS.
- W. M. Dunne, Clin. Microbiol. Rev., 2002, 15, 155–166 CrossRef CAS PubMed.
Footnote |
| † Electronic supplementary information (ESI) available. See DOI: 10.1039/c5ew00275c |
| This journal is © The Royal Society of Chemistry 2016 |


