Characterization of polysaccharide fractions in mulberry fruit and assessment of their antioxidant and hypoglycemic activities in vitro
Chun
Chen
a,
Li-Jun
You
a,
Arshad Mehmood
Abbasi
ab,
Xiong
Fu
*a,
Rui Hai
Liu
ac and
Chao
Li
*a
aCollege of Light Industry and Food Sciences, South China University of Technology, 381 Wushan Road, Guangzhou 510640, China. E-mail: lfxfu@scut.edu.cn; lichao02263559@163.com; Fax: +86-20-87112894; Tel: +86-20-87112894
bDepartment of Environmental Sciences, COMSATS Institute of Information Technology, Abbottabad, Pakistan
cDepartment of Food Science, Stocking Hall, Cornell University, Ithaca, NY 14853, USA
First published on 16th November 2015
Abstract
The present study aimed to characterize and investigate the polysaccharide fractions of mulberry fruit, and their antioxidant and hypoglycemic activities. Mulberry fruit polysaccharides (MFP) were extracted by using hot water as the solvent and fractioned by using a DEAE-Sepharose fast-flow column. In total four eluents of water (MFP-1), 0.1 M NaCl (MFP-2), 0.2 M NaCl (MFP-3) and 0.3 M NaCl (MFP-4) were fractionated. Arabinose, galactose, glucose, xylose and mannose were the main components present in MFP-1, while MFP-2 and MFP-3 were composed of arabinose and galactose, and MFP-4 of arabinose, galactose and glucose. High-performance gel permeation chromatography (HP-GPC) analysis indicated a narrower molecular weight distribution in the MFP-1 fraction. Scanning electron microscopy (SEM) exhibited a smooth surface for MFP-1 and MFP-3 fractions, whereas MFP-2 and MFP-4 have pore openings and flocculent fibers on a smooth surface. Tertiary structure analyses indicated that none of the fractions had a triple-helical conformation. On the whole, MFP-3 and MFP-4 showed better antioxidant activity and inhibitory effects on α-amylase and α-glucosidase compared to MFP-1 and MFP-2. These results show significant potential for the antioxidant and hypoglycemic activities of MFP-3 and MFP-4 indicating the need for their further exploration as potential antidiabetic agents.
1. Introduction
Diabetes mellitus (DM), as a chronic metabolic disease, has become the third most life-threatening disease due to its high morbidity and mortality.1 Approximately 5% of the population worldwide has been diagnosed as suffering from DM and this number is increasing year by year. The World Health Organization (WHO) has predicted that by 2025, the number of diabetic patients will be about 300 million.2 Many types of oral hypoglycemic agents have been synthesized to treat DM including acarbose, glucosidase inhibitor, insulin sensitizer, biguanides and sulfonylureas. However, their clinical application is limited because of side effects, such as liver problems, diarrhea and lactic acidosis.3 Currently, many natural agents have shown significant potential in the treatment of DM because of their non-toxic and non-negative effects.4 Polysaccharides are important bioactive natural products obtained from wide resources and exhibit immunostimulatory, antiviral, antitumor, antioxidant and anti-diabetic activities.3Mulberry (Morus alba L), belonging to the Moraceae family, is cultivated worldwide and especially in Europe, Asia, and Africa. Mulberry fruits are popular because of their good flavor, rich nutrition and traditional use in folk medicine.5 Mulberry fruit polysaccharides are biologically active ingredients which have been proved to possess anti-inflammatory, anti-tumor, antioxidant, hypoglycemic and hypolipidemic activities.6 However, sugar composition, glycosidic bond, molecular mass, structure and conformation greatly affect the functional properties of polysaccharides.7–9 Recently, considerable evidence has shown that there exists an inextricable link between oxidative stress and diabetes.10,11 Therefore, the polysaccharides with strong antioxidant and hypoglycemic activities will be good candidates for the treatment of diabetes. To our knowledge information on the composition, structure, antioxidant properties and hypoglycemic activity of mulberry fruit polysaccharides is inadequate. In this context, the present study aimed to examine the physico-chemical properties, morphological structure, and antioxidant and hypoglycemic activities in vitro in the polysaccharide fractions extracted from mulberry fruits.
2. Materials and methods
2.1. Material and chemicals
The mature fruits of black mulberry (harvested in the Xinjiang province, China) were obtained from the Haozhou medicinal material market (Anhui, China). The fruits were washed thoroughly and dried at 45 °C in an oven (DHG-9140A, Yiheng Scientific instrument Co., Ltd, Shanghai, China). The dried samples were pulverized and screened with 60-mesh to obtain powder samples which were kept in desiccators at room temperature for further analysis.Ascorbic acid, acarbose, bovine serum albumin (BSA), curdlan, laminarin, dextran standards, 2,2-azobis(2-methylpropionamidine)-dihydrochloride (AAPH), fluorescein sodium salt, 6-hydroxy-2,5,7,8-tetramethylchroman-2-carboxylic acid (Trolox), 2,2-diphenyl-1-picrylhydrazyl (DPPH), α-amylase and α-glucosidase were purchased from Sigma-Aldrich Chemical Co.(St. Louis, MO, USA). Standards of monosaccharides and uronic acid were purchased from Aladdin Chemistry Company (Shanghai, China). DEAE (diethyl aminoethyl)-Sepharose was purchased from GE Healthcare Life Science (Piscataway, NJ, USA). All other chemicals and solvents were of reagent grade.
2.2. Preparation of crude polysaccharides
The dried powder of mulberry fruits was refluxed with ethanol (90% v/v) for 4 h at 70 °C to decolorize and remove monosaccharides, grease and ethanol soluble constituents. The residue was separated by Whatman no. 1 filter paper and dried in an air-drying oven at 40 ± 0.1 °C for 24 h.The dried residue was extracted with hot water at 90 °C in a ratio of 40![[thin space (1/6-em)]](https://www.rsc.org/images/entities/char_2009.gif) :
:![[thin space (1/6-em)]](https://www.rsc.org/images/entities/char_2009.gif) 1 (w/w) for 2 h, and centrifuged at 3000g for 10 min. The supernatant was collected and concentrated to 1/3rd of its volume at 45 °C under vacuum using a rotary evaporator (RE-52 A, Yarong Co. Ltd, Shanghai, P. R. China). Sevag reagent (chloroform
1 (w/w) for 2 h, and centrifuged at 3000g for 10 min. The supernatant was collected and concentrated to 1/3rd of its volume at 45 °C under vacuum using a rotary evaporator (RE-52 A, Yarong Co. Ltd, Shanghai, P. R. China). Sevag reagent (chloroform![[thin space (1/6-em)]](https://www.rsc.org/images/entities/char_2009.gif) :
:![[thin space (1/6-em)]](https://www.rsc.org/images/entities/char_2009.gif) n-butyl alcohol = 4
n-butyl alcohol = 4![[thin space (1/6-em)]](https://www.rsc.org/images/entities/char_2009.gif) :
:![[thin space (1/6-em)]](https://www.rsc.org/images/entities/char_2009.gif) 1, v/v) was added to remove the proteins. The extract was mixed with AB-8 (Sanxing Resin Technology Co., Ltd Anhui, China) in a ratio of 1
1, v/v) was added to remove the proteins. The extract was mixed with AB-8 (Sanxing Resin Technology Co., Ltd Anhui, China) in a ratio of 1![[thin space (1/6-em)]](https://www.rsc.org/images/entities/char_2009.gif) :
:![[thin space (1/6-em)]](https://www.rsc.org/images/entities/char_2009.gif) 25 (wet-weight) and shaken at 200 rpm for 12 h at room temperature to decolorize it. The sample solution was isolated by filtration and precipitated using dehydrated ethanol to a final concentration of 80% (v/v). The precipitated polysaccharides were re-dissolved in deionized water and dialyzed in dialysis tubes (molecular weight cutoff: 500 Da, Mym Biological Technology Co., Ltd USA) containing deionized water for 72 h. The precipitates were freeze-dried at −50 °C to obtain crude polysaccharides (MFP).12 Polysaccharide content in the sample was determined by the phenol-sulfuric acid method using D-glucose as the standard.13
25 (wet-weight) and shaken at 200 rpm for 12 h at room temperature to decolorize it. The sample solution was isolated by filtration and precipitated using dehydrated ethanol to a final concentration of 80% (v/v). The precipitated polysaccharides were re-dissolved in deionized water and dialyzed in dialysis tubes (molecular weight cutoff: 500 Da, Mym Biological Technology Co., Ltd USA) containing deionized water for 72 h. The precipitates were freeze-dried at −50 °C to obtain crude polysaccharides (MFP).12 Polysaccharide content in the sample was determined by the phenol-sulfuric acid method using D-glucose as the standard.13
2.3. Separation and purification of crude MFP
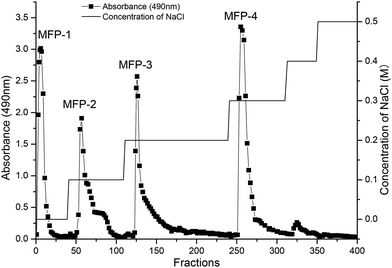
The separation and purification of crude MFP was carried out by using DEAE-Sepharose fast-flow column chromatography as explained by Li et al.14 The crude polysaccharide solution (5 ml, 20 mg ml−1) was applied to the column (26 mm × 40 cm), and sequentially eluted with distilled water and 0.1, 0.2, 0.3, 0.4 and 0.5 M NaCl solution at a flow rate of 1.5 ml min−1. Every 5 ml of eluent was collected by using an automatic collector (BSZ-100, Shanghai Precision Scientific Instrument Co., Ltd, P. R. China). The polysaccharides were detected by the phenol-sulfuric acid method using glucose as the standard. As results, water, 0.1 M, 0.2 M, and 0.3 M NaCl eluents (MFP-1, MFP-2, MFP-3 and MFP-4) were obtained (Fig. 1). The four fractions (MFP-1, MFP-2, MFP-3 and MFP-4) were concentrated and dialyzed using dialysis tubes (molecular weight cutoff: 500 Da, Mym Biological Technology Co., Ltd USA) in deionized water for 72 h followed by lyophilization. The protein content was determined by the Lowry method.152.4. Determination of monosaccharide composition
The samples (10 mg) were hydrolyzed by using 5 ml of trifluoroacetic acid (2 M) at 110 °C for 6 h in a sealed tube. Surplus trifluoroacetic acid was removed by a nitrogen blowing instrument at 50 °C. The residue was re-dissolved in methanol (4 ml) and dried five times followed by dissolution in distilled water and analyzed by a Dionex ion chromatography ICS 5000 (Sunnyvale, CA) with a CarboPac PA1 analytic column (250 × 4 mm; DionexCorp.) and a CarboPac PA1 guard column (50 × 4 mm; Dionex Corp.) as previously described.162.5. Homogeneity and molecular weight determination
Molecular weight distribution of each sample was measured by high-performance gel permeation chromatography (HP-GPC) using a Waters instrument equipped with a TSK-GEL Guard Column (PWXL 6.0 mm × 40 mm), a TSKGEL5000K gel column (PWXL 7.8 mm × 300 mm), a TSK-GEL3500K gel column (PWXL 7.8 mm × 300 mm) (TOSOH Co., Ltd, Japan), and a Waters 2414 Refractive Index Detector.16 The operation conditions were as follows: mobile phase: 0.02 M KH2PO4 (pH 6.0); flow rate: 0.6 ml min−1; column temperature: 35 °C; detector temperature: 45 °C; injection volume: 20 μl. Dextrans of various molecular weights (708![[thin space (1/6-em)]](https://www.rsc.org/images/entities/char_2009.gif) 000, 344
000, 344![[thin space (1/6-em)]](https://www.rsc.org/images/entities/char_2009.gif) 000, 200
000, 200![[thin space (1/6-em)]](https://www.rsc.org/images/entities/char_2009.gif) 000, 107
000, 107![[thin space (1/6-em)]](https://www.rsc.org/images/entities/char_2009.gif) 000, 47
000, 47![[thin space (1/6-em)]](https://www.rsc.org/images/entities/char_2009.gif) 100, 21
100, 21![[thin space (1/6-em)]](https://www.rsc.org/images/entities/char_2009.gif) 100, 9600, 5900 Da) were used as standards.16 The molecular weight of the sample was determined according to the calibration curve equation of the elution volume and a logarithm of the molecular weights mentioned above.
100, 9600, 5900 Da) were used as standards.16 The molecular weight of the sample was determined according to the calibration curve equation of the elution volume and a logarithm of the molecular weights mentioned above.
2.6. Fourier transform-infrared (FT-IR) spectrometry
Each fraction of mulberry fruit polysaccharides (MFP-1, MFP-2, MFP-3 and MFP-4) was thoroughly mixed with KBr powder, ground and pressed into a 1 mm pellet.17 The prepared samples were determined by using a Vector 33 FT-IR spectrophotometer (Bruker, Ettlingen, Germany). The IR spectrum was obtained between 400 and 4000 cm−1 with a resolution of 2 cm−1.2.7. Tertiary structure determination
The conformational structures of MFP-1, MFP-2, MFP-3 and MFP-4 were measured according to the Congo red method as described earlier.18 Briefly, 2.0 ml of each sample (1 mg ml−1) was thoroughly mixed with 2.0 ml of Congo red reagent (100 μM). Through adding NaOH solution (4 M), the mixture was gradually adjusted to different NaOH concentrations (0–0.5 M). At each concentration, the maximum absorption wavelength of the mixture was determined by ultraviolet scanning (200–600 nm). Laminarin and curdlan with a typical triple-helix conformation were used as controls and they were treated strictly as the polysaccharide samples.2.8. Circular dichroism (CD) spectroscopy analysis
Circular dichroism (CD) spectra of MFP fraction solutions (0.5 mg ml−1) were determined on a Chirascan-CD (Applied Photophysics, Britain) spectropolarimeter. Each CD spectrum was the accumulation of three scans at 100 nm min−1 with a 1 nm slit width and a time constant of 0.5 s. Spectra were recorded in the wavelength range from 190 to 260 nm at 1 nm interval.192.9. Scanning electron microscopy (SEM)
The samples (MFP-1, MFP-2, MFP-3 and MFP-4) were sputtered with gold under reduced pressure and determined by a SEM system (JSM-7500F, JEOL, Japan) at a 5 kV acceleration voltage.2.10. Assay for antioxidant activity
2.11. Assay for hypoglycemic activity
| α-Amylase inhibition (%) = [1 − (Asample − Abackground)/Acontrol] × 100 | (1) |
| α-Glucosidase inhibition (%) = [1 − (Asample − Abackground)/Acontrol] × 100 | (2) |
2.12. Statistical analysis
All data were expressed as mean ± SD in triplicate using the statistical software package SPSS (SPSS Inc., Chicago, IL, USA). Analysis of variance (ANOVA) was carried out by Dunnett's test. Means were regarded as significantly different at p < 0.05.3. Results and discussion
3.1. Characteristics and chemical compositions of MFP fractions
As shown in Fig. 1, four fractions (MFP-1, MFP-2, MFP-3 and MFP-4), accounting for 2.74, 4.26, 15.17, and 29.39% of the MFP, respectively, were obtained from crude MFP after purification by a DEAE-Sepharose fast-flow column. The carbohydrate content in MFP-1, MFP-2, MFP-3 and MFP-4 was 88.37 ± 1.34, 75.68 ± 2.67, 86.34 ± 0.57, and 81.33 ± 1.10%, respectively, whereas the protein content in respective order was 3.54 ± 0.89, 6.31 ± 0.57, 5.74 ± 1.40 and 4.11 ± 0.97 (Table 1).| Item | MFP-1 | MFP-2 | MFP-3 | MFP-4 |
|---|---|---|---|---|
| a Values in a row with different letters (b–e) are significantly different at p < 0.05. nd: not detected. | ||||
| Contents (%) | 2.74 | 4.26 | 15.2 | 29.4 |
| Carbohydrate (%) | 88.4 ± 1.34b | 75.7 ± 2.67e | 86.3 ± 0.57c | 81.3 ± 1.10d |
| Protein (%) | 3.54 ± 0.89e | 6.31 ± 0.57b | 5.74 ± 1.40c | 4.11 ± 0.97d |
| Monosaccharide composition (molar ratio, %) | ||||
| Arabinose | 19.2 | 44.9 | 55.3 | 59.9 |
| Galactose | 31.4 | 55.2 | 44.7 | 27.2 |
| Glucose | 26.3 | nd | nd | 13.0 |
| Xylose | 5.98 | nd | nd | nd |
| Mannose | 7.12 | nd | nd | nd |
| Uronic acid content (%) | ||||
| Galacturonic acid | 1.57 | 2.11 | 6.18 | 31.9 |
| Molecular weight distribution (kDa) | ||||
| Peak 1 | 9.51 | 149 | 167 | 185 |
| Content (%) | 8.39 | 28.2 | 45.1 | 7.09 |
| Peak 2 | 7.93 | 9.28 | 4.98 | 64.4 |
| Content (%) | 36.3 | 20.8 | 20.8 | 5.20 |
| Peak 3 | 0.993 | 2.63 | 1.47 | 1.47 |
| Content (%) | 5.89 | 3.64 | 27.7 | 56.1 |
| Peak 4 | 0.696 | 1.52 | nd | 0.243 |
| Content (%) | 33.3 | 26.6 | nd | 5.40 |
The ion chromatography profile depicted that different MFP fractions had different monosaccharide compositions (Fig. 2). As shown in Table 1, MFP-1 consisted of arabinose, galactose, glucose, xylose and mannose with a molar ratio percentage: 19.19, 31.4, 26.31, 5.98, and 7.12%, respectively. MFP-2 and MFP-3 consisted of arabinose and galactose with almost similar molar ratio percentages. MFP-4 was composed of arabinose, galactose and glucose with respective molar ratio percentages of 59.86, 27.15 and 12.99%. In addition, the content of galacturonic acid in MFP-1, MFP-2, MFP-3 and MFP-4 was 1.57, 2.11, 6.18 and 31.88%, respectively. The monosaccharide composition of mulberry fruit polysaccharides was slightly different from the previous studies. Lee et al.24 reported that mulberry fruit polysaccharides were composed of galactose, arabinose, glucose, xylose, mannose, and fucose, while according to Wei et al.25 mulberry fruit polysaccharides contained galactose, mannose and glucose. This may be caused by the differences in the material, extraction methods or purification procedures.
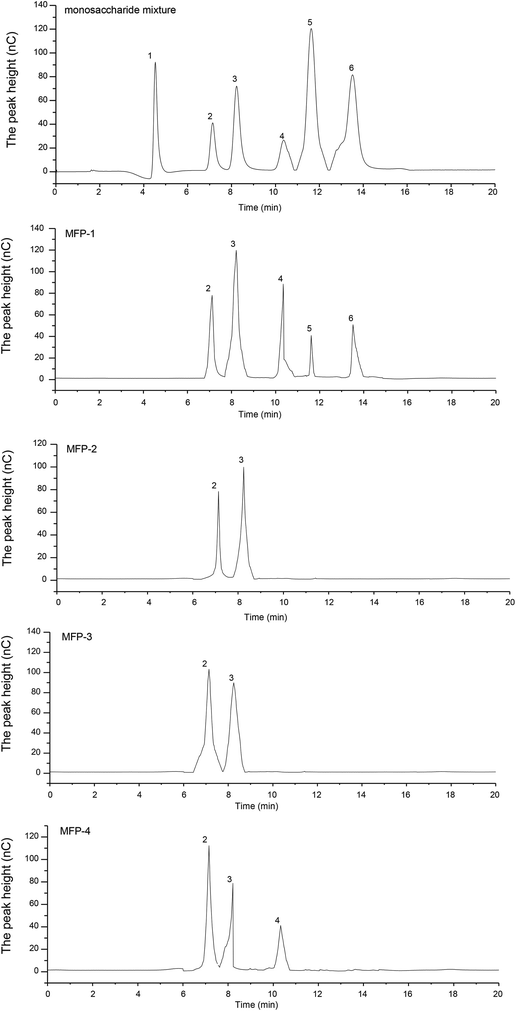 | ||
| Fig. 2 Ion-exchange chromatography of the monosaccharide mixture (1-fucose, 2-arabinose, 3-galactose, 4-glucose, 5-xylose, 6-mannose), MFP-1, MFP-2, MFP-3 and MFP-4. | ||
As shown in Table 1, the MFP fractions had different molecular weight distributions and all were heterogeneous polysaccharides. MFP-1 consisted of four polysaccharides with an average molecular weight of 9.5 (8.39%), 7.9 (36.32%), 1.0 (5.89%) and 0.7 kDa (33.31%). Compared with MFP-1, MFP-2, MFP-3 and MFP-4 had a much wider distribution of molecular weight that is, MFP-2 had 149.4 (28.16%), 9.3 (20.84%), 2.6 (3.64%) and 1.5 kDa (26.58%), MFP-3 had 166.7 (45.08%), 5.0 (20.84%) and 1.5 kDa (27.65%), and MFP-4 had184.7 (7.09%), 64.4 (5.2%), 1.5 (56.05%) and 1.5 kDa (26.58%).
3.2. Infrared spectrum analysis
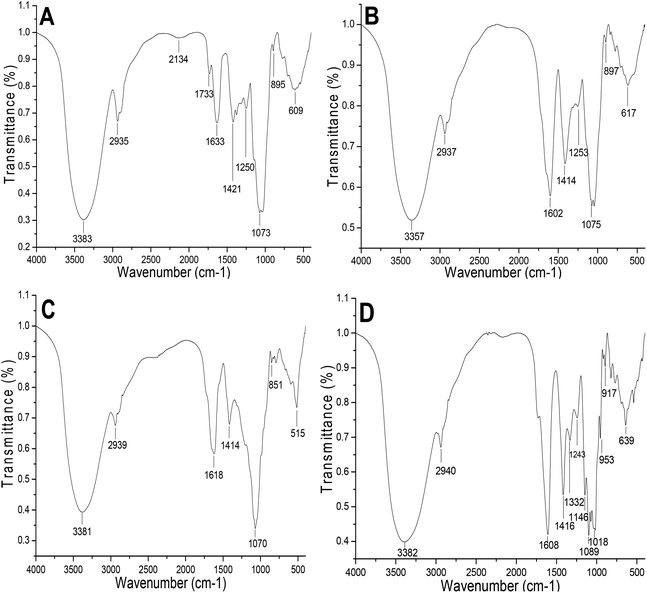
The configuration of the polysaccharides could be elucidated by FTIR spectroscopy. The IR spectra of MFP-1, MFP-2, MFP-3 and MFP-4 are shown in Fig. 3. Generally, the absorption bands at 3357–3383 cm−1 are regarded as the stretching of O–H and C–H. The signals at 1602–1633 cm−1 and 1414–1421 cm−1 were ascribed to asymmetric and symmetric C![[double bond, length as m-dash]](https://www.rsc.org/images/entities/char_e001.gif) O stretching, respectively.26 This was in accordance with the presence of galacturonic acid. The absorption bands at 1070–1075 cm−1 suggested glycosidic linkages of the pyranose ring ether existing in the four MFP fractions. The signal close to 1250 cm−1 was due to the S
O stretching, respectively.26 This was in accordance with the presence of galacturonic acid. The absorption bands at 1070–1075 cm−1 suggested glycosidic linkages of the pyranose ring ether existing in the four MFP fractions. The signal close to 1250 cm−1 was due to the S![[double bond, length as m-dash]](https://www.rsc.org/images/entities/char_e001.gif) O stretching vibration which indicated that MFP-1, MFP-2 and MFP-4 may contain the sulfate group.27 The absorption at 894, 895 and 897 cm−1 was related to the C–H variable angle vibration of the β-anomer. The signal at 851 cm−1 was related to the C–H variable angle vibration in the α-anomer.28 These differences in characteristic peaks proved that the four MFP fractions were structurally different.
O stretching vibration which indicated that MFP-1, MFP-2 and MFP-4 may contain the sulfate group.27 The absorption at 894, 895 and 897 cm−1 was related to the C–H variable angle vibration of the β-anomer. The signal at 851 cm−1 was related to the C–H variable angle vibration in the α-anomer.28 These differences in characteristic peaks proved that the four MFP fractions were structurally different.
3.3. SEM analysis
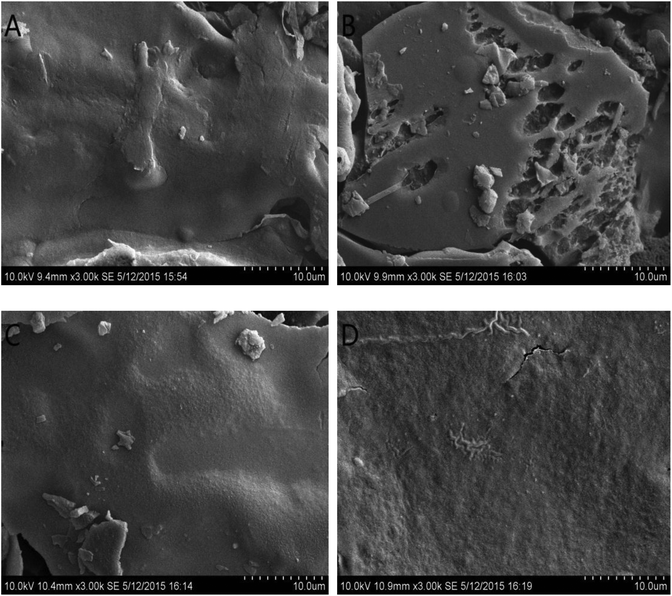
The surface topography of the MFP fractions was illustrated in Fig. 4. As shown in Fig. 4A and C, the surface structure of MFP-1 and MFP-3 was smooth with a tight structure but not flat. MFP-2 also showed a smooth surface but with distinct pore openings similar to the polysaccharides from Salvia miltiorrhiza Bunge extracted by the enzyme method.29 For MFP-4, the structure was tight and the surface was smooth with flocculent fibers.3.4. Polysaccharide conformation
The maximum absorption of Congo red will shift towards a longer wavelength when mixed with a triple-helix polysaccharide in solution. However, the maximum absorption of Congo red will decrease when the polysaccharide is transformed into a single coil conformation.30 The helix-coil transition of MFP fractions was analyzed at NaOH concentrations ranging from 0 to 0.5 M and laminarin and curdlan with a triple-helix conformation were used as controls (Fig. 5A). The maximum absorption for laminarin and curdlan solutions was at 506 and 505 nm, respectively, whereas in distilled water, their maximum absorption wavelengths were decreased to 495 nm. This indicated the formation of triple-helix polysaccharide-Congo red complexes. With the increasing concentration of NaOH, the maximum absorption wavelength decreased for the disruption of the helical conformation. However, at any concentration of NaOH, all MFP fractions showed no specific shift of the maximum absorption. These findings revealed that MFP-1, MFP-2, MFP-3 and MFP-4 had no triple-helix conformation.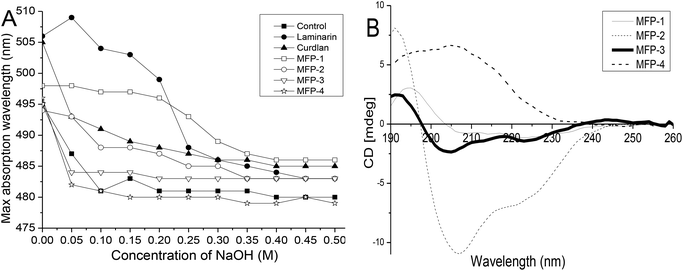 | ||
| Fig. 5 Structure analysis of MFP-1, MFP-2, MFP-3 and MFP-4: (A) helix-coil transition analysis; (B) CD spectra. | ||
3.5. Circular dichroism spectroscopy (CD)
Circular dichroism is an effective method to determine the conformational changes of organic compounds including polysaccharides. Generally, the different CD behaviors of polysaccharides aroused by their asymmetry depend upon the differences in the ring geometry around the carboxyl chromophore and the effect of the neighboring groups.31 As shown in Fig. 5B, spectra of MFP-1 exhibited a positive Cotton effect near 195 nm and a negative Cotton effect near 209 nm with moderate intensity. Compared with MFP-1, the spectra of MFP-2 and MFP-3 showed a minor blue shift and different degrees of increasing and decreasing intensities. However, the spectra of MFP-4 showed a great red shift with the positive Cotton effect near 204 nm with increasing intensity and the negative Cotton effect neat 233 nm with decreasing intensity. The position and intensity change of the Cotton effect was attributed to the various asymmetric structures and different degrees of asymmetry of MFP fractions.19 These results indicated that MFP-1, MFP-2, MFP-3 and MFP-4 had different structures.3.6. Antioxidant activities
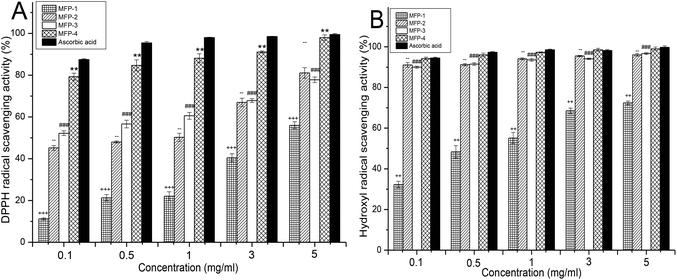
As given in Fig. 6A, all fractions of MFP demonstrated a concentration dependent quenching of DPPH radicals. The scavenging effects of various samples increased with increasing concentration in the range of 0.1–5 mg ml−1. Obviously, the DPPH scavenging activity of MFP-1 was the weakest and MFP-4 was the strongest at every concentration. From 0.1–1 mg ml−1, MFP-3 showed stronger DPPH scavenging activity than MFP-2, and they were almost equivalent from 3 to 5 mg ml−1. At 5 mg ml−1, the scavenging activity of MFP-1 was 56.03 ± 1.64%, MFP-2 was 81.13 ± 2.51%, MFP-3 was 77.83 ± 1.37%, and MFP-4 was 98.03 ± 1.31% which was approximately equal to that of ascorbic acid (99.51 ± 0.45%).
3.7. Identification of extracts with α-amylase and α-glucosidase inhibitory effects
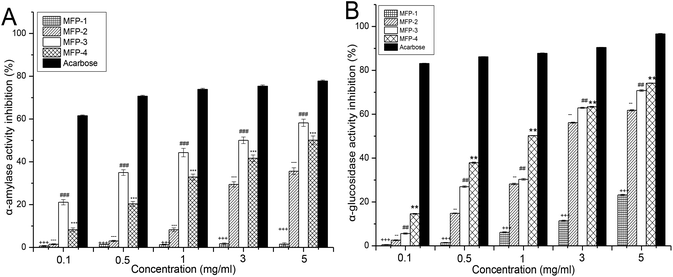
The postprandial blood sugar content could be effectively suppressed by inhibiting the activity of α-amylase and α-glucosidase.39 Hydrolysis of dietary starch is the main source of glucose in the blood, and the contribution of α-amylase is a prerequisite for the initiation of this process.40 Human α-amylase, secreted from the pancreas and salivary glands, can digest starch breaking it into smaller oligosaccharides.41 Then the α-glucosidase, located in the brush-border surface membrane of intestinal cells, degrades the oligosaccharides into monosaccharides which are absorbed by the intestinal epithelia resulting in the increase of the blood glucose level.42 Therefore, inhibition of the two hydrolytic enzymes could retard the influx of glucose from the intestinal tract to blood vessels restraining the increase of the postprandial blood level. Currently, inhibition of α-amylase and α-glucosidase is regarded as one of the most effective approaches for diabetes treatment.43The inhibitory effects of MFP fractions on α-amylase and α-glucosidase are presented in Fig. 7. MFP-1 had the weakest and non dose-dependent inhibitory effects on α-amylase as shown in Fig. 7A. The α-amylase inhibitory effects of MFP-2, MFP-3 and MFP-4 all increased with the increasing concentration of the sample from 0.1 to 5 mg ml−1. Particularly, MFP-3 showed the strongest inhibitory effect on α-amylase at each concentration. The α-amylase inhibitory effect could be determined as acarbose > MFP-3 > MFP-4 > MFP-2 > MFP-1.
As shown in Fig. 7B, the four MFP fractions exhibited concentration-dependent effects on α-glucosidase inhibition from 0.1 to 5 mg ml−1. At every concentration point, the α-glucosidase inhibitory effect of MFP-1 was the weakest and that of MFP-4 was the strongest. Evidently, the α-glucosidase inhibitory effect could be determined as acarbose > MFP-4 > MFP-3 > MFP-2 > MFP-1. In general, MFP-3 and MFP-4 could be identified as the main polysaccharide fractions of MFP with a significant inhibitory effect on α-amylase and α-glucosidase. Although their inhibitory effects were lower than those of acarbose, they still possess great potential in diabetes care because they have no side effects and multi effects including antioxidant activity. It was speculated that the inhibitory effects might be attributed to the physical interference of polysaccharides, which delayed the action of α-amylase and α-glucosidase through capsuling starch and enzymes. Also, the polysaccharides may directly interact with enzymes hindering the enzymes to a certain extent.44
4. Conclusion
Four fractions (MFP-1, MFP-2, MFP-3 and MFP-4), accounting for 2.74, 4.26, 15.17, and 29.39% of the MFP, respectively, were obtained from crude MFP after purification by a DEAE-Sepharose fast-flow column. The carbohydrate content in MFP-1, MFP-2, MFP-3 and MFP-4 was 88.37 ± 1.34, 75.68 ± 2.67, 86.34 ± 0.57, and 81.33 ± 1.10%. Arabinose, galactose, glucose, xylose, mannose and galacturonic acid were the major components present in the polysaccharide fractions. The surface structure of MFP-1 and MFP-3 was smooth, whereas MFP-2 and MFP-4 fractions possess pore openings and flocculent fibers along with a smooth surface. No triple-helical conformation was observed in any fraction of the polysaccharides. Compared with others, the MFP-4 fraction had a narrower molecular weight distribution. In general, MFP-3 and MFP-4 depicted better antioxidant activity and inhibitory effects on α-amylase and α-glucosidase compared to MFP-1 and MFP-2 fractions. This indicated that MFP-3 and MFP-4 could be further explored as potential agents in the treatment of diabetes.Conflicts of interest
The authors have no conflicts of interest to declare.Acknowledgements
Financial and moral assistance provided by Guangdong Science and Technology Program (2012B050500003), the Guangzhou Science and Technology Program (2013J4500036), and the Leading Talents Program in Guangdong Province (Ruihai Liu) to conduct the present project is gratefully acknowledged.References
- J. Wang, W. Jin, W. Zhang, Y. Hou, H. Zhang and Q. Zhang, Carbohydr. Polym., 2013, 95, 143–147 CrossRef CAS PubMed.
- M. Jeszka-Skowron, E. Flaczyk, J. Jeszka, Z. Krejpcio, E. Król and M. S. Buchowski, J. Funct. Foods, 2014, 8, 9–17 CrossRef CAS.
- M. Huang, F. Wang, X. Zhou, H. Yang and Y. Wang, Carbohydr. Polym., 2015, 117, 91–98 CrossRef CAS PubMed.
- S. Jiang, P. Du, L. An, G. Yuan and Z. Sun, Int. J. Biol. Macromol., 2013, 55, 118–122 CrossRef CAS PubMed.
- J. S. Lee, A. Synytsya, H. B. Kim, D. J. Choi, S. Lee, J. Lee, W. J. Kim, S. Jang and Y. I. Park, Int. Immunopharmacol., 2013, 17, 858–866 CrossRef CAS PubMed.
- Q. Deng, X. Zhou and H. Chen, Carbohydr. Polym., 2014, 111, 775–782 CrossRef CAS PubMed.
- A. Edwards, L. A. J. Mur, S. E. Girdwood, A. M. Anesio, M. Stibal, S. M. E. Rassner, K. Hell, J. A. Pachebat, B. Post, J. S. Bussell, S. J. S. Cameron, G. W. Griffith, A. J. Hodson and B. Sattler, FEMS Microbiol. Ecol., 2014, 89, 222–237 CrossRef CAS PubMed.
- E. C. Francisco, T. T. Franco, R. Wagner and E. Jacob-Lopes, Bioprocess Biosyst. Eng., 2014, 37, 1497–1505 CrossRef CAS PubMed.
- J.-E. Li, S.-P. Nie, M.-Y. Xie and C. Li, J. Funct. Foods, 2014, 6, 410–418 CrossRef CAS.
- Q. Liu, G. Tian, H. Yan, X. Geng, Q. Cao, H. Wang and T. B. Ng, J. Agric. Food Chem., 2014, 62, 8858–8866 CrossRef CAS PubMed.
- L. H. Pan, X. F. Li, M. N. Wang, X. Q. Zha, X. F. Yang, Z. J. Liu, Y. B. Luo and J. P. Luo, Int. J. Biol. Macromol., 2014, 64, 420–427 CrossRef CAS PubMed.
- P. Yi, N. Li, J. B. Wan, D. Zhang, M. Li and C. Yan, Carbohydr. Polym., 2015, 121, 183–189 CrossRef CAS PubMed.
- M. Dubois, K. A. Gilles, J. K. Hamilton, P. Rebers and F. Smith, Anal. Chem., 1956, 28, 350–356 CrossRef CAS.
- N. Li, W. Mao, M. Yan, X. Liu, Z. Xia, S. Wang, B. Xiao, C. Chen, L. Zhang and S. Cao, Carbohydr. Polym., 2015, 121, 175–182 CrossRef CAS PubMed.
- M. M. Bradford, Anal. Biochem., 1976, 72, 248–254 CrossRef CAS PubMed.
- W. Liao, Z. Luo, D. Liu, Z. Ning, J. Yang and J. Ren, J. Agric. Food Chem., 2015, 63, 535–544 CrossRef CAS PubMed.
- C. Li, X. Fu, F. Luo and Q. Huang, Food Hydrocolloids, 2013, 32, 79–86 CrossRef CAS.
- H. H. Lee, J. S. Lee, J. Y. Cho, Y. E. Kim and E. K. Hong, J. Microbiol. Biotechnol., 2009, 19, 455–461 CrossRef CAS PubMed.
- J. Wang, H. Chen, Y. Wang and L. Xing, Int. J. Biol. Macromol., 2015, 75, 210–217 CrossRef CAS PubMed.
- C. Li, Q. Huang, X. Fu, X. J. Yue, R. H. Liu and L. J. You, Int. J. Biol. Macromol., 2015, 75, 298–305 CrossRef CAS PubMed.
- N. Smirnoff and Q. J. Cumbes, Phytochemistry, 1989, 28, 1057–1060 CrossRef CAS.
- Y. I. Kwon, E. Apostolidis and K. Shetty, J. Food Biochem., 2008, 32, 15–31 CrossRef CAS.
- S. Lordan, T. J. Smyth, A. Soler-Vila, C. Stanton and R. P. Ross, Food Chem., 2013, 141, 2170–2176 CrossRef CAS PubMed.
- J. S. Lee, A. Synytsya, H. B. Kim, D. J. Choi, S. Lee, J. Lee, W. J. Kim, S. Jang and Y. I. Park, Int. Immunopharmacol., 2013, 17, 858–866 CrossRef CAS PubMed.
- W. Wei, W. Zhou, N. Zang and L. Jiang, Carbohydr. Polym., 2007, 70, 341–344 CrossRef CAS.
- M. Cobs-Rosas, J. Concha-Olmos, C. Weinstein-Oppenheimer and M. E. Zuniga-Hansen, Carbohydr. Polym., 2015, 117, 923–932 CrossRef CAS PubMed.
- L. Sun, L. Wang, J. Li and H. Liu, Food Chem., 2014, 160, 1–7 CrossRef CAS PubMed.
- M. A. Coimbra, F. Gonçalves, A. S. Barros and I. Delgadillo, J. Agric. Food Chem., 2002, 50, 3405–3411 CrossRef CAS PubMed.
- W. Wu, Y. Zhu, L. Zhang, R. Yang and Y. Zhou, Carbohydr. Polym., 2012, 87, 1348–1353 CrossRef CAS.
- X. Xu, H. Yan and X. Zhang, J. Agric. Food Chem., 2012, 60, 11560–11566 CrossRef CAS PubMed.
- Y. Zhu, Q. Li, G. Mao, Y. Zou, W. Feng, D. Zheng, W. Wang, L. Zhou, T. Zhang, J. Yang, L. Yang and X. Wu, Carbohydr. Polym., 2014, 101, 606–613 CrossRef CAS PubMed.
- Y. Li, B. Jiang, T. Zhang, W. Mu and J. Liu, Food Chem., 2008, 106, 444–450 CrossRef CAS.
- A. Antoniolli, A. R. Fontana, P. Piccoli and R. Bottini, Food Chem., 2015, 178, 172–178 CrossRef CAS PubMed.
- H. Zhang, Y. Shao, J. Bao and T. Beta, Food Chem., 2015, 172, 630–639 CrossRef CAS PubMed.
- T. I. Imbs, A. V. Skriptsova and T. N. Zvyagintseva, J. Appl. Phycol., 2014, 27, 545–553 CrossRef.
- S. Shen, H. Cheng, X. Li, T. Li, M. Yuan, Y. Zhou and C. Ding, Eur. Food Res. Technol., 2014, 238, 1015–1021 CrossRef CAS.
- N. Liao, S. Chen, X. Ye, J. Zhong, X. Ye, X. Yin, J. Tian and D. Liu, J. Agric. Food Chem., 2014, 62, 2344–2352 CrossRef CAS PubMed.
- L. You, Q. Gao, M. Feng, B. Yang, J. Ren, L. Gu, C. Cui and M. Zhao, Food Chem., 2013, 138, 2242–2249 CrossRef CAS PubMed.
- S. E. Inzucchi, J. Am. Med. Assoc., 2002, 287, 360–372 CrossRef CAS PubMed.
- Y. I. Kwon, E. Apostolidis and K. Shetty, Bioresour. Technol., 2008, 99, 2981–2988 CrossRef CAS PubMed.
- U. Etxeberria, A. L. de la Garza, J. Campión, J. A. Martínez and F. I. Milagro, Expert Opin. Ther. Targets, 2012, 16, 269–297 CrossRef CAS PubMed.
- K. Y. Kim, T. H. Nguyen, H. Kurihara and S. M. Kim, J. Food Sci., 2010, 75, H145–H150 CAS.
- U. Etxeberria, A. Laura de la Garza, J. Campion, J. Alfredo Martinez and F. I. Milagro, Expert Opin. Ther. Targets, 2012, 16, 269–297 CrossRef CAS PubMed.
- J. Nsor-Atindana, F. Zhong and K. J. Mothibe, Food Funct., 2012, 3, 1044–1050 CAS.
| This journal is © The Royal Society of Chemistry 2016 |

