DOI:
10.1039/C5NJ02448J
(Paper)
New J. Chem., 2016,
40, 413-422
TD-DFT and structural investigation of natural photosensitive phenanthroperylene quinone derivatives†
Received
(in Montpellier, France)
12th September 2015
, Accepted 26th October 2015
First published on 30th October 2015
Abstract
Natural product derivatives of phenanthro[1,10,9,8-opqra]perylene-7,14-dione (PPD) are important potential agents in photodynamic therapy. Density functional theory (DFT) optimized geometries and time-dependent DFT (TD-DFT) vertical transitions of fringelite D (a pigment from an extinct species of sea lily), hypericin (an active component of Saint John's wort), stentorin C (Stentor coeruleus), blepharismin C (Blepharisma japonicum) and amethystin (Stentor amethystinus) are in good agreement with experimental structural, IR and UV-Vis data. The structure of the newly isolated amethystin has not been fully determined, but comparisons between the experimental and DFT IR frequencies suggest that this compound most likely adopts an orthoester structure. The π → π* excitations in the molecules are traceable to the PPD core, and are bathochromically shifted due to the peri –OH substituents with a smaller effect from the molecular twist induced by bay –Me and/or –OH groups. Hydrogen bonding between the peri –OH groups and the carbonyls is important to the ability of these species to photochemically generate singlet oxygen and superoxide ions.
Introduction
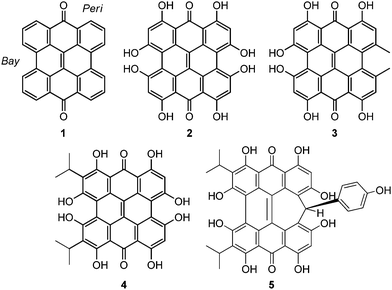
Natural products based upon the phenanthro[1,10,9,8-opqra]perylene-7,14-dione (PPD, 1) chromophore1,2 are important photosensitizers with extended π-conjugated systems and have potential application in photodynamic therapy (PDT).3 Colorful derivatives of 1 are found in various organisms including plants from the genus Hypericum4 and the ciliates Stentor5 and Blepharisma6 (Fig. 1). Fringelite D (2), a red pigment from an extinct species of sea lily,7,8 may have functioned as an ingestion deterrent. Hypericin (3), isolated from Hypericum perforatum (St. John's wort), is also red and causes hypericism, a condition that triggers severe sensitivity to sunlight, intense skin irritation, elevated body temperatures and sometimes death.1,33 has been used in traditional medicine to treat depression,9 but may be effective against viral and bacterial infections,3,10–12 and cancer.9,13 Hydrogen bonding interactions between 3 and the N7 position of guanine and adenine can disrupt DNA function14,15 to inhibit the replication process of various viruses including FV (Friend leukemia virus), Rad-LV (radiation-induced leukemia virus), and EIAV (equine infectious anemia virus).9–11,15 Stentorin C (4) is a blue pigment isolated from Stentor coeruleus5 (Fig. 1a) structurally determined by total synthesis as the 3,3′-diisopropyl derivative.16 Blepharismin C (5) is the primary pigment produced by Blepharisma japonicum (Fig. 1b).6,17
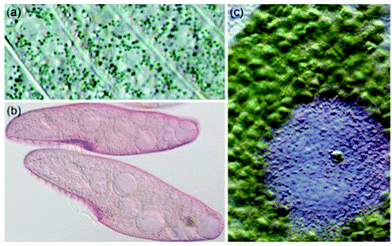 |
| | Fig. 1 (a) Pigment-containing granules of Stentor coeruleus (b) Blepharisma japonicum organisms, and (c) Stentor amethystinus granules. (S. coeruleus and S. amethystinus provided with permission from Michael Plewka (http://www.plingfactory.de); B. japonicum provided with permission from Gerald Helbig (http://www.lebendkulturen.de).) | |
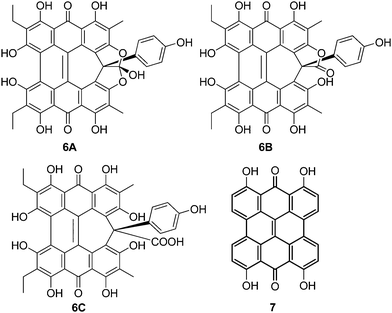
Amethystin (6) was recently isolated from Stentor amethystinus and is distinguishable from its stentorin and blepharismin relatives by its violet color (Fig. 1c).18 Three structures have been proposed for 6: orthoester A (solution-phase), lactone isomer B (possible crystal form), and free acid C (suggested by elemental analysis but inconsistent with IR data). Amethystin (6) has been proposed to act as either a photosensor or for defense.18 The biosynthetic pathway for 5 and 6 is proposed to be similar to that of 3 and 4 with the cycloheptatriene ring and phenol group originating from the addition of p-hydroxyphenylglyoxylic acid to the protostentorin intermediate.19–21
How the structural features of these colorful compounds affect their absorption spectra is important for understanding their mechanisms of photoactivity. Density functional theory (DFT) and time-dependent DFT (TD-DFT) methods, shown to be useful for the prediction of properties of PDT agents,22–25 have been used to examine the structures and electronic transitions in the UV-Vis region of 2–6 for comparison to experimental data and the parent PPD (1) and to suggest the structure for 6. These results show that the photoexcitations of these natural products can be traced to the structural modifications of the parent PPD chromophore.
Theoretical methods
1–6 were optimized with Gaussian 0926 using DFT and a series of exchange correlation (xc) functionals (M06-L,27 mPW1PW91,28 B3LYP, PBE0, ωB97, BLYP, TPSSh, LC-ωPBE, CAM-B3LYP). Geometries were optimized with the split-valence triple-ζ plus polarization functions (TZVP). Calculations in larger basis sets (cc-pVTZ, TZVP+, TZV2P+, TZV2P+f) provided similar optimized structures and theoretical excitation spectra. Uncorrected vibrational frequencies were calculated to verify the structures as minima on the potential energy surface. The modelling of the excitation spectra of the PPD derivatives is consistent with established procedures for the calculation of vertical transitions in dye molecules.29–31 TD-DFT was used to produce the first 30 singlet vertical excitations for comparison to experimental UV-Vis spectra. This approach typically leads to inaccuracies of 0.24–0.41 eV based upon a comparison of vertical and 0–0 transitions for a series of large molecules.32 Although optimized geometries were similar in all functionals, TD-DFT vertical excitations calculated with the hybrid functionals B3LYP, mPW1PW91, PBE0 and ωB97 were found to underestimate and the pure functional BLYP to overestimate the experimental excitation wavelengths of 1 (Table S1, ESI†). The ωB97 transition wavelengths were particularly poor (underestimated by ∼100 nm). The PBE0 and B3LYP xc functionals are commonly used and typically predict vertical transitions to within 0.2 eV. However, the TPSSh and M06-L functionals gave the best agreement with the experimental values for the compounds under examination in this work. The M06-L was found to be more accurate for the calculation of vertical TD-DFT transitions than other pure functionals.33 In select cases, the vibrationally-corrected excitation spectrum was calculated from the TD-DFT-optimized geometry of the first singlet excited state using the Franck–Condon–Herzberg–Teller method as implemented by the FCClasses routines.34–36 Geometry optimizations and vertical TD-DFT calculations were performed in the gas-phase and using the integral equation formalism variant of the polarisable continuum mode (IEF-PCM) implicit solvation method37 with solvents that correspond to the experiment (DMSO (1), THF (2), ethanol (3 and 5), and methanol (4 and 6)). PCM-type solvation models are most applicable when modelling systems in which there is no hydrogen bonding. As a result, the inclusion of implicit solvation effects often does not significantly affect the transition energies.33
Results and discussion
Phenanthro[1,10,9,8-opqra]perylene-7,14-dione (PPD, 1)
The extended π-conjugated system of 1 is the structural backbone for the colorful and potentially therapeutic natural products 2–6. 1 is generally insoluble in common organic solvents and its fluorescence is observed in protic, but not aprotic solvents.38 Two bands are observed experimentally in the visible region (423 and 410 nm). The DFT(TPSSh)/TZVP optimized geometry of 1 (D2h, Fig. 2) displayed a strong carbonyl stretch at 1725 cm−1 comparable to the experimental value (1661 cm−1 KBr).39 TD-DFT calculations find two vertical transitions with significant oscillator strengths (f, a measure of the predicted intensity) in the visible region (gas-phase: 437 nm, 433 nm; DMSO: 459 nm, 456 nm) in agreement with previous Pariser–Parr–Pople calculations.40 These two bands are roughly consistent with the 423 nm experimental peak and are assigned as π → π* type transitions (HOMO−1 → LUMO and HOMO → LUMO, respectively, Fig. 2).
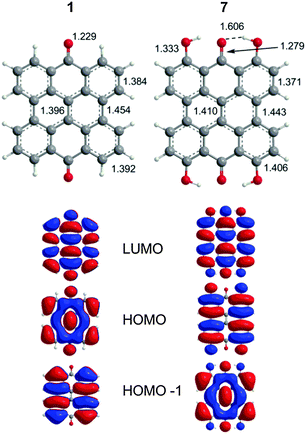 |
| | Fig. 2 DFT(TPSSh)/TZVP optimized geometries of 1 and 7 with MOs relevant to the excitation spectrum as determined by TD-DFT calculations. | |
Fringelite D (2), hypericin (3) and stentorin C (4)
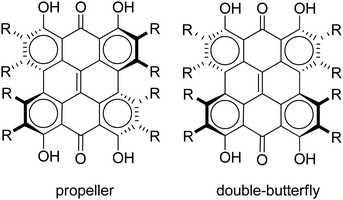
Steric interactions between the bay –OH and/or –Me groups force compounds 2–4 into nonplanar conformations, principally the “propeller” and the “double-butterfly” conformations.1,7,41,42 The propeller is the most stable for 2–4 with the double-butterfly being slightly higher in energy (DFT(M06-L)/TZVP, ΔE = 2.4 kcal mol−1, 2.7 kcal mol−1, 2.8 kcal mol−1, respectively), consistent with the X-ray43 and molecular mechanics structure of 3.44 Only the major tautomers44,45 were considered with the maximum hydrogen bonding between –OH and carbonyl groups. Both peri –OH groups are hydrogen bonded to the carbonyls and one hydrogen bond is assumed between the bay –OH groups. The minimum conformation of 2 and 4 orients the hydrogen bonds of the two sets of bay –OH groups in opposite directions (Fig. 3). The hydrogen bonds with the peri –OH groups weaken the carbonyl bond and extend the aromaticity of the system by forming cyclic interactions that satisfy the Hückel rule. Breaking any one of the hydrogen bonding interactions leads to a higher energy structure (∼30.0 kcal mol−1 if all interactions are broken). Enantiomers of the propeller and double-butterfly conformations were identical in energy. Interconversion between the propeller, double-butterfly and their enantiomers may occur at room temperature due to the low barrier for twisting the bay hydroxyl groups (6.7 kcal mol−1).44 However, only one conformer of 3 is observed in NMR studies.46 DFT(TPSSh)/TZVP bond distances and dihedrals for 3 compare favorably to previous DFT studies,47 and structural parameters for 2 and 4 were very similar to 3. The gas-phase vibrational frequencies for 2–4 correlate well to reported experimental IR values.5,7,48 An abridged list of the major frequencies can be found in Table 1.
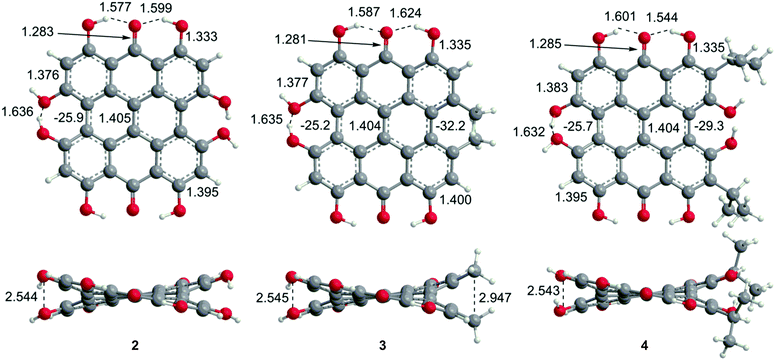 |
| | Fig. 3 DFT(TPSSh/TZVP) optimized geometries for the propeller conformation of 2–4 in gas phase. Bond distances are listed in Å. | |
Table 1 Comparison of experimental (in italics) and selected DFT(TPSSh)/TZVP vibrational frequencies for the propeller conformation of 2–4
| Mode |
2
|
3
|
4
|
|
Ref. 7.
Ref. 48.
Ref. 5.
|
| O–H, bay |
3505, 3770 |
3511, 3771 |
3481, 3513, 3737, 3774 |
| C–H str, ring (w) |
3174 (w) |
3174, 3180 |
3174 |
| C–H str, chain (w) |
|
3042, 3091, 3095, 3139, 3142 |
3006–3031, 3070–3096, 3106, 3114, 3122, 3132 |
| O–H, peri |
2977, 3095 |
3003, 3045, 3106, 3128 |
2888, 2965, 3037, 3105 |
C![[double bond, length as m-dash]](https://www.rsc.org/images/entities/char_e001.gif) O O |
1670 |
1663, 1667 |
1664 |
|
1572
|
1620
|
1600
|
| Ring |
1305, 1316, 1335, 1375, 1414, 1472, 1438, 1493, 1513, 1566, 1603, 1618, 1640 |
1298, 1334, 1363–1373, 1411, 1426, 1472, 1501–1525, 1605, 1623, 1626, 1636 |
1296, 1310, 1333, 1371, 1400, 1415, 1437, 1459, 1473, 1495, 1511, 1523, 1599, 1610–1618, 1640 |
|
1437,a1419,a1272a |
1560
|
1587
|
| C–H, O–H wag |
1183, 1209, 1225 |
1178, 1210, 1225, 1273 |
1202–1215, 1240 |
|
1175,a1110a |
1064
|
|
Wavelengths, oscillator strengths (f), and MOs for the TD-DFT(TPSSh) vertical transitions of 2–4 are generally in good agreement with the experimental spectra and early Pariser–Parr–Pople calculations (Table 2).40,41,49,50 Calculations on the propeller and double-butterfly conformations gave similar excitation wavelengths in the gas phase and the PCM solvation model, thus only the propeller will be described in the following discussion. Experimentally, 5–6 absorption bands are observed in the 330–600 nm range for 2–4 and assigned as π → π* excitations. Based on the TD-DFT transitions (Table 2), the three bands can be assigned to major electronic transitions in analogy to the interpretation of the UV-Vis spectrum of 3.49 The S0 → S1 excitation is found at 570–600 nm and assigned as the HOMO → LUMO excitation, bathochromically shifted relative to 1. The natural transition orbitals51 for these excitations are similar in character to the HOMO and LUMO and are shown in the ESI,† (Fig. S1). The S0 → S2 band at 475–480 nm are generally lower in intensity and assigned as having HOMO−1 → LUMO and/or HOMO−2 → LUMO character. For 3, the experimental band at 385 nm is attributed to the HOMO → LUMO+1 excitation, but has low intensity (f = 0.02) and is not reported for 2 and 4. A more intense band observed in the region 330–340 nm corresponds to the HOMO → LUMO+2 excitation mixed with contributions from other transitions. Other bands in the UV-Vis spectrum are attributed to vibronic coupling to the electronic transitions (vide infra).
Table 2 Assignment of experimental UV-Vis bands to selected vertical TD-DFT (TPSSh/TZVP) transitions for the propeller conformation of 2–4
| |
Expa (λ/nm) |
Vertical excitation wavelength, nm (oscillation strength) |
Excitations (TPSSh) |
| TPSSh/TZVP |
M06-L/TZVP |
IEF-PCM-M06-L/TZVP |
PBE0/TZVP |
|
Experimental in THF for 2,7 EtOH for 3,49 and MeOH for 4.53 IEF-PCM calculations were performed in MeOH.
Experimental bands attributed to vibronic coupling.
Vibronically coupled excitations calculated using the Franck–Condon–Herzberg–Teller method.
|
|
2
|
577 |
572 (0.21) |
583 (0.20) |
591 (0.30) |
522 (0.26) |
0.70 HOMO → LUMO |
| 564,c 550c |
| 536b |
|
|
|
523c |
|
| 501b |
|
|
|
488c |
|
| 443 |
457 (0.16) |
471 (0.15) |
466 (0.29) |
414 (0.21) |
0.68 HOMO−2 → LUMO |
| −0.16 HOMO−3 → LUMO |
| 419 |
391 (0.02) |
403 (0.02) |
413 (0.02) |
357 (0.02) |
0.68 HOMO−4 → LUMO |
| −0.16 HOMO → LUMO+2 |
| 334 |
337 (0.27) |
345 (0.23) |
344 (0.37) |
310 (0.40) |
0.63 HOMO → LUMO+2 |
| +0.13 HOMO → LUMO+4 |
| +0.14 HOMO−1 → LUMO |
| −0.11 HOMO−2 → LUMO+1 |
| −0.10 HOMO−4 → LUMO |
|
|
|
3
|
591 |
587 (0.22) |
599 (0.21) |
602 (0.30) |
533 (0.26) |
0.69 HOMO → LUMO |
| 547b |
|
|
|
|
|
| 510b |
|
|
|
|
|
| 475 |
475 (0.10) |
493 (0.06) |
485 (0.20) |
427 (0.18) |
0.64 HOMO−1 → LUMO |
| +0.22 HOMO−2 → LUMO |
| +0.14 HOMO−3 → LUMO |
| 456 (0.07) |
474 (0.09) |
475 (0.07) |
412 (0.04) |
0.66 HOMO−2 → LUMO |
| −0.19 HOMO−1 → LUMO |
| 382 |
416 (0.04) |
396 (0.01) |
390 (0.01) |
369 (0.02) |
0.55 HOMO → LUMO+1 |
| +0.10 HOMO−1 → LUMO |
| −0.36 HOMO−3 → LUMO |
| +0.21 HOMO−4 → LUMO |
| 332 |
334 (0.15) |
341 (0.10) |
337 (0.28) |
306 (0.27) |
0.59 HOMO → LUMO+2 |
| −0.12 HOMO → LUMO+3 |
| +0.21 HOMO → LUMO+4 |
| +0.22 HOMO−2 → LUMO+1 |
| −0.10 HOMO−8 → LUMO |
|
|
|
4
|
598 |
574 (0.24) |
584 (0.23) |
591 (0.31) |
523 (0.28) |
0.70 HOMO → LUMO |
| 554b |
|
|
|
|
|
| 516b |
|
|
|
|
|
| 452 |
477 (0.17) |
491 (0.16) |
486 (0.27) |
432 (0.23) |
0.67 HOMO−1 → LUMO |
| +0.13 HOMO → LUMO+2 |
| +0.13 HOMO−3 → LUMO |
| 344 |
338 (0.22) |
346 (0.32) |
342 (0.32) |
310 (0.37) |
0.60 HOMO → LUMO+2 |
| +0.11 HOMO → LUMO+3 |
| +0.11 HOMO → LUMO+4 |
| −0.12 HOMO−1 → LUMO |
| −0.10 HOMO−4 → LUMO |
| +0.17 HOMO−8 → LUMO |
| +0.14 HOMO−9 → LUMO |
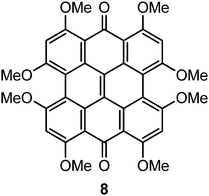
The characters of the MOs of 2–4, particularly for the most symmetric 2 (point group: C2), are clearly traceable to their analogues in 1 (compare Fig. 2 and 4). The peri hydroxyls are the major contributor to the destabilization of the MOs relative to 1 with minor contribution from the twist. Calculations of the PPD core substituted only at the peri position (7, fringelite H, Fig. 2) show that the antibonding character between the parent π system and the p-type orbitals of the peri –OH groups shifts the HOMO–LUMO excitation to 575 nm and destabilizes the MO analogous to HOMO−1 in 1 to the HOMO as shown for 2–4. The hydrogen bonding interactions between the peri –OH groups and the carbonyls are also important to the electronic structure of 2–4. The per-methylated derivative 8 has a similar C![[double bond, length as m-dash]](https://www.rsc.org/images/entities/char_e001.gif) O bond length and HOMO to 1, but its HOMO−1 and HOMO−2 are lone pair MOs of the carbonyls. These results suggest that hydrogen bonding in the peri region is necessary to destabilize the π system through further delocalization. A similar effect may occur when protonation of 1 and per-methylated 3 shifts their photophysical properties to be more similar to 3 itself.45 The molecular twist further shifts the HOMO–LUMO transition by 10–20 nm (Table 2) and leads to the additional excitation bands versus1 observed in the experimental spectra. In 3, the replacement of one set of bay –OH groups with –Me groups enhances the twist on one side of the molecule due to increased repulsion (Fig. 3). The i-Pr groups in 4 also decrease the symmetry, but to a lesser extent, leading to minor distortions in the π lobes relative to 2. HOMO−1, analogous to the HOMO of 1, is destabilized by the twisting of the PPD backbone which partially disrupts the donut-like lobe (Fig. 4). The enhanced twist and asymmetry of 3 and 4 further destabilize HOMO−1 to shift the transition of these electrons to longer wavelengths (Table 2).
O bond length and HOMO to 1, but its HOMO−1 and HOMO−2 are lone pair MOs of the carbonyls. These results suggest that hydrogen bonding in the peri region is necessary to destabilize the π system through further delocalization. A similar effect may occur when protonation of 1 and per-methylated 3 shifts their photophysical properties to be more similar to 3 itself.45 The molecular twist further shifts the HOMO–LUMO transition by 10–20 nm (Table 2) and leads to the additional excitation bands versus1 observed in the experimental spectra. In 3, the replacement of one set of bay –OH groups with –Me groups enhances the twist on one side of the molecule due to increased repulsion (Fig. 3). The i-Pr groups in 4 also decrease the symmetry, but to a lesser extent, leading to minor distortions in the π lobes relative to 2. HOMO−1, analogous to the HOMO of 1, is destabilized by the twisting of the PPD backbone which partially disrupts the donut-like lobe (Fig. 4). The enhanced twist and asymmetry of 3 and 4 further destabilize HOMO−1 to shift the transition of these electrons to longer wavelengths (Table 2).
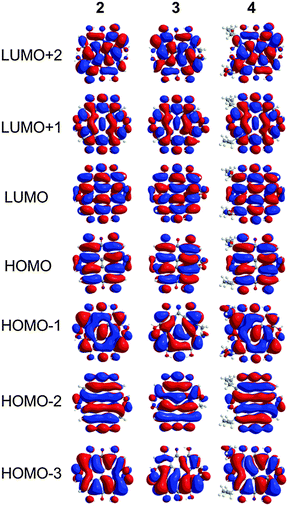 |
| | Fig. 4 MOs contributing to the UV-Vis excitations for 2–4 as calculated with TD-DFT. | |
The experimental spectra of 2–4 contain peaks in the 500–555 nm range that do not correlate with the vertical TD-DFT transitions. In a detailed analysis of 3, Wynn and Cotton assign this band as absorption to a vibronic level of the S0 → S1 excitation.49 The vibrationally corrected spectrum of 2 was calculated from the TD-DFT(PBE0)/TZVP-optimized structure of the first excited state (Fig. 5) using the Franck–Condon–Herzberg–Teller method. The 0–0 transition was predicted at 564 nm with vibronically coupled bands at 550, 523 and 488 nm. These bands can be attributed to the 545, 1402 and 1530 cm−1 modes of the excited state, all of which include stretching or wagging motions of the peri –OH groups. Like related studies of anthraquinone derivatives,52 the shape of the predicted spectrum (Fig. 5) is in very good agreement with the reported experimental spectrum (Table 2), with the 550 nm band assigned as a shoulder commonly observed on the main absorption of these PPD derivatives. Vibronic bands in the spectra of 3–6 are assigned on the basis of structural similarities of the PPD derivatives leading to coupling of the excitations with vibrational modes involving the peri –OH groups.
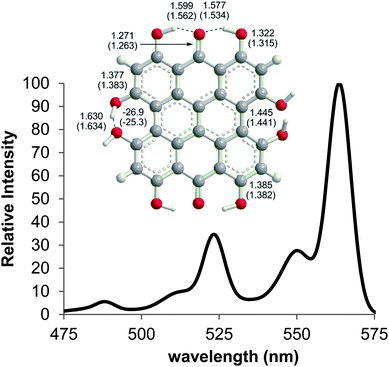 |
| | Fig. 5 Selected bond distances for the ground state (DFT(PBE0)/TZVP) and first excited state (TD-DFT(PBE0)/TZVP) of 2 and the vibronically coupled UV-Vis spectrum of 2 at 300 K calculated using the Franck–Condon–Herzberg–Teller method. | |
Blepharismin C (5) and amethystin (6)
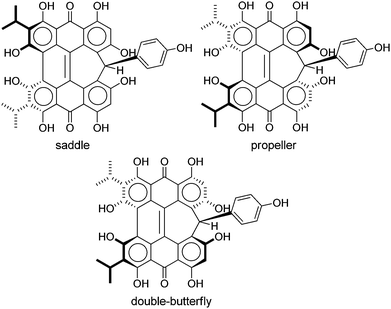
Like 2–4, blepharismin C (5) and amethystin (6) are based upon the PPD core, but modified during biosynthesis to incorporate a phenyl ring attached to a cycloheptatriene fragment (Fig. 6). Steric interactions between the bay region –OH groups can force 5 into a “saddle” conformation54 with the twist occurring on the end opposite of the cycloheptatriene ring, in addition to the propeller and the double-butterfly conformations.6,17 For 5, the saddle conformation is the most stable at the DFT(TPSSh)/TZVP level (Fig. 6). All attempts at optimization of the propeller and double-butterfly resulted in the saddle because the cycloheptatriene ring prevents the correct twist for the propeller and double-butterfly conformations. The endo-isomer (Fig. 5) with the phenol above the saddle was more stable than the exo-isomer by 5.6 kcal mol−1 in good agreement with experimental NMR data.55,56 Previous semi-empirical (AM1) studies showed that the endo-isomer is more stable than the exo-isomer (Fig. 6) and the interconversion barrier is high (43 kcal mol−1) due to the steric interactions required to invert the ring and pass the phenyl group through the bay hydroxyl groups.54,56 Another semi-empirical (PM3) study suggested that the exo-isomer in the propeller conformation was most stable but the structure did not include intramolecular hydrogen bonding interactions of the bay and peri –OH groups.6 The DFT vibrational frequency and intensity of the asymmetric carbonyl stretching mode (1617 cm−1) is consistent with the strong peak at 1597 cm−1 in the experimental IR spectrum.17
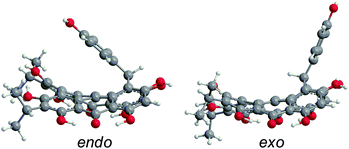 |
| | Fig. 6 DFT(M06-L)/TZVP optimized structures of 5 for the endo- and exo-isomers in the saddle conformation in gas phase, with the endo-isomer being most stable. | |
The three structures proposed for 6 (the orthoester A, the lactone isomer B, and the free acid C) may adopt nonplanar conformations similar to 5 (Fig. 7).18 For 6A, the saddle conformation is the most stable with all attempts of optimization in propeller and double-butterfly resulting in the saddle. However, both saddle and propeller conformations were found for 6B and 6C because these structures are not restricted by the orthoester rings of 6A. The propeller is most stable for 6B (2.8 kcal mol−1), and 6C has the saddle as the lowest energy conformation (20.7 kcal mol−1). DFT vibrational frequencies for 6A–C were compared to experimental data in order to assign the most probable structure. The DFT frequencies of 6A (Table 3) are most consistent with the available IR data and the experimental assignment based on the presence of only quinone carbonyl peaks and a weak carbonyl band at 1798 cm−1.18 The lack of an active mode in 6A around 1798 cm−1 suggests that the experimental IR spectrum may be of a mixture, most likely of 6A with 6C for which the DFT C![[double bond, length as m-dash]](https://www.rsc.org/images/entities/char_e001.gif) O stretching frequency was found at 1785 cm−1.
O stretching frequency was found at 1785 cm−1.
 |
| | Fig. 7 DFT(TPSSh)/TZVP optimized geometries of possible structures of 6 in the gas phase. The orthoester 6A is the preferred structure based upon IR analysis. | |
Table 3 Selected DFT(TPSSh)/TZVP vibrational frequencies of 5 and 6A
| Mode |
5
|
6A
|
| O–H, bay |
3403, 3623–3693, 3786 |
3539, 3733–3878 |
| C–H str, arom (w) |
3172–3215 |
3152–3198 |
| C–H str, chain (w) |
3028–3037, 3087–3128 |
2968, 3030–3060, 3089, 3099–3137 |
| O–H, peri |
2936–2962, 3063, 3167 |
2911, 3029, 3083, 3095 |
| Ring, complex |
1214, 1240, 1293, 1319, 1343, 1359, 1371–1382, 1417, 1445, 1465, 1487, 1504–1512, 1595–1601, 1615–1620, 1634, 1661, 1666 |
1140–1173, 1200, 1290–1300, 1320–1347, 1360, 1374, 1437, 1472, 1485, 1503, 1544, 1574, 1611, 1618, 1632, 1641–1644, |
| Ring Ph |
1542 |
1187 |
| C–H, O–H wag |
1190 |
|
Wavelengths and oscillator strengths (f) for the TD-DFT transitions for 5 and 6A were similar in the gas phase and in solvent and consistent with the experimental spectra. 6A was the best match with the experimental wavelengths (Table 4 and Table S2, ESI†). In the range 340–580 nm, four peaks are observed experimentally for 5 and 6A (Table 4) which are assigned to π → π* transitions based on the TD-DFT calculated spectra. The S0 → S1 band around 580 nm corresponds to the HOMO → LUMO excitation (Fig. 8) which is bathochromically shifted relative to 1 due to the destabilization of the HOMO by peri –OH groups as discussed for 2–4. Despite the structural changes to these molecules, the frontier MOs of 5 and 6A have similar character and vertical TD-DFT(TPSSh) transitions to 2–4 (compare Fig. 2, 4, and 8). The quaternary carbon and orthoester rings stabilize the conformation of 6A and cause minor changes in the MOs when compared to 5. No vertical TD-DFT transition is found corresponding to the ∼540 nm band which is assigned as a vibronic level based upon analogy to 2. The experimental excitation in the 490–495 nm range is assigned to the HOMO−2 → LUMO and HOMO−1 → LUMO excitations but the TD-DFT wavelengths are roughly 10 nm longer than the experimental values. The band between 340–360 nm corresponds to a mixture of higher energy excitations in 5 and 6A. HOMO−2 and HOMO−1 have large contributions from the phenol group of 5 in these excitations suggesting a charge-transfer component to the photoactivity which may be modified through substitutions to the phenol ring. These MOs bear less resemblance to the MOs of 1 due to the contributions of the phenol ring and the disruption of the extended π system by the cycloheptatriene ring. LUMO+2 of 5 has a minor contribution from the phenol group, but 6A has no contribution from the phenol group.
Table 4 Assignment of experimental UV-Vis bands to selected vertical TD-DFT(TPSSh)/TZVP transitions for 5 and 6A
| |
Expa (λ/nm) |
Vertical excitation wavelength, nm (oscillation strength) |
Excitations (TPSSh) |
| TPSSh/TZVP |
M06-L/TZVP |
IEF-PCM-M06-L/TZVP |
PBE0/TZVP |
|
Experimental in EtOH for 5 and in MeOH for 6A. IEF-PCM calculations were performed in MeOH.
Experimenal bands attributed to vibronic coupling.
|
|
5
|
∼580 |
568 (0.19) |
583 (0.17) |
0.17 (0.24) |
512 (0.23) |
0.69 HOMO → LUMO |
| ∼540b |
|
|
|
|
|
| ∼490 |
490 (0.14) |
503 (0.13) |
0.13 (0.22) |
448 (0.10) |
0.52 HOMO−2 → LUMO |
| −0.46 HOMO−1 → LUMO |
| ∼340 |
345 (0.11) |
355 (0.08) |
0.08 (0.09) |
313 (0.18) |
0.61 HOMO → LUMO+2 |
| −0.12 HOMO−6 → LUMO |
| −0.18 HOMO−9 → LUMO |
| −0.11 HOMO−11 → LUMO |
|
|
|
6A saddle |
579 |
568 (0.19) |
583 (0.18) |
585 (0.26) |
510 (0.24) |
0.70 HOMO → LUMO |
| 538b |
|
|
|
|
|
| 494 |
500 (0.08) |
524 (0.04) |
523 (0.08) |
448 (0.21) |
0.52 HOMO−1 → LUMO |
| −0.46 HOMO−2 → LUMO |
| 488 (0.09) |
505 (0.15) |
507 (0.20) |
|
0.53 HOMO−2 → LUMO |
| −0.46 HOMO−1 → LUMO |
| 355 |
323 (0.10) |
347 (0.04) |
349 (0.04) |
332 (0.08) |
0.40 HOMO → LUMO+3 |
| +0.12 HOMO−1 → LUMO+2 |
| +0.31 HOMO−3 → LUMO+3 |
| +0.16 HOMO−4 → LUMO+3 |
| +0.12 HOMO−6 → LUMO+3 |
| +0.30 HOMO−10 → LUMO+2 |
| −0.13 HOMO−11 → LUMO+2 |
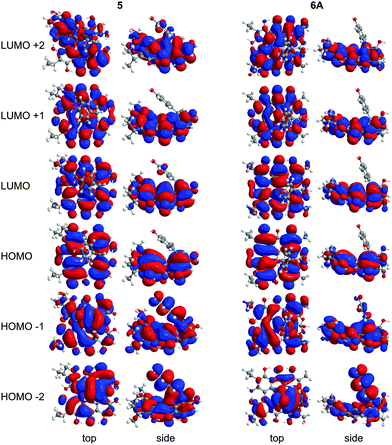 |
| | Fig. 8 MOs contributing to the UV-Vis excitations for 5 and 6A as calculated with TD-DFT. | |
Type I and II photochemical reactions
In an oxygen environment, the excited state triplet of photosensitizers (PS) either react initially with target molecules to form radical anions which are then scavenged by oxygen (Type I) or the triplet state of the PS can be quenched by 3O2 to form singlet oxygen (Type II).
| Type I: PS(T1) + S → PS−˙ + S+˙ |
| PS−˙ + 3O2 → PS(S0) + O2−˙ |
| Type II: PS(T1) + 3O2 → PS(S0) + 1O2 |
In Type I mechanisms, a potential PS is effective if electron transfer to oxygen to form superoxide ions is thermodynamically favourable. Type II mechanisms are favourable if the singlet–triplet gap (ΔES–T) for the PS is greater than for oxygen. These criteria can be estimated from the vertical electron affinities (VEA), adiabatic electron affinities (AEA) and ΔES–T values (Table 5). For the Type I mechanism, the larger VEA for the triplet state relative to the ground state indicates the general ability of the excited PPD derivatives to oxidize surrounding molecules.47 Comparison of the AEAs of the PS radical anion and 3O2 suggest reduction to superoxide is favourable by 0.05–0.1 eV for the AEA of triplet oxygen calculated at the same level of theory. The VEA and AEA values for 3 are comparable to a previous study by Guedes and Eriksson47 in which a more favourable energy difference (0.4 eV) was predicted based upon a 3O2 AEA of 3.91 eV. For the Type II mechanism, each of the PPD derivatives have a higher ΔES–T than the 3Σg− → 1Δg transition of oxygen (0.98 eV) and would be predicted to catalyze the production of singlet oxygen. In contrast, although the singlet–triplet gap (1.80 eV) of 8 is similar to 2–6, its VEA are too low to sustain Type I or Type II photochemical reactions, suggesting that the peri –OH–carbonyl hydrogen bonds are critical to photoactivity.
Table 5 DFT(M06-L)/TZVP vertical singlet–triplet gaps and electron affinities (eV) for PPD derivatives 2–6a
| |
Solvent |
ΔES–T |
VEA(S0) |
VEA(T1) |
AEA(S0) |
|
AEA for 3O2: 3.36 (water), 3.33 (DMSO), 3.29 (MeOH) eV.
|
|
2
|
Gas phase |
1.59 |
1.88 |
3.48 |
2.01 |
| Water |
1.61 |
3.15 |
4.76 |
3.25 |
| DMSO |
1.61 |
3.14 |
4.74 |
3.24 |
| MeOH |
1.61 |
3.12 |
4.73 |
3.23 |
|
|
|
3
|
Gas phase |
1.56 |
1.92 |
3.47 |
2.03 |
| Water |
1.57 |
3.19 |
4.76 |
3.25 |
| DMSO |
1.57 |
3.17 |
4.75 |
3.27 |
| MeOH |
1.57 |
3.16 |
4.73 |
3.25 |
|
|
|
4
|
Gas phase |
1.60 |
1.82 |
3.42 |
1.94 |
| Water |
1.60 |
3.10 |
4.71 |
3.20 |
| DMSO |
1.60 |
3.09 |
4.69 |
3.19 |
| MeOH |
1.60 |
3.08 |
4.68 |
3.17 |
|
|
|
5
|
Gas phase |
1.66 |
1.80 |
3.46 |
1.94 |
| Water |
1.66 |
3.05 |
4.71 |
3.18 |
| DMSO |
1.66 |
3.03 |
4.69 |
3.16 |
| MeOH |
1.66 |
3.02 |
4.68 |
3.14 |
|
|
|
6
|
Gas phase |
1.65 |
1.76 |
3.42 |
1.91 |
| Water |
1.66 |
3.06 |
4.71 |
3.18 |
| DMSO |
1.66 |
3.04 |
4.70 |
3.16 |
| MeOH |
1.66 |
3.03 |
4.68 |
3.15 |
Conclusions
Understanding the structure and photochemistry of these natural photosensitizers are important for determining why plants and ciliates use these compounds as well as how they can be modified to improve their medical application as photodynamic therapy agents. Phenanthro[1,10,9,8-opqra]perylene-7,14-dione (1) and its natural product derivatives (2–7) have been explored by calculating the optimized structure and UV-Vis spectrum using DFT and TD-DFT. The propeller conformation is most stable for 2–4, and the saddle conformation is most stable for 5 and 6A. For 6, which is newly isolated and has not been fully characterized experimentally, DFT IR frequencies suggest that the orthoester 6A is the most probable structure. The TD-DFT calculations of the vertical transition wavelengths and intensities are consistent with experimental spectra and assigned as π → π* excitations within the phenanthro[1,10,9,8-opqra]perylene-7,14-dione core of 2–6. Peaks missing from the vertical TD-DFT spectra have been attributed to vibronic coupling to vibrational modes involving the peri –OH groups. The similarities in the bathochromic shift in λmax observed in 2–6 and the additional features in the spectra compared to 1 are attributed to the peri –OH substitutions as in 7 and, to a lesser extent, the molecular twist induced by the bay –Me and/or –OH groups. The molecular orbitals of 2–7 are traceable to the shared chromophore, even for 5 and 6A, which have the larger cycloheptatriene ring. Some excitations of 5 and 6A involve orbital character on the phenol substituent suggesting a potential intramolecular charge transfer process that may be modified by substitution. Photochemical generation of superoxide and singlet oxygen is thermodynamically favourable for each of the natural product derivatives.
Conflicts of interest
The authors declare no competing financial interest.
Acknowledgements
Calculations were performed using high performance clusters managed by ODU Information Technology Services. We thank Michael Plewka (http://www.plingfactory.de) for providing microscopic images of Stentor coeruleus and Stentor amethystinus and Gerald Helbig (http://www.lebendkulturen.de) for providing a microscopic image of Blepharisma japonicum. The authors thank an anonymous reviewer for valuable comments on simulation of the spectrum in Fig. 5.
Notes and references
- H. Falk, Angew. Chem., Int. Ed., 1999, 38, 3117–3136 CrossRef CAS.
- C. A. Mulrooey, E. M. O'Brien, B. J. Morgan and M. C. Kozlowski, Eur. J. Org. Chem., 2012, 3887–3904 CrossRef PubMed.
- N. Duráan and P.-S. Song, Photochem. Photobiol., 1986, 43, 677–680 CrossRef.
- C. S. Lobban, S. J. Hallam, P. Mukherjee and J. W. Petrich, Photochem. Photobiol., 2007, 83, 1074–1094 CrossRef CAS PubMed.
- N. Tao, M. Orlando, J. S. Hyon, M. Gross and P. S. Song, J. Am. Chem. Soc., 1993, 115, 2526–2528 CrossRef CAS.
- M. Maeda, H. Naoki, T. Matsuoka, Y. Kato, H. Kotsuki, K. Utsumi and T. Tanaka, Tetrahedron Lett., 1997, 38, 7411–7414 CrossRef CAS.
- H. Falk and E. Mayr, Monatsh. Chem., 1995, 126, 699–710 CrossRef CAS.
- H. Falk and E. Mayr, Monatsh. Chem., 1997, 128, 353–360 CrossRef CAS.
- G. A. Kraus, W. Zhang, S. Carpenter and Y. Wannemuehler, Bioorg. Med. Chem. Lett., 1995, 5, 2633–2636 CrossRef CAS.
- D. Meruelo, G. Lavie and D. Lavie, Proc. Natl. Acad. Sci. U. S. A., 1988, 85, 5230–5234 CrossRef CAS.
- G. Lavie, F. Valentine, B. Levin, Y. Mazur, G. Gallo, D. Lavie, D. Weiner and D. Meruelo, Proc. Natl. Acad. Sci. U. S. A., 1989, 86, 5963–5967 CrossRef CAS.
- N. Kashef, Y. S. Borghei and G. E. Djavid, Photodiagn. Photodyn. Ther., 2013, 10, 150–155 CrossRef CAS PubMed.
- N. J. Wills, J. Park, J. Wen, S. Kesavan, G. A. Kraus, J. W. Petrich and S. Carpenter, Photochem. Photobiol., 2001, 74, 216–220 CrossRef CAS PubMed.
- S. Sánchez-Cortés, P. Miskovsky, D. Jancura and A. Bertoluzza, J. Phys. Chem., 1996, 100, 1938–1944 CrossRef.
- P. Miskovsky, Curr. Drug Targets, 2002, 3, 55–84 CrossRef CAS PubMed.
- D. W. Cameron and A. G. Riches, Tetrahedron Lett., 1995, 36, 2331–2334 CrossRef CAS.
- G. Checcucci, R. S. Shoemaker, E. Bini, R. Cerny, N. Tao, J.-S. Hyon, D. Gioffre, F. Ghetti, F. Lenci and P.-S. Song, J. Am. Chem. Soc., 1997, 119, 5762–5763 CrossRef CAS.
- G. Höfle, S. Reinecke, U. Laude and D. Spitzner, J. Nat. Prod., 2014, 77, 1383–1389 CrossRef PubMed.
- G. Rodewald, R. Arnold, J. Griesler and W. Steglich, Angew. Chem., Int. Ed. Engl., 1977, 16, 46–47 CrossRef.
- H. Banks, D. Cameron and W. Raverty, Aust. J. Chem., 1976, 29, 1509–1521 CrossRef CAS.
- H. P. Bais, R. Vepachedu, C. B. Lawrence, F. R. Stermitz and J. M. Vivanco, J. Biol. Chem., 2003, 278, 32413–32422 CrossRef CAS PubMed.
- M. E. Alberto, C. Iuga, A. D. Quartarolo and N. Russo, J. Chem. Inf. Model., 2013, 53, 2334–2340 CrossRef CAS PubMed.
- M. E. Alberto, T. Marino, A. D. Quartarolo and N. Russo, Phys. Chem. Chem. Phys., 2013, 15, 16167–16171 RSC.
- M. E. Alberto, B. C. De Simone, G. Mazzone, A. D. Quartarolo and N. Russo, J. Chem. Theory Comput., 2014, 10, 4006–4013 CrossRef CAS.
- M. E. Alberto, G. Mazzone, A. D. Quartarolo, F. F. R. Sousa, E. Sicilia and N. Russo, J. Comput. Chem., 2014, 35, 2107–2113 CrossRef CAS PubMed.
-
Gaussian 09, Gaussian, Inc., Wallingford, CT, 2009 Search PubMed.
- Y. Zhao and D. G. Truhlar, J. Chem. Phys., 2006, 125, 194101 CrossRef PubMed.
- C. Adamo and V. Barone, J. Chem. Phys., 1998, 108, 664–675 CrossRef CAS.
- D. Jacquemin, E. A. Perpète, I. Ciofini and C. Adamo, Acc. Chem. Res., 2009, 42, 326–334 CrossRef CAS PubMed.
- A. D. Laurent and D. Jacquemin, Int. J. Quantum Chem., 2013, 113, 2019–2039 CrossRef CAS.
- A. D. Laurent, C. Adamo and D. Jacquemin, Phys. Chem. Chem. Phys., 2014, 16, 14334–14356 RSC.
- L. Goerigk, J. Moellmann and S. Grimme, Phys. Chem. Chem. Phys., 2009, 11, 4611–4620 RSC.
- D. Jacquemin, E. A. Perpète, I. Ciofini, C. Adamo, R. Valero, Y. Zhao and D. G. Truhlar, J. Chem. Theory Comput., 2010, 6, 2071–2085 CrossRef CAS.
- F. Santoro, R. Improta, A. Lami, J. Bloino and V. Barone, J. Chem. Phys., 2007, 126, 084509 CrossRef PubMed.
- F. Santoro, A. Lami, R. Improta and V. Barone, J. Chem. Phys., 2007, 126, 184102 CrossRef PubMed.
- F. Santoro, A. Lami, R. Improta, J. Bloino and V. Barone, J. Chem. Phys., 2008, 128, 224311 CrossRef PubMed.
- J. Tomasi, B. Mennucci and R. Cammi, Chem. Rev., 2005, 105, 2999–3094 CrossRef CAS PubMed.
- H. Falk and A. Vaisburg, Monatsh. Chem., 1995, 126, 361–364 CrossRef CAS.
- P. M. Donovan and L. T. Scott, Polycyclic Aromat. Compd., 2008, 28, 128–135 CrossRef CAS.
- C. Etzlstorfer, H. Falk, N. Muller and T. N. H. Tran, Monatsh. Chem., 1996, 127, 659–668 CrossRef CAS.
- R. Altmann, C. Etzlstorfer and H. Falk, Monatsh. Chem., 1997, 128, 785–793 CrossRef CAS.
- O. Pieroni, P. Plaza, M. Mahet, N. Angelini, G. Checcucci, M. Malatesta, M. M. Martin and F. Lenci, Photochem. Photobiol., 2005, 81, 1343–1346 CrossRef CAS PubMed.
- D. Freeman, F. Frolow, E. Kapinus, D. Lavie, G. Lavie, D. Meruelo and Y. Mazur, J. Chem. Soc., Chem. Commun., 1994, 891–892 RSC.
- C. Etzlstorfer, H. Falk, N. Muller, W. Schmitzberger and U. Wagner, Monatsh. Chem., 1993, 124, 751–761 CrossRef CAS.
- F. Gai, M. J. Fehr and J. W. Petrich, J. Phys. Chem., 1994, 98, 5784–5795 CrossRef CAS.
- A. Smirnov, D. B. Fulton, A. Andreotti and J. W. Petrich, J. Am. Chem. Soc., 1999, 121, 7979–7988 CrossRef CAS.
- R. C. Guedes and L. A. Eriksson, J. Photochem. Photobiol., A, 2005, 172, 293–299 CrossRef CAS.
- E. I. Kapinus, H. Falk and H. T. N. Tran, Monatsh. Chem., 1999, 130, 623–635 CAS.
- J. L. Wynn and T. M. Cotton, J. Phys. Chem., 1995, 99, 4317–4323 CrossRef CAS.
- T. Yamazaki, N. Ohta, I. Yamazaki and P. S. Song, J. Phys. Chem., 1993, 97, 7870–7875 CrossRef CAS.
- R. L. Martin, J. Chem. Phys., 2003, 118, 4775–4777 CrossRef CAS.
- D. Jacquemin, E. Brémond, A. Planchat, I. Ciofini and C. Adamo, J. Chem. Theory Comput., 2011, 7, 1882–1892 CrossRef CAS.
- H. Falk and E. Mayr, Monatsh. Chem., 1995, 126, 1311–1321 CrossRef CAS.
- T. G. Dax, C. Etzlstorfer and H. Falk, Monatsh. Chem., 2000, 131, 1115–1122 CrossRef CAS.
- Y. Uruma, K. Sakamoto, K. Takumi, M. Doe, Y. Usuki and H. Iio, Tetrahedron, 2007, 63, 5548–5553 CrossRef CAS.
- D. Spitzner, G. Höfle, I. Klein, S. Pohlan, D. Ammermann and L. Jaenicke, Tetrahedron Lett., 1998, 39, 4003–4006 CrossRef CAS.
Footnote |
| † Electronic supplementary information (ESI) available: Comparison of functionals and basis sets for 1, experimental UV-Vis bands to TD-DFT transitions (M06-L/TZVP) for 6B and 6C, and Cartesian coordinates of 1–7 are presented. See DOI: 10.1039/c5nj02448j |
|
| This journal is © The Royal Society of Chemistry and the Centre National de la Recherche Scientifique 2016 |
Click here to see how this site uses Cookies. View our privacy policy here. 

![[double bond, length as m-dash]](https://www.rsc.org/images/entities/char_e001.gif) O
O![[double bond, length as m-dash]](https://www.rsc.org/images/entities/char_e001.gif) O bond length and HOMO to 1, but its HOMO−1 and HOMO−2 are lone pair MOs of the carbonyls. These results suggest that hydrogen bonding in the peri region is necessary to destabilize the π system through further delocalization. A similar effect may occur when protonation of 1 and per-methylated 3 shifts their photophysical properties to be more similar to 3 itself.45 The molecular twist further shifts the HOMO–LUMO transition by 10–20 nm (Table 2) and leads to the additional excitation bands versus1 observed in the experimental spectra. In 3, the replacement of one set of bay –OH groups with –Me groups enhances the twist on one side of the molecule due to increased repulsion (Fig. 3). The i-Pr groups in 4 also decrease the symmetry, but to a lesser extent, leading to minor distortions in the π lobes relative to 2. HOMO−1, analogous to the HOMO of 1, is destabilized by the twisting of the PPD backbone which partially disrupts the donut-like lobe (Fig. 4). The enhanced twist and asymmetry of 3 and 4 further destabilize HOMO−1 to shift the transition of these electrons to longer wavelengths (Table 2).
O bond length and HOMO to 1, but its HOMO−1 and HOMO−2 are lone pair MOs of the carbonyls. These results suggest that hydrogen bonding in the peri region is necessary to destabilize the π system through further delocalization. A similar effect may occur when protonation of 1 and per-methylated 3 shifts their photophysical properties to be more similar to 3 itself.45 The molecular twist further shifts the HOMO–LUMO transition by 10–20 nm (Table 2) and leads to the additional excitation bands versus1 observed in the experimental spectra. In 3, the replacement of one set of bay –OH groups with –Me groups enhances the twist on one side of the molecule due to increased repulsion (Fig. 3). The i-Pr groups in 4 also decrease the symmetry, but to a lesser extent, leading to minor distortions in the π lobes relative to 2. HOMO−1, analogous to the HOMO of 1, is destabilized by the twisting of the PPD backbone which partially disrupts the donut-like lobe (Fig. 4). The enhanced twist and asymmetry of 3 and 4 further destabilize HOMO−1 to shift the transition of these electrons to longer wavelengths (Table 2).
![[double bond, length as m-dash]](https://www.rsc.org/images/entities/char_e001.gif) O stretching frequency was found at 1785 cm−1.
O stretching frequency was found at 1785 cm−1.


