Glutathione modified carbon-dots: from aggregation-induced emission enhancement properties to a “turn-on” sensing of temperature/Fe3+ ions in cells†
Chuanxi
Wang
,
Kaili
Jiang
,
Zhenzhu
Xu
,
Huihui
Lin
and
Chi
Zhang
*
China-Australia Joint Research Centre for Functional Molecular Materials, School of Chemical & Material Engineering, Jiangnan University, Wuxi 214122, P. R. China. E-mail: chizhang@jiangnan.edu.cn
First published on 13th January 2016
Abstract
In this paper, a novel “turn-on” chemosensor for detecting temperature and Fe3+ has been designed. This nanosensor is based on the aggregation-induced emission enhancement (AIEE) properties of fluorescent carbon dots (CDs). The CDs prepared by a facile hydrothermal route show blue emission (λem = 505 nm) with a quantum yield of 4.7%. The resultant CDs are modified by glutathione (GSH) on the surface through the carbodiimide-activated coupling reaction. The as-prepared GSH-CDs show good dispersion, high fluorescence and AIEE phenomenon. Resultant GSH-CDs would be aggregated by Fe3+ ions in aqueous solution which results in enhanced fluorescence. Therefore, such GSH-CDs would be excellent candidates as fluorescent probes for the label-free detection of Fe3+ ions with a limit of detection of 0.1 μM. Moreover, the PL intensity of GSH-CDs increases progressively with increasing temperature and they could be used in optical thermometry over a wide temperature range (25–80 °C) with small temperature resolution (∼0.5 °C). Using MC3T3-E1 cells as the model, the resultant nanosensor is demonstrated to monitor temperature and Fe3+ ions in cells. Thus, resultant GSH-CDs could be used as a “turn-on” sensor for highly sensitive and selective detection of temperature and Fe3+ ions in aqueous solution and biosystems.
1. Introduction
The design and synthesis of highly selective and sensitive chemosensors to detect temperature, pH, and metal ions in the ecological environment and biology have attracted a great deal of attention.1–4 It is well known that, the temperature and metal ions are fundamental thermodynamic variables which strongly affect biochemical and physiological actions and/or processes.5,6 For example, Fe3+ is one of the most abundant essential elements in the human body and plays an important role in living organisms and metabolism.7 Many enzymatic reactions involving iron are related to oxygen metabolism, electron transfer and the mitochondrial respiratory chain.8 On the other hand, cellular processes are exquisitely temperature-dependent because temperature governs the dynamics and reactivity of the vast number of biomolecules inside cells.9,10 Thus it is of increasing importance to develop chemosensors for the accurate measurement of temperature and Fe3+ in cells. To this end, fluorescence-based nanosensors have been used as a useful technique for detecting temperature and metal ions due to their high sensitivity and selectivity, simplicity, and real-time detection properties.11–13 Indeed, considerable efforts have been devoted to design fluorescent probes for the measurement of temperature/Fe3+ by using various fluorescent nanomaterials, such as quantum dots, carbon dots (CDs) and metal nanoclusters.14–17 However, most of these probes are fluorescence quenching-based optical sensors. Compared with them, fluorescent “turn-on” probes could reduce false-positive signals and the dark background.18,19 Therefore, it is highly desirable to establish a novel fluorescent “turn-on” probe to detect temperature and Fe3+.Recently, some sensors with fluorescence turn-on response to metal ions have been designed based on aggregation-induced emission enhancement (AIEE).20 The AIEE phenomenon was first reported by the Tang group in 2001.21 Unlike the most traditional fluorophores which suffer from a concentration caused quenching effect, AIEE fluorophores show non- or very weak emission in its dissolved state, but turn to show strong emission when the molecular aggregate is formed based on the restriction of the intramolecular motion mechanism.22,23 Based on the AIEE phenomenon and principle, the introduction of functional groups into AIEE molecules will favour a new development of chemo or biosensors for detecting metal cations, biomolecules, organic vapor, chiral molecules, and explosives.24–27 Up to now, AIEE luminogens focus on organic molecules including the distyrylbenzene, fluorene, pentacene, and pyrene derivatives.28–31 However, an AIEE probe based on fluorescent nanomaterials is rare.32
Fluorescent carbon-based materials, including CDs, nanodiamonds, carbon nanotubes, fullerenes and graphene quantum dots, as an important class of photoluminescent (PL) nanomaterials, have been the subject of extensive research over the past decade.33–36 Their inherent advantages including low cost, reduced toxicity, good biocompatibility, and excellent photoresponse make them promising candidates for numerous exciting applications, such as bioimaging, medical diagnosis, catalysis, and in photovoltaic devices.37–40 Among them, CDs have attracted more and more attention owing to their low toxicity, good stability, easy preparation, environmental friendliness and unique optical properties like those of semiconductor quantum dots.41,42 These superior properties of CDs distinguish them from traditional fluorescent materials, and make them attractive for a wide variety of biochemical applications, such as sensing, in vitro and in vivo imaging, and cancer therapy.43–45 Previously CDs have been demonstrated as nanosensors for detection of temperature and some metal ions.16,46 However, most reported CD-based sensors depend on the decrease in the fluorescence intensity. “Light-on” fluorescent sensors designed using CDs are still relatively rare.
Herein, a “turn-on” nanosensor for temperature and Fe3+ ions is designed using fluorescent CDs as a probe. The CDs are prepared by a facile hydrothermal route using citric acid as a carbon precursor and urea for surface passivation. Then the surface of resultant CDs is modified by glutathione (GSH) through the carbodiimide-activated coupling reaction.47 GSH, a naturally occurring and readily available tripeptide, has many functional groups (thiols, carboxyl and amino groups) which make fluorescent CDs exhibit good dispersion and AIEE phenomenon in aqueous solution.48 Moreover, based on the AIEE mechanism, the as-prepared GSH-CDs could be utilized as a “light-on” biosensor reagent for the detection of temperature and Fe3+ ions in aqueous solution and biosystems.
2. Experimental
2.1 Materials
Reduced glutathione (GSH, molecular weight of 307), citric acid (CA) and urea were purchased from Sinopharm Chemical Reagent Co., Ltd (Shanghai, China). 1-Ethyl-3-(3-dimethylaminopropyl)carboxylate (EDC) and N-hydroxysuccinimide (NHS) were purchased from Aldrich. N,N-Dimethylformamide (DMF) and ethanol were analytical grade. All reagents were used as received without further purification. De-ionized (DI) water was used in the experiments.2.2 Synthesis of Carbon Dots (CDs)
In a typical procedure for the preparation of amine-functionalized CDs, CA (0.19 g, 1 mmol) and urea (0.18 g, 3 mmol) were added into 4 mL DMF and stirred to form a transparent and homogeneous solution. The solution was then transferred into a 15 mL poly(tetrafluoroethylene) (teflon)-lined autoclave and heated at 180 °C for 8 h. After cooling to room temperature, the solution of CDs was treated with ethanol and then centrifuged at 9000 rpm for 10 min to obtain the precipitate. The resultant CDs were obtained by re-dispersing the precipitate into water and stored in the dark for further use.2.3 Preparation of GSH-conjugated CDs
The GSH could be functionalized on the surface of CDs by the carbodiimide-activated coupling between GSH and CDs using EDC/NHS. Typically the as-prepared CD solution (10 mL, 1 mg mL−1) was mixed with phosphate-buffered saline (PBS, 10 mL) buffer solution (pH = 7.4) containing 0.25 g of EDC and 0.15 g of NHS. The mixture was treated by sonication in the dark at room temperature for 15 min. Subsequently, 10 mL of aqueous solution containing 0.156 g of GSH was added to the activated CD solution, followed by magnetic stirring in the dark at room temperature for 4 h. Afterwards, the solution was filtered by using a 0.22 μm filter to remove the larger product, and dialyzed to remove the residual unreacted species using a dialysis membrane (MWCO 2000 Da) at room temperature for 24 h to obtain the final product.2.4 Addition of ethanol to the as-prepared GSH-CDs
Different volumetric fractions of ethanol (fe, vol%) in the range of 0–100% were added to the as-synthesized GSH-CD aqueous solution (1 mL), and the solution was diluted to 2 mL. After reacting for 5 min, the fluorescence spectra of the mixtures were examined at an excitation wavelength of 420 nm.2.5 Application as Fe3+ sensor
In order to explore the potential applications of the AIEE effect of the as-prepared GSH-CDs, we examined the PL behavior of the material with a series of environmentally relevant metal ions. Typically, 10 mL of the as-prepared GSH-CD solution was diluted into 40 mL ultrapure water. After that, the diluted solution (2.7 mL, 0.06 mg mL−1) was treated with various metal ions (0.3 mL, 100 μM), including Na+, K+, Ca2+, Co2+, Mg2+, Cu2+, Ni2+, Fe3+, Cr6+, Cr3+, Pb2+, Ba2+, Cd2+, Mn2+, and Zn+, and kept for 5 min. The final concentrations were 10 μM for all metal ions. Then the fluorescence intensity was investigated under the same conditions. To evaluate the sensitivity of the sensing system, different concentrations of Fe3+ in the range of 0–1000 μM were examined. Briefly, 0.3 mL of solutions of Fe3+ with concentrations of 0, 0.001, 0.01, 0.1, 1, 10, 100, and 1000 μM were added into the as-prepared GSH-CD aqueous solutions, respectively. The mixtures were kept for 5 min and then the fluorescence spectra were investigated.2.6 Imaging GSH-CD-stained MC3T3-E1 cells
The primary GSH-CD solution (0.3 mg mL−1) was dispersed onto MC3T3-E1 cells in serum-free DMEM and incubated for 8 h at 37 °C in the presence of 5% CO2. The cells in the culture medium were then washed two times with warm PBS to remove the excess CDs in advance. Then the cells were rinsed with either plain PBS or PBS containing the concentrations of Fe3+ in 10 μM. Fluorescence imaging was performed on a FV1000 confocal fluorescence microscope (Olympus) at room temperature and 40 °C. All the experiments were performed in triplicate to reduce noise.2.7 Characterization
UV-Vis absorption spectra were recorded by using a TU-1991 UV-Vis spectrophotometer. The excitation and photoluminescence (PL) spectra were recorded by using a Cary Eclipse spectrofluorimeter (Varian, America) and QM/TM 3360 (PTI, America). The morphology and mean diameter of the samples were recorded by using a transmission electron microscope (TEM, JEM-2100) at 200 kV. X-ray photoelectron spectroscopy (XPS) was performed using a VG ESCALAB MKII spectrometer with Mg Kα excitation (1253.6 eV). Binding energy calibration was based on C 1s at 284.6 eV. Fourier transform infrared spectra were recorded by using a Nicolet 6700 FTIR spectrophotometer at wavenumbers ranging from 500 to 4000 cm−1. The Raman spectrum was recorded using a Raman Microscope (Renishaw Trade Co., Ltd, England) with a 532 nm laser wavelength. The confocal microscopy images were observed under a confocal fluorescence microscope (FV1000, Olympus). Dynamic light scattering (DLS) measurements were done with the ALV/DLS/SLS-5022F DLS (Germany instrument) employing a 4 mW He–Ne laser (λ = 632.8 nm) equipped with a thermostated sample chamber. The concentrations (∼0.1 mg mL−1) of samples and a single scattering angle of 90° were required for all the measurements. The scattering intensity data were processed to gain the radius distribution and the hydrodynamic diameter of each sample by the ALV-5000/E Correlator software.3. Results and discussion
3.1 Synthesis and characterization of carbon dots
The preparation of carbon dots (CDs) could be achieved by a one-pot hydrothermal method as shown in Scheme 1. In this procedure, citric acid (CA) served as a carbon source which would be carbonized under high temperature to form CDs. The urea worked as a surface passivation agent and provided amino functional species for resultant CDs. Surface passivation could improve the fluorescence quantum yield (QY) and stability of CDs.41 Moreover, amino groups on the surface of CDs would be in favour of surface modification. Then, the glutathione (GSH) was conjugated with CDs through a carbodiimide-activated coupling reaction.49 As a naturally occurring and readily available tripeptide, GSH is a kind of small biomolecule with several functional groups, including carboxyl, thiol and amino groups which could work as an important scaffold to stabilize nanomaterials.50 Similar to previously reported nanoclusters,22 CDs protected with GSH showed an aggregation-induced emission enhancement (AIEE) phenomenon. Based on the AIEE mechanism, the as-prepared GSH-CDs could be utilized as a “light-on” biosensor for the detection of temperature and Fe3+ ions (Scheme 1).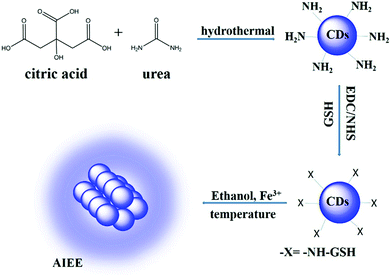 | ||
| Scheme 1 Preparation of CDs by hydrothermal treatment of CA in the presence of urea and sensing process based on the aggregation-induced emission enhancement effect. | ||
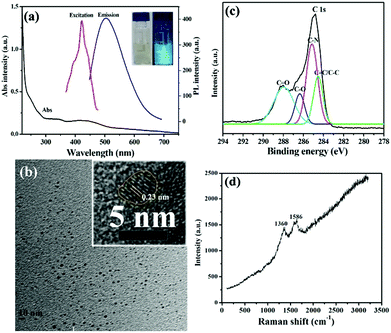
The optical properties of resultant CDs were investigated through the UV-Vis and fluorescence spectra. As shown in Fig. 1a CDs in aqueous solution displayed three absorption peaks centered at 251, 332 and 433 nm, respectively. The origin of these peaks was attributed to electron transition in heteroatom-containing CDs. The absorption peaks at 251 nm and 332 nm were assigned to the π–π* transition of aromatic sp2 domains and n–π* transition of C![[double bond, length as m-dash]](https://www.rsc.org/images/entities/char_e001.gif) O bands, respectively.51 Besides, the absorption peak at 433 nm corresponded to the n–π* transition of the conjugated C–N bands.52 In aqueous solution, the as-prepared CDs exhibited blue fluorescence with λmax at 505 nm and the full width at half maximum around 120 nm (Fig. 1a). Similar to previous CDs, these newly developed CDs showed a well-defined excitation band with λmax at 420 nm, which matched well with that of the UV-Vis absorption peak (Fig. 1a).16 Moreover, resultant CDs displayed a typical excitation-dependent PL behavior due to their surface state and size effect.16,41,42 As shown in Fig. S1,† the emission spectra of the as-synthesized CDs from 478 nm to 575 nm showed the change in the PL intensity as the excitation wavelength varied from 340 nm to 500 nm. CDs achieved the maximum emission intensity around 505 nm (a bright blue emission) when it was excited at 420 nm. This excitation-dependent PL phenomenon is common for the fluorescent CDs and useful in multicolor imaging applications.4,53 The diluted solution of the CDs in aqueous solution emitted blue fluorescence under a 365 nm UV light, while it appeared brown under visible light (inset of Fig. 1a). The QY of the as-prepared CDs in aqueous solution at room temperature is found to be 4.7% using quinine sulfate (0.1 M H2SO4 as solvent; QY = 0.54) as a reference.
O bands, respectively.51 Besides, the absorption peak at 433 nm corresponded to the n–π* transition of the conjugated C–N bands.52 In aqueous solution, the as-prepared CDs exhibited blue fluorescence with λmax at 505 nm and the full width at half maximum around 120 nm (Fig. 1a). Similar to previous CDs, these newly developed CDs showed a well-defined excitation band with λmax at 420 nm, which matched well with that of the UV-Vis absorption peak (Fig. 1a).16 Moreover, resultant CDs displayed a typical excitation-dependent PL behavior due to their surface state and size effect.16,41,42 As shown in Fig. S1,† the emission spectra of the as-synthesized CDs from 478 nm to 575 nm showed the change in the PL intensity as the excitation wavelength varied from 340 nm to 500 nm. CDs achieved the maximum emission intensity around 505 nm (a bright blue emission) when it was excited at 420 nm. This excitation-dependent PL phenomenon is common for the fluorescent CDs and useful in multicolor imaging applications.4,53 The diluted solution of the CDs in aqueous solution emitted blue fluorescence under a 365 nm UV light, while it appeared brown under visible light (inset of Fig. 1a). The QY of the as-prepared CDs in aqueous solution at room temperature is found to be 4.7% using quinine sulfate (0.1 M H2SO4 as solvent; QY = 0.54) as a reference.
The morphology and size of CDs could be clearly revealed by transmission electron microscopy (TEM) image (Fig. 1b), which showed good dispersion without apparent aggregation. The corresponding high resolution TEM (HRTEM) image of a single CD reveals a high crystallinity with a lattice fringe distance of 0.23 nm, corresponding to the graphitic structure of the as-obtained CDs (inset of Fig. 1b).54 As depicted in the histograms (Fig. S2†), the average size of the CDs was 2.5 ± 0.5 nm in diameter. The surface groups and structures of CDs were confirmed by X-ray photoelectron spectroscopy (XPS) (Fig. 1c). The full-scale XPS survey spectrum (Fig. S3†) presented the elemental compositions of C, N, and O in fluorescent CDs. The deconvoluted XPS spectrum of C 1s (Fig. 1c) revealed four different unit moieties: C![[double bond, length as m-dash]](https://www.rsc.org/images/entities/char_e001.gif) C/C–C bonds (284.5 eV), C–N (285.1 eV), C–O (286.4 eV) and C
C/C–C bonds (284.5 eV), C–N (285.1 eV), C–O (286.4 eV) and C![[double bond, length as m-dash]](https://www.rsc.org/images/entities/char_e001.gif) O (288.0 eV), respectively.16,41 These functional groups could improve the solubility and stability of CDs in the aqueous system. The Raman spectrum of CDs is shown in Fig. 1d. The D band at ∼1360 cm−1 represented the sp3-hybridized carbon, and the G band at ∼1586 cm−1 is associated with the E2g phonon of sp2 carbon atoms.55 The D band is associated with the vibrations of the carbon atoms with dangling bonds in the termination plane of the disordered graphite. The G band corresponds to the E2g mode of graphite and is related to the vibration of the sp2-hybridized carbon atoms in a two-dimensional hexagonal lattice. The relative intensity of the D band to G band (ID/IG) for the CDs was calculated as about 0.94, which suggested that they have a similar structure to graphite.56
O (288.0 eV), respectively.16,41 These functional groups could improve the solubility and stability of CDs in the aqueous system. The Raman spectrum of CDs is shown in Fig. 1d. The D band at ∼1360 cm−1 represented the sp3-hybridized carbon, and the G band at ∼1586 cm−1 is associated with the E2g phonon of sp2 carbon atoms.55 The D band is associated with the vibrations of the carbon atoms with dangling bonds in the termination plane of the disordered graphite. The G band corresponds to the E2g mode of graphite and is related to the vibration of the sp2-hybridized carbon atoms in a two-dimensional hexagonal lattice. The relative intensity of the D band to G band (ID/IG) for the CDs was calculated as about 0.94, which suggested that they have a similar structure to graphite.56
3.2 AIEE properties of the as-prepared GSH-CDs
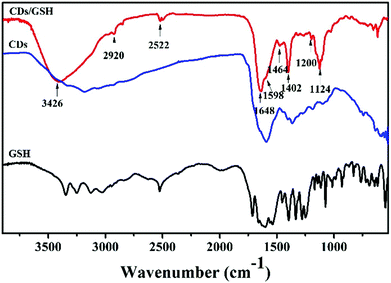
There are many amino groups on the surface of CDs which would be further modified by organic molecules easily. Herein, glutathione (GSH) was modified on the surface of CDs through the carbodiimide-activated coupling reaction.47,49 The Fourier transform infrared technique (FTIR) was used to investigate the surface functional compositions. As shown in Fig. 2, the FTIR spectrum of GSH-CDs illustrated the following characteristic peaks, such as stretching vibrations of O–H/N–H at 3426 cm−1, C–H at 2920 cm−1, C![[double bond, length as m-dash]](https://www.rsc.org/images/entities/char_e001.gif) C at 1598 cm−1, stretching vibrations of C
C at 1598 cm−1, stretching vibrations of C![[double bond, length as m-dash]](https://www.rsc.org/images/entities/char_e001.gif) O at 1648 cm−1, C–N stretching of the amide group at 1402 cm−1, C–N stretching of the amine at 1200 cm−1, and stretching vibrations of C–O–C at 1124 cm−1.16,57,58 As compared to the FTIR spectrum of CDs and GSH, the new peaks at 1402 and 1648 cm−1 that correspond to the CO–NH bond appeared, the new peak at 2522 cm−1 that corresponds to stretching vibrations of S–H appeared in the GSH-CDs, indicating that GSH had been successfully modified on the surface of CDs.22,58
O at 1648 cm−1, C–N stretching of the amide group at 1402 cm−1, C–N stretching of the amine at 1200 cm−1, and stretching vibrations of C–O–C at 1124 cm−1.16,57,58 As compared to the FTIR spectrum of CDs and GSH, the new peaks at 1402 and 1648 cm−1 that correspond to the CO–NH bond appeared, the new peak at 2522 cm−1 that corresponds to stretching vibrations of S–H appeared in the GSH-CDs, indicating that GSH had been successfully modified on the surface of CDs.22,58
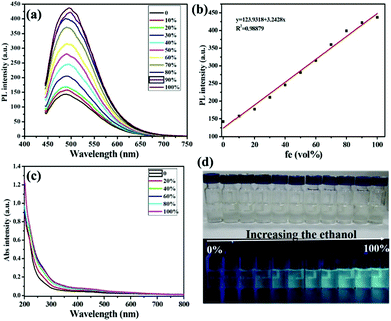
GSH is a kind of important scaffold for the fluorescent CDs, which makes CDs have lots of carboxyl and hydroxyl groups and therefore improves their solubility and stability.59 Moreover, these groups are very critical to the aggregation-induced emission enhancement (AIEE) properties since they might be hindered during their rotation in the solvents which is similar to fluorescent nanoclusters with GSH on the surface.22,24 Thus, the introduction of GSH to the CDs was expected to endow the GSH-CDs with the AIEE effect. After surface modification with GSH, GSH-CDs retained the blue fluorescence and their emission spectra were consistent with that of CDs in aqueous solution (Fig. S4†), with good dispersion and a small size (2.8 ± 0.3 nm) as shown in Fig. S5.† The as-synthesized GSH-CDs in aqueous solution emitted a faint blue fluorescence under 365 nm UV light. Upon addition of ethanol with different volumetric fractions (fe, vol%) ranging from 10–100 vol%, the GSH-CD solution became slightly brown from nearly colorless gradually (top of Fig. 3d), and the fluorescence under 365 nm irradiation was gradually intensified (bottom of Fig. 3d). The phenomenon indicated that the as-synthesized GSH-CDs exhibited an AIEE effect. To investigate the AIEE effect, we further examined the PL behavior of the GSH-CDs in ethanol/water mixtures with different volumetric fractions of ethanol (fe, vol%). As shown in Fig. 3a, the PL intensity at 500 nm increased continuously with increasing fe when they were excited at 420 nm. The changes in the PL intensity toward fe were highly linear with a correlation coefficient of 0.9888 (Fig. 3b). Under room temperature, the QY of GSH-CDs dissolved in aqueous solution was 4.7%. In contrast, when the GSH-CD aggregates generated upon addition of ethanol with increasing fe, the QY of GSH-CDs presented the trend of rising (Table S1†). The results of GSH-CDs’ QY agreed well with that of PL spectra.
For a better understanding of the PL mechanism, TEM and UV-Vis spectra were recorded. As illustrated in Fig. 3c, the mixtures exhibited the change in UV-Vis spectra with increasing fe. When fe was 100 vol%, the absorption peak at 433 nm presented an obvious enhancement compared to the pure GSH-CDs in aqueous solution, which indicated the GSH-CD aggregates generated. The TEM image of the GSH-CDs in the ethanol/water mixtures (fe, 50 vol%), as shown in Fig. S6,† displayed that the dispersion became poor and the aggregation appeared. Nevertheless, we confirmed that the GSH-CDs aggregated when they were mixed with ethanol. In the aggregates, the intramolecular motions were restricted, which blocked the nonradiative path and activated radiative decay. As a result, the fluorescence emission became stronger. The aqueous solution of the GSH-CDs could be stored in a refrigerator for several months (Fig. S7†). The high stability of the resultant GSH-CDs made them suitable for practical applications. Based on the properties of the AIEE and high stability, the as-prepared GSH-CDs could be utilized as a “light-on” biosensor reagent.
3.3 Optical responses of the GSH-CDs toward temperature
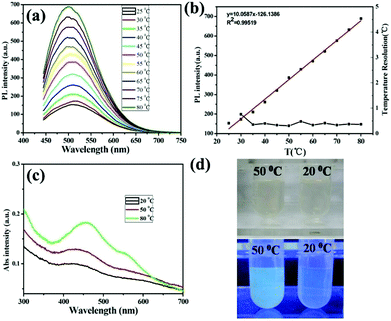
One of the important applications of fluorescent nanomaterials is building the versatile nanothermometry devices for spatially resolved temperature measurements in living cells.17 As we know, temperature is one of the most frequently measured parameters that govern biological reactions within living cells.60 The accurate measurement of temperature and its gradient inside a living cell can promote advancements in cell biology and biomedicine. In order to explore the potential applications of the resultant GSH-CDs in optical thermometry, their temperature-dependent fluorescence was investigated. The PL intensity increased progressively with heating, presenting an approximate 4.4 fold enhancement upon raising the temperature from 25 to 80 °C (Fig. 4a). In the process of heating, no dramatic shift of the emission wavelengths was observed. As shown in Fig. 4b, there is a good linear relationship between temperature and fluorescence intensity. This linear relationship can be fitted as a function of R(T) = 10.0587T − 126.1386 with correlation coefficient 0.995, where T and R(T) represent temperature and fluorescence intensity at 500 nm. Besides, the temperature resolution was calculated to be ∼0.5 °C (Fig. 4b, black line), indicating that the GSH-CDs could be used as an ideal temperature sensor with high precision and dependability, which was better than the resolution of previous fluorescent thermometers.10,61,62 We proposed that the GSH-CDs could work as a “turn-on” sensor for temperature due to the AIEE mechanism. This means the GSH-CD aggregates appeared upon increasing temperature which would cause the enhancement of PL. Then TEM and UV-Vis spectra were used to study the temperature-responsive PL behavior of GSH-CDs. As depicted in Fig. 4c, upon raising the temperature, the absorption of GSH-CDs at 433 nm presented an obvious enhancement compared to that under 20 °C. Meanwhile, in TEM images of GSH-CDs, the average diameter of GSH-CDs at 50 °C was 5.0 ± 0.5 nm (Fig. S8†), and the average diameter of GSH-CDs at 80 °C increased to 6.0 ± 0.5 nm (Fig. S8†), while the average diameter of GSH-CDs at room temperature was 2.5 ± 0.5 nm (Fig. 1b). Dynamic light scattering (DLS) also confirmed the size increase at 50 °C (Fig. S9†). Therefore, we concluded that, with increasing temperature, the GSH-CD aggregates generated which caused the evident fluorescence enhancement. Under room light (Fig. 4d, top), the color of the GSH-CD aqueous solution between 20 and 50 °C was clearly observed by the naked eye, thus the emission fluorescence under 365 nm UV light became a stronger blue fluorescence (Fig. 4d, bottom), indicating that GSH-CD aggregates appeared upon increasing temperature.The above temperature-dependent fluorescence of GSH-CDs was observed in the phosphate buffered saline (PBS) solution (pH = 7.4). Moreover, to explore the influence of pH, we explored their fluorescence responses to temperature under different pH values. As shown in Fig. S10,† the PL intensity increased gradually with increasing temperature under various pH values which suggested that the as-prepared “turn-on” temperature sensor could work in a wide pH range. Thus, it was noted that GSH-CDs as a “turn-on” temperature sensor could work in a wide temperature and pH range. Compared with previous nanothermometry, such novel temperature sensor based on the AIEE mechanism of CDs could measure temperature accurately.16
3.4 Detection of Fe3+
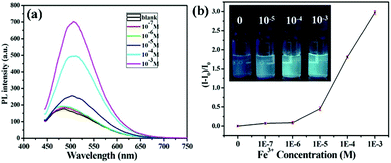
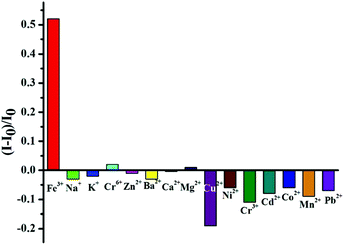
On the other hand, another important application of fluorescent nanomaterials is the detection of metal ions.63 Particularly, the GSH stabilized nanomaterials may have applications as sensors for metal cation detection due to their bright luminescence coupled to the presence of GSH on the surface.64 GSH, a naturally occurring and readily available tripeptide, has free carboxyl and amino groups, potentially providing binding sites for metal cations.65 The fluorescence enhancement of resultant GSH-CDs in the presence of Fe3+ ions was observed. Thus, we could construct the “turn-on” probe based on the AIEE mechanism of CDs for the detection of Fe3+ ions. Although iron is indispensable for the proper functioning of all living cells, it is disadvantageous when present in excess. Thus the quantitation of iron is of considerable interest. As shown in Fig. 5a, the PL intensity of GSH-CDs gradually increased with augmenting concentrations of Fe3+ since the Fe3+ could cause the aggregates of GSH-CDs which was confirmed by the UV-Vis absorption spectra, TEM image and DLS results. Upon adding the Fe3+, the absorption of GSH-CDs at 433 nm was observed (Fig. S11†). The GSH-CDs aggregated together (Fig. S12†) and the size is larger than 10 nm (Fig. S9†).Different from previously reported probes, the relationship between the fluorescence intensity of GSH-CDs and the concentration of Fe3+ ions didn't fit a linear equation.64,65 As shown in Fig. 5b, in the concentration range of 0.1–1 μM, the fluorescence intensity increased slowly, while once the concentration was beyond 1 μM, the fluorescence intensity rapidly increased. When the concentration of Fe3+ increased in the range of 10–1000 μM, an obvious fluorescence enhancement of GSH-CDs in aqueous solution under 365 nm irradiation was observed (inset of Fig. 5b). However, a linear relationship is observed between the intensity of the fluorescence of the GSH-CDs and the low concentration of the Fe3+ ion (Fig. S13†). The LOD was calculated using the below equation: LOD = 3SD/S, where “SD” is the standard deviation of the blank, “S” is the slope of the calibration curve (R(c) = 7.997 × 10⁸c + 8679.6, 0–0.5 μM). Herein the LOD is 0.1 μM which is lower than the maximum level of Fe3+ ions (0.3 mg L−1, 5.4 μM) allowed in drinking water by the US Environmental Protection Agency.66 Then, the selectivity of the GSH-CDs for Fe3+ ions was investigated. Besides Fe3+ ions, the PL intensities of other common metal ions were measured, and the concentrations of all the metal ions were 10 μM. As shown in Fig. 6, only Fe3+ ions caused the aggregates of GSH-CDs which showed the fluorescence enhancement; while the other metal ions had slight or negligible effects on the PL of GSH-CDs (seeing also the fluorescence spectra of Fig. S14†). Moreover, although the fluorescence of GSH-CDs would be enhanced with the concentration of Al3+ (10−5 M) (Fig. S15†), the fluorescence intensity is increased only 10% which is smaller than that of Fe3+ (>50%, Fig. 6) under the same concentration. The results clearly showed that slight emission intensity changes were observed in the presence of these interference metal ions, which demonstrated that the assay method was highly selective for Fe3+ detection. Besides, the fluorescence of GSH-CDs increased under pH = 4 and decreased under pH = 9 (Fig. S16a†), which was similar to previous GSH stabilized CDs and metal nanoclusters.16,65 However, under pH = 4 or 9, the selectivity for Fe3+ is effective (Fig. S16b and S16c†). Therefore, the fluorescence of GSH-CDs would be utilized as a “turn-on” sensor for highly sensitive and selective detection of Fe3+ ions in a wide pH range.
3.5 Application of “turn-on” probe in cells
The CDs after surface modification with GSH show good dispersion, high fluorescence and AIEE phenomenon which could be used to design a “light-on” sensor for temperature and Fe3+ ions. It is well known that the probes with highly sensitive and selective detection in biological fields are crucial. Thus, to evaluate whether the GSH-CD-based fluorescent “light-on” probe is applicable to biological fields, MC3T3-E1 cells are used as the model to explore the possibility of using GSH-CDs for the detection of temperature and Fe3+ in cells. An MTT assay was carried out to assess the inherent cytotoxicity of the GSH-CDs to MC3T3-E1 cells. The cell viabilities of MC3T3-E1 cells were determined after incubation with different concentrations of GSH-CDs (Fig. S17†). The result showed the cell viabilities remained at greater than 80% even at high concentrations of 40 mg mL−1 which indicated that the produced GSH-CDs possessed low cytotoxicity, good biocompatibility, and could be suitable as probes for cell imaging.Thus, the in vitro cellular uptake of GSH-CDs in MC3T3-E1 cells was examined at different temperatures and concentrations of Fe3+ ions by confocal laser scanning microscopy. As depicted in Fig. 7, after incubating for 8 h under various conditions, the MC3T3-E1 cells still maintained their normal morphology, thus indicating the good biocompatibility of the as-prepared GSH-CDs in this specific dose and time point. The blue fluorescence was observed both in cytoplasm and cellular nucleus. Moreover, the MC3T3-E1 cells at 40 °C exhibited much stronger fluorescence compared to that at 25 °C (Fig. 7a and b). Similarly, the fluorescence in MC3T3-E1 cells without Fe3+ ions was weak (Fig. 7c); however, a stronger fluorescence was observed with Fe3+ ions (Fig. 7d). These results confirmed that the GSH-CDs could be used as a promising optical image probe in bio-imaging.
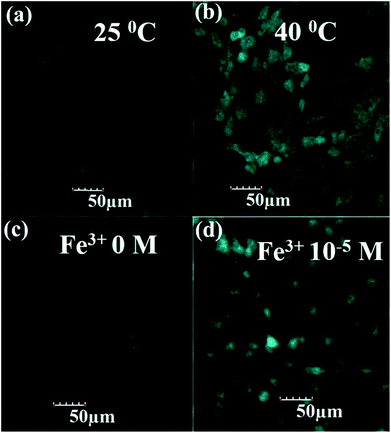 | ||
| Fig. 7 Confocal fluorescence images of MC3T3-E1 cells upon 8 h incubation with GSH-CDs under various conditions: (a) 25 °C; (b) 40 °C; (c) Fe3+ 0 M and (d) Fe3+ 10−5 M. | ||
4. Conclusions
A novel CD-based fluorescent “light-on” probe is prepared which displayed highly sensitive and selective detection of temperature and Fe3+ ions in solution and biosystems. The blue fluorescent CDs are synthesized through a facile hydrothermal method. Then, GSH, a naturally occurring and readily available tripeptide, is modified on the surface of CDs. The as-prepared GSH-CDs show good dispersion, high fluorescence and AIEE phenomenon. Based on the AIEE mechanism, resultant GSH-CDs could be used as a “turn-on” sensor for measuring temperature accurately in a wide temperature range (25–80 °C) with high temperature resolution (∼0.5 °C). Besides, as a “turn-on” sensor, the fluorescence GSH-CDs would be utilized for highly sensitive and selective detection of Fe3+ ions. In particular, on the basis of the AIEE phenomenon induced by temperature and Fe3+ ions, the utilization of GSH-CDs for monitoring temperature and Fe3+ ions in cells has been successfully demonstrated. Thus, these fluorescent GSH-CDs hold great promise as an alternative to conventional fluorescent probes for biolabeling, sensing and other applications.Acknowledgements
This work was supported by the National Natural Science Foundation of China (no. 51503085 and 51432006), the Ministry of Science and Technology of China for the International Science Linkages Program (no. 2011DFG52970), the Natural Science Foundation of Jiangsu Province, China (no. BK20140157), the Changjiang Innovation Research Team (IRT14R23), the Programme of Introducing Talents of Discipline to Universities (111 Project B13025), and the Fundamental Research Funds for the Central Universities (JUSRP11418).Notes and references
- Y. M. Yang, Q. Zhao, W. Feng and F. Y. Li, Chem. Rev., 2013, 113, 192 CrossRef CAS PubMed.
- W. J. Guan, W. J. Zhou, J. Lu and C. Lu, Chem. Soc. Rev., 2015, 44, 6981 RSC.
- B. Hotzer, I. L. Medintz and N. Hildebrandt, Small, 2012, 8, 2297 CrossRef PubMed.
- H. Nie, M. J. Li, Q. S. Li, S. J. Liang, Y. Y. Tan, L. Sheng, W. Shi and S. X. A. Zhang, Chem. Mater., 2014, 26, 3104 CrossRef CAS.
- L. Shang, S. J. Dong and U. Nienhaus, Nano Today, 2011, 6, 401 CrossRef CAS.
- G. Kucsko, P. C. Maurer, N. Y. Yao, M. Kubo, H. J. Noh, P. K. Lo, H. Park and M. D. Lukin, Nature, 2013, 500, 54 CrossRef CAS PubMed.
- D. En, Y. Guo, B. T. Chen, B. Dong and M. J. Peng, RSC Adv., 2014, 4, 248 RSC.
- S. K. Sahoo, D. Sharma, R. K. Bera, G. Crisponi and J. F. Callan, Chem. Soc. Rev., 2012, 41, 7195 RSC.
- K. Okabe, N. Inada, C. Gota, Y. Harada, T. Funatsu and S. Uchiyama, Nat. Commun., 2012, 3, 705 CrossRef PubMed.
- F. Vetrone, R. Naccache, A. Zamarron, A. J. Fuente, F. S. Rodriguez, L. M. Maestro, E. M. Rodriguez, D. Jaque, J. G. Sole and J. A. Capobianco, ACS Nano, 2010, 4, 3254 CrossRef CAS PubMed.
- Y. Z. Lu and W. Chen, Chem. Soc. Rev., 2012, 41, 3594 RSC.
- Q. Ma and X. G. Su, Analyst, 2011, 136, 4883 RSC.
- J. S. Han, X. Zhang, Y. B. Zhou, Y. Ning, J. Wu, S. Liang, H. C. Sun, H. Zhang and B. Yang, J. Mater. Chem., 2012, 22, 2679 RSC.
- J. S. Han, Z. W. Zhou, X. Y. Bu, S. J. Zhu, H. Zhang, H. Z. Sun and B. Yang, Analyst, 2013, 138, 3402 RSC.
- J. A. Ho, H. C. Chang and W. T. Su, Anal. Chem., 2012, 84, 3246 CrossRef PubMed.
- C. X. Wang, Z. Z. Xu, H. Cheng, H. H. Lin, M. G. Humphrey and C. Zhang, Carbon, 2015, 82, 87 CrossRef CAS.
- L. Shang, F. Stockmar, N. Azadfar and G. U. Nienhaus, Angew. Chem., Int. Ed., 2013, 52, 11154 CrossRef CAS PubMed.
- Y. Q. Dong, R. X. Wang, W. R. Tian, Y. W. Chi and G. N. Chen, RSC Adv., 2014, 4, 3701 CAS.
- L. Z. Hu, L. Deng, S. Alsaiari, D. Y. Zhang and N. M. Khashab, Anal. Chem., 2014, 86, 4989 CrossRef CAS PubMed.
- T. Y. Han, X. Feng, B. Tong, J. B. Shi, L. Chen, J. G. Zhi and Y. P. Dong, Chem. Commun., 2012, 48, 416 RSC.
- J. D. Luo, Z. L. Xie, J. W. Y. Lam, L. Cheng, H. Y. Chen, C. F. Qiu, H. S. Kwok, X. W. Zhan, Y. Q. Liu, D. B. Zhu and B. Z. Tang, Chem. Commun., 2001, 1740 RSC.
- X. F. Jia, J. Li and E. K. Wang, Small, 2013, 9, 3873 CrossRef CAS PubMed.
- S. Park, J. Seo, S. H. Kim and S. Y. Park, Adv. Funct. Mater., 2008, 18, 726 CrossRef CAS.
- X. F. Jia, X. Yang, J. Li, D. Y. Li and E. K. Wang, Chem. Commun., 2014, 50, 237 RSC.
- X. D. Yang, Y. N. Jiang, B. W. Shen, Y. Chen, F. X. Dong, K. Yu, B. Yang and Q. Lin, Polym. Chem., 2013, 4, 5591 RSC.
- Q. Gong, R. Zhang, J. Yang, Z. Huang, N. Li, N. Zhao and B. Z. Tang, J. Mater. Chem. C, 2015, 3, 8397 RSC.
- X. D. Yang, B. W. Shen, Y. N. Jiang, Z. X. Zhao, C. X. Wang, C. Ma, B. Yang and Q. Lin, J. Mater. Chem. A, 2013, 1, 1201 CAS.
- Z. Q. Xie, B. Yang, G. Cheng, L. L. Liu, F. He, F. Z. Shen, Y. G. Ma and S. Y. Liu, Chem. Mater., 2005, 17, 1287 CrossRef CAS.
- M. Shellaiah, Y.-H. Wu, A. Singh, M. V. R. Raju and H.-C. Lin, J. Mater. Chem. A, 2013, 1, 1310 CAS.
- S. Kaur, A. Gupta, V. Bhalla and M. Kumar, J. Mater. Chem. C, 2014, 2, 7356 RSC.
- Y. Liu, X. Tao, F. Z. Wang, X. G. Dang, D. C. Zou, Y. Ren and M. H. Jiang, J. Phys. Chem. C, 2008, 112, 3975 CAS.
- X. Y. Dou, X. Yuan, Y. Yu, Z. T. Luo, Q. F. Yao, D. T. Leong and J. P. Xie, Nanoscale, 2014, 6, 157 RSC.
- G. S. Hong, S. Diao, A. L. Antaris and H. J. Dai, Chem. Rev., 2015, 115, 10816 CrossRef CAS PubMed.
- S. N. Qu, X. Y. Wang, Q. P. Lu, X. Y. Liu and L. J. Wang, Angew. Chem., Int. Ed., 2012, 51, 12215 CrossRef CAS PubMed.
- S. J. Zhu, J. H. Zhang, C. Y. Qiao, S. J. Tang, Y. F. Li, W. J. Yuan, B. Li, L. Tian, F. Liu, R. Hu, H. N. Gao, H. T. Wei, H. Zhang, H. C. Sun and B. Yang, Chem. Commun., 2011, 47, 6858 RSC.
- C. X. Wang, Z. Z. Xu and C. Zhang, ChemNanoMat, 2015, 1, 122 CrossRef CAS.
- C. Q. Ding, A. W. Zhu and Y. Tian, Acc. Chem. Res., 2014, 47, 20 CrossRef CAS PubMed.
- S. Y. Lim, W. Shen and Z. Q. Gao, Chem. Soc. Rev., 2015, 44, 362 RSC.
- C. X. Wang, Z. Z. Xu, H. H. Lin, Y. J. Huang and C. Zhang, Part. Part. Syst. Charact., 2015, 32, 944 CrossRef CAS.
- J. C. Bian, C. Huang, L. Y. Wang, T. Hung, W. A. Daoud and R. Q. Zhang, ACS Appl. Mater. Interfaces, 2014, 6, 4483 Search PubMed.
- S. J. Zhu, Q. N. Meng, L. Wang, J. H. Zhang, Y. B. Song, H. Jin, K. Zhang, H. C. Sun, H. Y. Wang and B. Yang, Angew. Chem., Int. Ed., 2013, 52, 3953 CrossRef CAS PubMed.
- S. N. Qu, X. Y. Liu, X. Y. Guo, M. H. Chu, L. G. Zhang and D. Z. Shen, Adv. Funct. Mater., 2014, 24, 2689 CrossRef CAS.
- S. N. Qu, H. Chen, X. M. Zheng, J. S. Cao and X. Y. Liu, Nanoscale, 2013, 5, 5514 RSC.
- X. D. Yang, X. Yang, Z. Y. Li, S. Y. Li, Y. X. Han, Y. Chen, X. Y. Bu, C. Y. Su, H. Xu, Y. N. Jiang and Q. Lin, J. Colloid Interface Sci., 2015, 456, 1 CrossRef CAS PubMed.
- Y. Choi, S. Kim, M. H. Choi, S. R. Ryoo, J. Park, D. H. Min and B. S. Kim, Adv. Funct. Mater., 2014, 24, 5781 CrossRef CAS.
- A. W. Zhu, Q. Qu, X. L. Shao, B. Kong and Y. Tian, Angew. Chem., Int. Ed., 2012, 51, 7185 CrossRef CAS PubMed.
- C. X. Wang, Y. J. Huang, H. H. Lin, Z. Z. Xu, J. P. Wu, M. G. Humphrey and C. Zhang, RSC Adv., 2015, 5, 61586 RSC.
- C. X. Wang, Y. Wang, L. Xu, X. D. Shi, X. W. Li, H. C. Sun, B. Yang and Q. Lin, Small, 2013, 9, 413 CrossRef CAS PubMed.
- H. Cheng, C. X. Wang, Z. Z. Xu, H. H. Lin and C. Zhang, RSC Adv., 2015, 5, 20 RSC.
- C. X. Wang, Y. Wang, L. Xu, D. Zhang, M. X. Liu, X. W. Li, H. C. Sun, Q. Lin and B. Yang, Small, 2012, 8, 3137 CrossRef CAS PubMed.
- C. Shen, Y. Sun, J. Wang and Y. Lu, Nanoscale, 2014, 6, 9139 RSC.
- D. Qu, Z. C. Sun, M. Zheng, J. Li, Y. Q. Zhang, G. Q. Zhang, H. F. Zhao, X. Y. Liu and Z. G. Xie, Adv. Opt. Mater., 2015, 3, 360 CrossRef CAS.
- M. Zheng, S. Liu, J. Li, D. Qu, H. F. Zhao, X. G. Guan, X. L. Hu, Z. G. Xie, X. B. Jing and Z. C. Sun, Adv. Mater., 2014, 26, 3554 CrossRef CAS PubMed.
- Y. Wang, S. Kalytchuk, L. Wang, O. Zhovtiuk, K. Cepe, R. Zboril and A. L. Rogach, Chem. Commun., 2015, 51, 2950 RSC.
- V. Kumar, V. Singh, S. Umrao, V. Parashar, S. Abraham, A. K. Singh, G. Nath, P. S. Saxena and A. Srivastava, RSC Adv., 2014, 4, 21101 RSC.
- M. Xu, W. Zhang, F. Yu, Y. Ma, N. Hu, Y. Su, Q. Liang, D. He, Z. Yang and Y. Zhang, Nanoscale, 2015, 7, 10527 RSC.
- X. H. Zhu, X. Xiao, X. X. Zuo, Y. Liang and J. M. Nan, Part. Part. Syst. Charact., 2014, 31, 801 CrossRef CAS.
- W. Kwon, G. Lee, S. Do, T. Joo and S. W. Rhee, Small, 2014, 10, 506 CrossRef CAS PubMed.
- C. X. Wang, L. Xu, X. W. Xu, H. Cheng, H. C. Sun, Q. Lin and C. Zhang, J. Colloid Interface Sci., 2014, 416, 274 CrossRef CAS PubMed.
- D. Zhou, M. Lin, X. Liu, J. Li, Z. L. Chen, D. Yao, H. Z. Sun, H. Zhang and B. Yang, ACS Nano, 2013, 7, 2273 CrossRef CAS PubMed.
- J. M. Yang, H. Yang and L. Lin, ACS Nano, 2011, 5, 5067 CrossRef CAS PubMed.
- F. Ye, C. F. Wu, Y. H. Jin, Y.-H. Chan, X. J. Zhang and D. T. Chiu, J. Am. Chem. Soc., 2011, 133, 8146 CrossRef CAS PubMed.
- C. X. Wang, H. Cheng, Y. Q. Sun, Z. Z. Xu, H. H. Lin, Q. Lin and C. Zhang, Microchim. Acta, 2015, 182, 695 CrossRef CAS.
- C. X. Wang, L. Xu, Y. Wang, D. Zhang, X. D. Shi, F. X. Dong, K. Yu, Q. Lin and B. Yang, Chem. – Asian J., 2012, 7, 1652 CrossRef CAS PubMed.
- C. X. Wang, H. Cheng, Y. J. Huang, Z. Z. Xu, H. H. Lin and C. Zhang, Analyst, 2015, 140, 5634 RSC.
- X. Y. Mu, L. Qi, J. Qiao and H. M. Ma, Anal. Methods, 2014, 6, 6445 RSC.
Footnote |
| † Electronic supplementary information (ESI) available. See DOI: 10.1039/c5qi00273g |
| This journal is © the Partner Organisations 2016 |

