Spherical, particulate poly(ether ketone ketone) by a Friedel Crafts dispersion polymerisation†
Kaylie J. Smithab,
Ian D. H. Towlea and
Mark G. Moloney*b
aKetonex Ltd, Leafield Technical Centre, Langley, Witney, Oxfordshire, OX29 9EF, USA
bDepartment of Chemistry, Chemistry Research Laboratory, The University of Oxford, 12 Mansfield Road, Oxford, OX1 3TA, USA. E-mail: mark.moloney@chem.ox.ac.uk
First published on 27th January 2016
Abstract
A range of particulate poly(ether ketone ketone)s (PEKKs) have been synthesised by a room temperature Friedel–Crafts dispersion polymerisation. Their properties, including glass transition, melting and crystallisation temperatures, the degree of crystallinity and particle size, were readily controlled by altering the ratio of 1,3- to 1,4-units in the polymer backbone. The bulk polymer properties are comparable to materials produced by alternative methods and the polymers are highly melt stable. Unusually, all PEKKs are highly crystalline as produced, although some become amorphous on further processing. Evidence was obtained which is consistent with the particulate product being formed by a seeding mechanism, from aluminium(III) seeding particles which are formed in situ.
Introduction
The development of polyaryletherketones (PAEKs) during the 1970s and 1980s provided access to novel, thermally stable aromatic thermoplastic polymers that exhibit exceptional properties including thermal and chemical resistance and mechanical strength, and which are suitable for advanced applications such as medical devices, aerospace engineering and industrial manufacturing.1 PAEKs are commonly formed from a combination of aromatic phenylene-ketone (“K”) subunits and phenylene-ether sub-units (“E”). A key advantage is their combination of high glass transition temperatures (Tg) with comparatively low melting temperatures (Tm), resulting in materials with high application temperatures but which may also be easily processed. Altering the order and ratio of ether (E) to ketone (K) groups can be used to control Tg and Tm, since it has been found that the incorporation of ketones gives a more rigid polymer backbone and increased crystallinity, and some common examples are given in Table 1.1–3 PAEKs have been usually produced by solution polymerisation processes in order to avoid the problems of heat generation during bulk polymerisations.4 Once it became apparent that PAEKs were of significant commercial value, synthetic processes were developed by Dupont,5,6 ICI,7,8 Raychem,9–12 and Victrex.13PAEKs can be produced via both nucleophilic and electrophilic routes. The ether-forming nucleophilic route requires dihydroxy-monomers which are converted to the bis-phenolate by an alkali metal carbonate prior to reaction with a di-fluorinated monomer.15,16 Example monomers include hydroquinone and 4,4′-difluorobenzophenone, with reaction being conducted at 320 °C. The alternative ketone-forming electrophilic route is a low temperature Friedel–Crafts polymerisation between diacyl chlorides and arenes using AlCl3 as catalyst, using diphenyl ether as the arene monomer (Scheme 1). Recently, Zolotukhin has done much work to develop the synthesis and application of these polymers.17–24
In 1987, Raychem disclosed a modified Friedel–Crafts gel polymerisation process25 to produce a range of PAEKs as flake, and it was later found that by modification of one component of the system, some product types could be produced in the form of a fine powder,9 via a dispersion process. In 2011, Ketonex developed this work further26–29 and filed an extension patent30 based on the use of this dispersion process to produce PEKK. Whereas the original gel polymerisation process was known to be reliable, robust and able to produce a wide range of PAEK materials,25,31–34 the dispersion process was limited to PEKK alone. It was not known to what extent this dispersion process could be adapted to suit the production of other PAEK based materials, nor which process parameters were most critical for formation of the product. However, since the dispersion polymerisation process using benzoic acid as the dispersant obviates many of the difficulties of the earlier polymerisation processes, which often required the use of corrosive Lewis acids, high pressure and/or careful temperature control, along with simplified downstream materials processing, it was considered to be worthy of further development. In an initial study, process parameters for the dispersion production of PEKK, chosen as a model due to its synthetic reliability, were investigated and the results are reported here.
Results and discussion
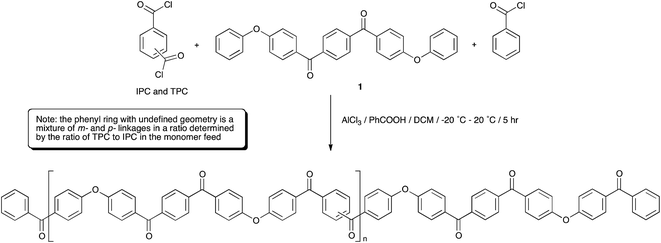
PEKK has been typically produced via a modified Friedel–Crafts dispersion polymerisation9,30 in dichloromethane using 1,4-bis(4-phenoxybenzoyl)benzene (EKKE, 1), and terephthalic and isoterephthalic acid chloride monomers (TPC and IPC, respectively) with an end-capper of benzoyl chloride (Scheme 2). The Lewis acid catalyst (AlCl3) is added to the reaction mixture in a 1.2 equivalent stoichiometric quantity equal to the total of all the constituent carbonyl groups in the reaction, i.e. totalled from the EKKE, TPC, IPC and benzoic acid components, along with a 20% excess. The Lewis base dispersant (benzoic acid) was added in 2 molar equivalents relative to the total acid chloride content. Reactant addition was carried out with careful control at an initial temperature of −15 to −20 °C, and the reaction mixture was then heated to room temperature (in practice 20 °C) and the temperature maintained at that level for the duration of the reaction time of 4–5 hours. The AlCl3 was decomplexed from the polymeric product, usually with iced water, before a workup process, ordinarily involving multiple water and aqueous acid washes at approximately 80–90 °C, was carried out to remove the benzoic acid and aluminium salts. A series of PEKK copolymers was synthesised by the polymerisation of EKKE (1) with either terephthaloyl chloride (TPC) alone, or in carefully defined stoichiometrically-controlled mixtures with isophthaloyl chloride (IPC), and end-capped with benzoyl chloride, according to Scheme 2. PEKKs were synthesised with TPC![[thin space (1/6-em)]](https://www.rsc.org/images/entities/char_2009.gif) :
:![[thin space (1/6-em)]](https://www.rsc.org/images/entities/char_2009.gif) IPC ratios of 100
IPC ratios of 100![[thin space (1/6-em)]](https://www.rsc.org/images/entities/char_2009.gif) :
:![[thin space (1/6-em)]](https://www.rsc.org/images/entities/char_2009.gif) 0, 90
0, 90![[thin space (1/6-em)]](https://www.rsc.org/images/entities/char_2009.gif) :
:![[thin space (1/6-em)]](https://www.rsc.org/images/entities/char_2009.gif) 10, 80
10, 80![[thin space (1/6-em)]](https://www.rsc.org/images/entities/char_2009.gif) :
:![[thin space (1/6-em)]](https://www.rsc.org/images/entities/char_2009.gif) 20, 70
20, 70![[thin space (1/6-em)]](https://www.rsc.org/images/entities/char_2009.gif) :
:![[thin space (1/6-em)]](https://www.rsc.org/images/entities/char_2009.gif) 30 and 60
30 and 60![[thin space (1/6-em)]](https://www.rsc.org/images/entities/char_2009.gif) :
:![[thin space (1/6-em)]](https://www.rsc.org/images/entities/char_2009.gif) 40 in the monomer feed, and the resulting polymers were characterised using a range of techniques, discussed in detail below.
40 in the monomer feed, and the resulting polymers were characterised using a range of techniques, discussed in detail below.
Polymer structures were initially confirmed using 1H and 13C NMR spectroscopy in CDCl3/TFA solvent; the addition of TFA is required for the improvement of polymer solubility, which is thought to arise by protonation of the carbonyl groups in the polymer backbone by TFA, introducing short range steric and electrostatic interactions, expanding the polymer chain and rendering it soluble.35 In order to determine accurate stoichiometric information, fully relaxed 13C NMR spectra were required with a pulse delay of 20 seconds, along with a large number of scans, in order to achieve good signal![[thin space (1/6-em)]](https://www.rsc.org/images/entities/char_2009.gif) :
:![[thin space (1/6-em)]](https://www.rsc.org/images/entities/char_2009.gif) noise ratio.36 The 13C and 1H NMR spectra for each of the PEKKs were assigned as indicated on the annotated structure (Fig. 1, ESI†), with chemical shift values listed in Table 1 (ESI†). Under these conditions, the chain ends are in too low concentrations to be detected and analysed successfully, but may be resolved by increasing the number of scans. Quartets centred at 164 ppm and 116 ppm are due to the TFA required for solubilisation. The overlaid 1H NMR spectra show peaks associated with the IPC links, most notably at 8.12, 8.23 and 7.77 ppm, which grow fully into the spectrum for the 60
noise ratio.36 The 13C and 1H NMR spectra for each of the PEKKs were assigned as indicated on the annotated structure (Fig. 1, ESI†), with chemical shift values listed in Table 1 (ESI†). Under these conditions, the chain ends are in too low concentrations to be detected and analysed successfully, but may be resolved by increasing the number of scans. Quartets centred at 164 ppm and 116 ppm are due to the TFA required for solubilisation. The overlaid 1H NMR spectra show peaks associated with the IPC links, most notably at 8.12, 8.23 and 7.77 ppm, which grow fully into the spectrum for the 60![[thin space (1/6-em)]](https://www.rsc.org/images/entities/char_2009.gif) :
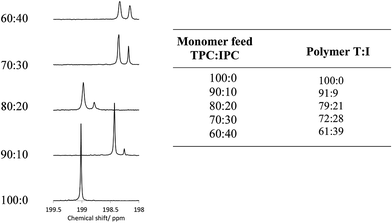
:![[thin space (1/6-em)]](https://www.rsc.org/images/entities/char_2009.gif) 40 PEKK. The most distinct signals observed in the 13C NMR spectra are those which originate from the carbonyl groups, observed at a distance from the other carbon signals at 198–199 ppm, corresponding to the terephthaloyl (T) and isophthaloyl (I) units. Increasing the IPC quantity in the monomer feed increased the intensity of the peaks associated with the I in the 13C fully relaxed spectra (Fig. 1 and 1, ESI†). It should be noted that, rather than using simple integration of the two peaks, a deconvolution simulated a Lorentzian peak which instead fitted first to peak-width-at-half-height, and then to the area, in order to determine ratios. This method allowed more accurate determination of area, and therefore a more reliable stoichiometric ratio, to within 2% accuracy of the monomer feed. This is extremely important as the T
40 PEKK. The most distinct signals observed in the 13C NMR spectra are those which originate from the carbonyl groups, observed at a distance from the other carbon signals at 198–199 ppm, corresponding to the terephthaloyl (T) and isophthaloyl (I) units. Increasing the IPC quantity in the monomer feed increased the intensity of the peaks associated with the I in the 13C fully relaxed spectra (Fig. 1 and 1, ESI†). It should be noted that, rather than using simple integration of the two peaks, a deconvolution simulated a Lorentzian peak which instead fitted first to peak-width-at-half-height, and then to the area, in order to determine ratios. This method allowed more accurate determination of area, and therefore a more reliable stoichiometric ratio, to within 2% accuracy of the monomer feed. This is extremely important as the T![[thin space (1/6-em)]](https://www.rsc.org/images/entities/char_2009.gif) :
:![[thin space (1/6-em)]](https://www.rsc.org/images/entities/char_2009.gif) I ratio controls many physical properties (vide infra). A similar structural analysis has been reported by Zolotukhin.21
I ratio controls many physical properties (vide infra). A similar structural analysis has been reported by Zolotukhin.21
Thermal properties
The PEKK polymers were subjected to DSC analysis to determine the effect of the T![[thin space (1/6-em)]](https://www.rsc.org/images/entities/char_2009.gif) :
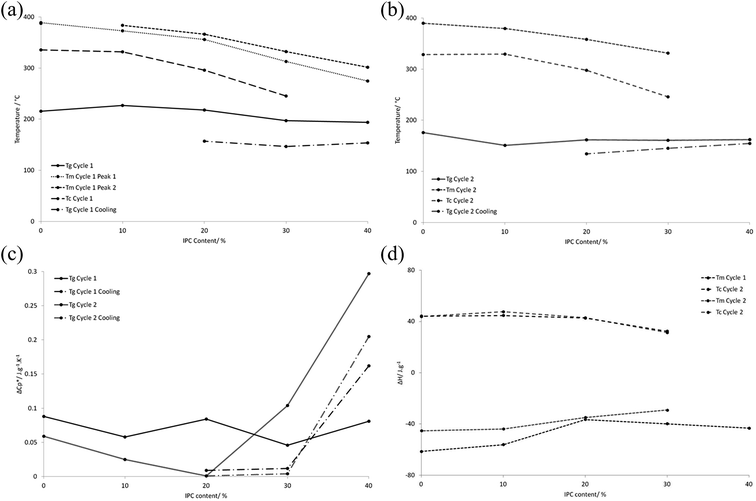
:![[thin space (1/6-em)]](https://www.rsc.org/images/entities/char_2009.gif) I ratio on the thermal properties of the bulk material, using two heating cycles of 90–400 °C at 20 °C min−1 followed by cooling from 400–90 °C at 10 °C min−1 i.e. one cycle examining the particulate polymer and one cycle examining the consolidated film. All of the variable parameters (time, temperature and heating/cooling rate) were kept constant between samples. Key data points (Tm, Tg, and enthalpies of melting) are summarised in Table 2, and trends in thermal properties are illustrated in Fig. 2 (glass transition, crystallisation and melting temperatures and associated energy transitions of 100
I ratio on the thermal properties of the bulk material, using two heating cycles of 90–400 °C at 20 °C min−1 followed by cooling from 400–90 °C at 10 °C min−1 i.e. one cycle examining the particulate polymer and one cycle examining the consolidated film. All of the variable parameters (time, temperature and heating/cooling rate) were kept constant between samples. Key data points (Tm, Tg, and enthalpies of melting) are summarised in Table 2, and trends in thermal properties are illustrated in Fig. 2 (glass transition, crystallisation and melting temperatures and associated energy transitions of 100![[thin space (1/6-em)]](https://www.rsc.org/images/entities/char_2009.gif) :
:![[thin space (1/6-em)]](https://www.rsc.org/images/entities/char_2009.gif) 0, 90
0, 90![[thin space (1/6-em)]](https://www.rsc.org/images/entities/char_2009.gif) :
:![[thin space (1/6-em)]](https://www.rsc.org/images/entities/char_2009.gif) 10, 80
10, 80![[thin space (1/6-em)]](https://www.rsc.org/images/entities/char_2009.gif) :
:![[thin space (1/6-em)]](https://www.rsc.org/images/entities/char_2009.gif) 20, 70
20, 70![[thin space (1/6-em)]](https://www.rsc.org/images/entities/char_2009.gif) :
:![[thin space (1/6-em)]](https://www.rsc.org/images/entities/char_2009.gif) 30 and 60
30 and 60![[thin space (1/6-em)]](https://www.rsc.org/images/entities/char_2009.gif) :
:![[thin space (1/6-em)]](https://www.rsc.org/images/entities/char_2009.gif) 40 PEKKs over two heating (20 °C min−1) and cooling (10 °C min−1) cycles of 90 °C to 400 °C), with the full DSC thermogram data being given in Fig. 2 (ESI†).
40 PEKKs over two heating (20 °C min−1) and cooling (10 °C min−1) cycles of 90 °C to 400 °C), with the full DSC thermogram data being given in Fig. 2 (ESI†).
| First heat-cool cycle | |||||||||
|---|---|---|---|---|---|---|---|---|---|
| Polymer | Heating | Cooling | |||||||
| Tg/J g−1 K−1 | Tm1 | Tm2 | J g−1 | Tg/J g−1 K−1 | Tc/J g−1 | ||||
| 60–40 | 193.7 | 0.081 | 274.7 | 301.5 | −43.31 | 153.5 | 0.162 | — | — |
| 70–30 | 197.3 | 0.046 | 312.8 | 332 | −39.8 | 146.7 | 0.012 | 245.2 | 32.34 |
| 80–20 | 218.1 | 0.084 | 355.6 | 365.9 | −36.49 | 157.1 | 0.009 | 295.8 | 42.64 |
| 90–10 | 227 | 0.058 | 372.7 | 383.6 | −56.18 | — | — | 331.7 | 44.7 |
| 100–0* | 215.7 | 0.088 | 388.7 | — | −61.38 | 154.8 | 0.013 | 335.5 | 44.14 |
| Second heat-cool cycle | ||||||||
|---|---|---|---|---|---|---|---|---|
| Polymer | Heating | Cooling | ||||||
| Tg/J g−1 K−1 | Tm/J g−1 | Tc/J g−1 | Tg/J g−1 K−1 | |||||
| 60–40 | 162 | 0.297 | — | — | — | — | 154.7 | 0.205 |
| 70–30 | 160.9 | 0.104 | 331.2 | −29.1 | 245.5 | 31.28 | 145.4 | 0.004 |
| 80–20 | 161.6 | 0.001 | 358.1 | −34.94 | 297.6 | 42.85 | 134.5 | 0.001 |
| 90–10 | 150.6 | 0.025 | 379.5 | −43.88 | 329.4 | 47.62 | — | — |
| 100–0* | 175.8 | 0.059 | 389.8 | −45.23 | 328.3 | 43.8 | 171.6 | 0.078 |
During the first heating cycle, all of the PEKKs, except the 100![[thin space (1/6-em)]](https://www.rsc.org/images/entities/char_2009.gif) :
:![[thin space (1/6-em)]](https://www.rsc.org/images/entities/char_2009.gif) 0 PEKK, exhibited double melting peaks, indicating two crystalline states (Fig. 2(a and b), ESI†). These melting points corresponding to these peaks converged and increased in value when the I content was decreased, until a single melting peak was observed for the 100
0 PEKK, exhibited double melting peaks, indicating two crystalline states (Fig. 2(a and b), ESI†). These melting points corresponding to these peaks converged and increased in value when the I content was decreased, until a single melting peak was observed for the 100![[thin space (1/6-em)]](https://www.rsc.org/images/entities/char_2009.gif) :
:![[thin space (1/6-em)]](https://www.rsc.org/images/entities/char_2009.gif) 0 PEKK. The double melting peaks are likely to be due to the different crystal structures of the T–T and T–I sections of the polymer, with one melting before the other.17,37 In fact, both Tg and Tm decreased with increased I content of the polymers, and the enthalpy change associated with Tm also decreased with increased I content (Fig. 2(a)–(c)), consistent with a lower degree of crystallinity. During the first cooling cycle (Fig. 2(b), ESI†), single Tc values were observed which decreased and broadened, accompanied by a decreased enthalpy change, with increased I content (Fig. 2(a) and (d)). However, the 60
0 PEKK. The double melting peaks are likely to be due to the different crystal structures of the T–T and T–I sections of the polymer, with one melting before the other.17,37 In fact, both Tg and Tm decreased with increased I content of the polymers, and the enthalpy change associated with Tm also decreased with increased I content (Fig. 2(a)–(c)), consistent with a lower degree of crystallinity. During the first cooling cycle (Fig. 2(b), ESI†), single Tc values were observed which decreased and broadened, accompanied by a decreased enthalpy change, with increased I content (Fig. 2(a) and (d)). However, the 60![[thin space (1/6-em)]](https://www.rsc.org/images/entities/char_2009.gif) :
:![[thin space (1/6-em)]](https://www.rsc.org/images/entities/char_2009.gif) 40 PEKK did not demonstrate a Tc, indicating that it was amorphous at this point. The particulate 60
40 PEKK did not demonstrate a Tc, indicating that it was amorphous at this point. The particulate 60![[thin space (1/6-em)]](https://www.rsc.org/images/entities/char_2009.gif) :
:![[thin space (1/6-em)]](https://www.rsc.org/images/entities/char_2009.gif) 40 PEKK was highly crystalline and exhibited two melting peaks. It is known that PEKK films may undergo solvent-induced crystallisation in DCM,37 and this may have occurred during the polymerisation. Once melted, the PEKK was amorphous.
40 PEKK was highly crystalline and exhibited two melting peaks. It is known that PEKK films may undergo solvent-induced crystallisation in DCM,37 and this may have occurred during the polymerisation. Once melted, the PEKK was amorphous.
The DSC trace for the second heating cycle is also shown in Fig. 2(c) (ESI†). Thus, on increasing the I content, the Tg decreases from 175.8 to 162.0 °C, a phenomenon which is exhibited by all of the PEKKs. The introduction of the I component has little effect on the mobility of the predominantly T polymer backbone. The effect of increasing the I content on the Tm is more pronounced, decreasing the Tm of the 100![[thin space (1/6-em)]](https://www.rsc.org/images/entities/char_2009.gif) :
:![[thin space (1/6-em)]](https://www.rsc.org/images/entities/char_2009.gif) 0 PEKK from 389.8 °C to 331.2 °C of the 70
0 PEKK from 389.8 °C to 331.2 °C of the 70![[thin space (1/6-em)]](https://www.rsc.org/images/entities/char_2009.gif) :
:![[thin space (1/6-em)]](https://www.rsc.org/images/entities/char_2009.gif) 30 PEKK. Since Tm values are dependent on the presence and extent of crystallite formation in a polymer, a Tm is not observed for the 60
30 PEKK. Since Tm values are dependent on the presence and extent of crystallite formation in a polymer, a Tm is not observed for the 60![[thin space (1/6-em)]](https://www.rsc.org/images/entities/char_2009.gif) :
:![[thin space (1/6-em)]](https://www.rsc.org/images/entities/char_2009.gif) 40 PEKK after initial melting, indicating that it is amorphous. The 100
40 PEKK after initial melting, indicating that it is amorphous. The 100![[thin space (1/6-em)]](https://www.rsc.org/images/entities/char_2009.gif) :
:![[thin space (1/6-em)]](https://www.rsc.org/images/entities/char_2009.gif) 0 PEKK is highly crystalline due to the effective packing of the T units in the crystal lattice. X-ray studies38 demonstrated that the average bond angle between both ether and ketone groups, linked by a phenylene, was 124°, with a 10 Å distance between every second group, and this highly ordered, planar “zig-zag” configuration, is conducive to crystallisation.15 The I units have a different geometry, do not pack as efficiently and disrupt the crystal lattice, resulting in a lower Tm. Increasing the I content continually decreases the Tm, until the amorphous 60
0 PEKK is highly crystalline due to the effective packing of the T units in the crystal lattice. X-ray studies38 demonstrated that the average bond angle between both ether and ketone groups, linked by a phenylene, was 124°, with a 10 Å distance between every second group, and this highly ordered, planar “zig-zag” configuration, is conducive to crystallisation.15 The I units have a different geometry, do not pack as efficiently and disrupt the crystal lattice, resulting in a lower Tm. Increasing the I content continually decreases the Tm, until the amorphous 60![[thin space (1/6-em)]](https://www.rsc.org/images/entities/char_2009.gif) :
:![[thin space (1/6-em)]](https://www.rsc.org/images/entities/char_2009.gif) 40 PEKK is observed. During the cooling cycle (Fig. 2d, ESI†), increasing the I content decreases the crystallisation temperature, for the reasons detailed above. It is also expected that polymers with higher degrees of crystallinity will have narrower crystallisation peaks, since there is lower barrier to the ease of crystallisation, and this effect is partially demonstrated.
40 PEKK is observed. During the cooling cycle (Fig. 2d, ESI†), increasing the I content decreases the crystallisation temperature, for the reasons detailed above. It is also expected that polymers with higher degrees of crystallinity will have narrower crystallisation peaks, since there is lower barrier to the ease of crystallisation, and this effect is partially demonstrated.
Polymer characterisation
![[thin space (1/6-em)]](https://www.rsc.org/images/entities/char_2009.gif) :
:![[thin space (1/6-em)]](https://www.rsc.org/images/entities/char_2009.gif) I ratio prepared in this work should have the same molecular weight since they were all polymerised at 3% out-of-balance, with IV in the range 0.8–0.9 dL g−1.39 However, considering that these reactions were carried out on a one litre scale, a small amount of monomer loss will have a large effect on the resultant molecular weight of the polymer, and since this is inevitable, small variation in molecular weight was anticipated. Inherent viscosities were calculated using a 0.1 wt% polymer solution in concentrated sulfuric acid at 25 °C using a glass Ostwald viscometer, and standard analysis using Mark–Houwink equation (reference data for PEKK was not available, so those for PEEK with k = 6.195 × 10⁻⁵ and a = 0.94 were assumed). This gave the data in Table 3, in which little variation in the inherent viscosity values of the PEKKs was indeed observed, with the average being 0.83 dL g−1, corresponding to an average Mv of 24
I ratio prepared in this work should have the same molecular weight since they were all polymerised at 3% out-of-balance, with IV in the range 0.8–0.9 dL g−1.39 However, considering that these reactions were carried out on a one litre scale, a small amount of monomer loss will have a large effect on the resultant molecular weight of the polymer, and since this is inevitable, small variation in molecular weight was anticipated. Inherent viscosities were calculated using a 0.1 wt% polymer solution in concentrated sulfuric acid at 25 °C using a glass Ostwald viscometer, and standard analysis using Mark–Houwink equation (reference data for PEKK was not available, so those for PEEK with k = 6.195 × 10⁻⁵ and a = 0.94 were assumed). This gave the data in Table 3, in which little variation in the inherent viscosity values of the PEKKs was indeed observed, with the average being 0.83 dL g−1, corresponding to an average Mv of 24![[thin space (1/6-em)]](https://www.rsc.org/images/entities/char_2009.gif) 440. This variation is likely to be due to monomer loss rather than the effect of variable T
440. This variation is likely to be due to monomer loss rather than the effect of variable T![[thin space (1/6-em)]](https://www.rsc.org/images/entities/char_2009.gif) :
:![[thin space (1/6-em)]](https://www.rsc.org/images/entities/char_2009.gif) I ratio.
I ratio.
Polymer T![[thin space (1/6-em)]](https://www.rsc.org/images/entities/char_2009.gif) : :![[thin space (1/6-em)]](https://www.rsc.org/images/entities/char_2009.gif) I I |
Inherent viscosity/dL g−1 | Molecular weight (Mv) |
|---|---|---|
100![[thin space (1/6-em)]](https://www.rsc.org/images/entities/char_2009.gif) : :![[thin space (1/6-em)]](https://www.rsc.org/images/entities/char_2009.gif) 0 0 |
0.88 | 26![[thin space (1/6-em)]](https://www.rsc.org/images/entities/char_2009.gif) 100 100 |
90![[thin space (1/6-em)]](https://www.rsc.org/images/entities/char_2009.gif) : :![[thin space (1/6-em)]](https://www.rsc.org/images/entities/char_2009.gif) 10 10 |
0.80 | 23![[thin space (1/6-em)]](https://www.rsc.org/images/entities/char_2009.gif) 600 600 |
80![[thin space (1/6-em)]](https://www.rsc.org/images/entities/char_2009.gif) : :![[thin space (1/6-em)]](https://www.rsc.org/images/entities/char_2009.gif) 20 20 |
0.78 | 23![[thin space (1/6-em)]](https://www.rsc.org/images/entities/char_2009.gif) 000 000 |
70![[thin space (1/6-em)]](https://www.rsc.org/images/entities/char_2009.gif) : :![[thin space (1/6-em)]](https://www.rsc.org/images/entities/char_2009.gif) 30 30 |
0.77 | 22![[thin space (1/6-em)]](https://www.rsc.org/images/entities/char_2009.gif) 700 700 |
60![[thin space (1/6-em)]](https://www.rsc.org/images/entities/char_2009.gif) : :![[thin space (1/6-em)]](https://www.rsc.org/images/entities/char_2009.gif) 40 40 |
0.90 | 26![[thin space (1/6-em)]](https://www.rsc.org/images/entities/char_2009.gif) 800 800 |
![[thin space (1/6-em)]](https://www.rsc.org/images/entities/char_2009.gif) :
:![[thin space (1/6-em)]](https://www.rsc.org/images/entities/char_2009.gif) 30 and 80
30 and 80![[thin space (1/6-em)]](https://www.rsc.org/images/entities/char_2009.gif) :
:![[thin space (1/6-em)]](https://www.rsc.org/images/entities/char_2009.gif) 20 PEKKs had approximately equal melt viscosities of 800–900 MPa, as expected due to their similar molecular weights, while the 60
20 PEKKs had approximately equal melt viscosities of 800–900 MPa, as expected due to their similar molecular weights, while the 60![[thin space (1/6-em)]](https://www.rsc.org/images/entities/char_2009.gif) :
:![[thin space (1/6-em)]](https://www.rsc.org/images/entities/char_2009.gif) 40 PEKK has a higher melt viscosity, most likely associated with its higher molecular weight. While the 90
40 PEKK has a higher melt viscosity, most likely associated with its higher molecular weight. While the 90![[thin space (1/6-em)]](https://www.rsc.org/images/entities/char_2009.gif) :
:![[thin space (1/6-em)]](https://www.rsc.org/images/entities/char_2009.gif) 10 PEKK initially maintains a similar melt viscosity to the other systems, its viscosity significantly increases over the final 15 minutes, probably as the analysis temperature is not high enough to maintain the melt form of this high Tm material. By contrast, the 100
10 PEKK initially maintains a similar melt viscosity to the other systems, its viscosity significantly increases over the final 15 minutes, probably as the analysis temperature is not high enough to maintain the melt form of this high Tm material. By contrast, the 100![[thin space (1/6-em)]](https://www.rsc.org/images/entities/char_2009.gif) :
:![[thin space (1/6-em)]](https://www.rsc.org/images/entities/char_2009.gif) 0 PEKK has a much higher initial melt viscosity of 5000 MPa, and this rises rapidly to 18
0 PEKK has a much higher initial melt viscosity of 5000 MPa, and this rises rapidly to 18![[thin space (1/6-em)]](https://www.rsc.org/images/entities/char_2009.gif) 000 MPa, after 30 minutes (Fig. 3, inset); this outcome is likely to result from both the higher molecular weight and the more ordered structure of this material.
000 MPa, after 30 minutes (Fig. 3, inset); this outcome is likely to result from both the higher molecular weight and the more ordered structure of this material.
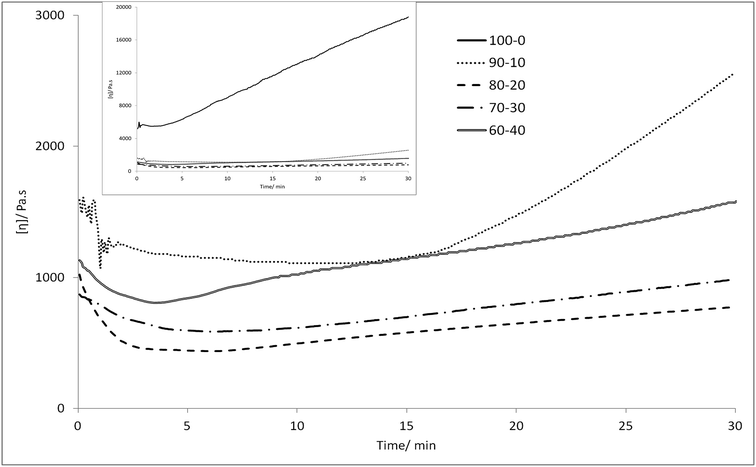 | ||
Fig. 3 Melt viscosity of 100![[thin space (1/6-em)]](https://www.rsc.org/images/entities/char_2009.gif) : :![[thin space (1/6-em)]](https://www.rsc.org/images/entities/char_2009.gif) 0 (inset), 90 0 (inset), 90![[thin space (1/6-em)]](https://www.rsc.org/images/entities/char_2009.gif) : :![[thin space (1/6-em)]](https://www.rsc.org/images/entities/char_2009.gif) 10, 80 10, 80![[thin space (1/6-em)]](https://www.rsc.org/images/entities/char_2009.gif) : :![[thin space (1/6-em)]](https://www.rsc.org/images/entities/char_2009.gif) 20, 70 20, 70![[thin space (1/6-em)]](https://www.rsc.org/images/entities/char_2009.gif) : :![[thin space (1/6-em)]](https://www.rsc.org/images/entities/char_2009.gif) 30 and 60 30 and 60![[thin space (1/6-em)]](https://www.rsc.org/images/entities/char_2009.gif) : :![[thin space (1/6-em)]](https://www.rsc.org/images/entities/char_2009.gif) 40 PEKKs at 380 °C (100 40 PEKKs at 380 °C (100![[thin space (1/6-em)]](https://www.rsc.org/images/entities/char_2009.gif) : :![[thin space (1/6-em)]](https://www.rsc.org/images/entities/char_2009.gif) 0 PEKK at 400 °C) and a shear rate of 1 s−1 over 30 minutes by capillary rheometry. 0 PEKK at 400 °C) and a shear rate of 1 s−1 over 30 minutes by capillary rheometry. | ||
The melt viscosity of each of the 60![[thin space (1/6-em)]](https://www.rsc.org/images/entities/char_2009.gif) :
:![[thin space (1/6-em)]](https://www.rsc.org/images/entities/char_2009.gif) 40, 70
40, 70![[thin space (1/6-em)]](https://www.rsc.org/images/entities/char_2009.gif) :
:![[thin space (1/6-em)]](https://www.rsc.org/images/entities/char_2009.gif) 30, 80
30, 80![[thin space (1/6-em)]](https://www.rsc.org/images/entities/char_2009.gif) :
:![[thin space (1/6-em)]](https://www.rsc.org/images/entities/char_2009.gif) 20 and 90
20 and 90![[thin space (1/6-em)]](https://www.rsc.org/images/entities/char_2009.gif) :
:![[thin space (1/6-em)]](https://www.rsc.org/images/entities/char_2009.gif) 10 PEKKs was recorded at 380 °C, and little change over 30 minutes was observed. However, the melting temperature of 100
10 PEKKs was recorded at 380 °C, and little change over 30 minutes was observed. However, the melting temperature of 100![[thin space (1/6-em)]](https://www.rsc.org/images/entities/char_2009.gif) :
:![[thin space (1/6-em)]](https://www.rsc.org/images/entities/char_2009.gif) 0 PEKK is 389.8 °C, requiring a processing temperature of over 400 °C, and this is not desirable, as at this temperature the polymer degrades, causing a rapid increase in viscosity. For this reason, 100
0 PEKK is 389.8 °C, requiring a processing temperature of over 400 °C, and this is not desirable, as at this temperature the polymer degrades, causing a rapid increase in viscosity. For this reason, 100![[thin space (1/6-em)]](https://www.rsc.org/images/entities/char_2009.gif) :
:![[thin space (1/6-em)]](https://www.rsc.org/images/entities/char_2009.gif) 0 PEKK is not suitable for industrial applications, which typically requires less than 50% change in viscosity over 30 minutes, this being the length of time required to change a die on an industrial extruder without it being emptied.39
0 PEKK is not suitable for industrial applications, which typically requires less than 50% change in viscosity over 30 minutes, this being the length of time required to change a die on an industrial extruder without it being emptied.39
Polymer morphology
Mastersizer light scattering was used to examine the effect of the T![[thin space (1/6-em)]](https://www.rsc.org/images/entities/char_2009.gif) :
:![[thin space (1/6-em)]](https://www.rsc.org/images/entities/char_2009.gif) I ratio on the PEKK particle size. A continuous phase of 50
I ratio on the PEKK particle size. A continuous phase of 50![[thin space (1/6-em)]](https://www.rsc.org/images/entities/char_2009.gif) :
:![[thin space (1/6-em)]](https://www.rsc.org/images/entities/char_2009.gif) 50 vol% isopropyl alcohol (IPA)
50 vol% isopropyl alcohol (IPA)![[thin space (1/6-em)]](https://www.rsc.org/images/entities/char_2009.gif) :
:![[thin space (1/6-em)]](https://www.rsc.org/images/entities/char_2009.gif) water was required to sufficiently wet the particles and to avoid agglomeration. The particle size distributions are shown in Table 4 (for distribution curve data, see Fig. 3, ESI†), where it can be seen that the volume-weighted mean increased from 71.1 μm for 100
water was required to sufficiently wet the particles and to avoid agglomeration. The particle size distributions are shown in Table 4 (for distribution curve data, see Fig. 3, ESI†), where it can be seen that the volume-weighted mean increased from 71.1 μm for 100![[thin space (1/6-em)]](https://www.rsc.org/images/entities/char_2009.gif) :
:![[thin space (1/6-em)]](https://www.rsc.org/images/entities/char_2009.gif) 0 PEKK to 166.1 μm for 60
0 PEKK to 166.1 μm for 60![[thin space (1/6-em)]](https://www.rsc.org/images/entities/char_2009.gif) :
:![[thin space (1/6-em)]](https://www.rsc.org/images/entities/char_2009.gif) 40 PEKK. Increasing the I content of the PEKKs increased both the mean particle diameter and the range of particle diameter, indicated by the greater difference between the D(0.1) and D(0.9) values, whilst decreasing the uniformity of shape (Table 4). It is likely that this arises due to high % crystallinity for the 100
40 PEKK. Increasing the I content of the PEKKs increased both the mean particle diameter and the range of particle diameter, indicated by the greater difference between the D(0.1) and D(0.9) values, whilst decreasing the uniformity of shape (Table 4). It is likely that this arises due to high % crystallinity for the 100![[thin space (1/6-em)]](https://www.rsc.org/images/entities/char_2009.gif) :
:![[thin space (1/6-em)]](https://www.rsc.org/images/entities/char_2009.gif) 0 PEKK, causing overall contraction of the polymer, and resulting in smaller particles. Conversely, a greater incorporation of IPC results in a more amorphous and less compact structure, resulting in larger particles. A small particle size tail was observed for 70
0 PEKK, causing overall contraction of the polymer, and resulting in smaller particles. Conversely, a greater incorporation of IPC results in a more amorphous and less compact structure, resulting in larger particles. A small particle size tail was observed for 70![[thin space (1/6-em)]](https://www.rsc.org/images/entities/char_2009.gif) :
:![[thin space (1/6-em)]](https://www.rsc.org/images/entities/char_2009.gif) 30 PEKK, whilst large particle size tails were observed for 80
30 PEKK, whilst large particle size tails were observed for 80![[thin space (1/6-em)]](https://www.rsc.org/images/entities/char_2009.gif) :
:![[thin space (1/6-em)]](https://www.rsc.org/images/entities/char_2009.gif) 20 and 60
20 and 60![[thin space (1/6-em)]](https://www.rsc.org/images/entities/char_2009.gif) :
:![[thin space (1/6-em)]](https://www.rsc.org/images/entities/char_2009.gif) 40 PEKK. Larger particle size tails may be attributed to the agglomeration of smaller particles, caused either by physical agglomeration of the particles or by poor wetting and distribution of the particles by the solvent. It is suspected that all of the polymers would initially demonstrate small particle size tails but most small particles are washed out during workup.
40 PEKK. Larger particle size tails may be attributed to the agglomeration of smaller particles, caused either by physical agglomeration of the particles or by poor wetting and distribution of the particles by the solvent. It is suspected that all of the polymers would initially demonstrate small particle size tails but most small particles are washed out during workup.
![[thin space (1/6-em)]](https://www.rsc.org/images/entities/char_2009.gif) :
:![[thin space (1/6-em)]](https://www.rsc.org/images/entities/char_2009.gif) 0, 90
0, 90![[thin space (1/6-em)]](https://www.rsc.org/images/entities/char_2009.gif) :
:![[thin space (1/6-em)]](https://www.rsc.org/images/entities/char_2009.gif) 10, 80
10, 80![[thin space (1/6-em)]](https://www.rsc.org/images/entities/char_2009.gif) :
:![[thin space (1/6-em)]](https://www.rsc.org/images/entities/char_2009.gif) 20, 70
20, 70![[thin space (1/6-em)]](https://www.rsc.org/images/entities/char_2009.gif) :
:![[thin space (1/6-em)]](https://www.rsc.org/images/entities/char_2009.gif) 30 and 60
30 and 60![[thin space (1/6-em)]](https://www.rsc.org/images/entities/char_2009.gif) :
:![[thin space (1/6-em)]](https://www.rsc.org/images/entities/char_2009.gif) 40 PEKKs, as determined by Mastersizer light scattering in 50
40 PEKKs, as determined by Mastersizer light scattering in 50![[thin space (1/6-em)]](https://www.rsc.org/images/entities/char_2009.gif) :
:![[thin space (1/6-em)]](https://www.rsc.org/images/entities/char_2009.gif) 50 IPA
50 IPA![[thin space (1/6-em)]](https://www.rsc.org/images/entities/char_2009.gif) :
:![[thin space (1/6-em)]](https://www.rsc.org/images/entities/char_2009.gif) water solvent
water solvent
| Polymer | Mean particle diameter/μm | D (0.1) | D (0.5) | D (0.9) | |
|---|---|---|---|---|---|
| Volume weighted | Surface weighted | ||||
100![[thin space (1/6-em)]](https://www.rsc.org/images/entities/char_2009.gif) : :![[thin space (1/6-em)]](https://www.rsc.org/images/entities/char_2009.gif) 0 0 |
71.1 | 61.1 | 39.6 | 65.7 | 110.1 |
90![[thin space (1/6-em)]](https://www.rsc.org/images/entities/char_2009.gif) : :![[thin space (1/6-em)]](https://www.rsc.org/images/entities/char_2009.gif) 10 10 |
78.5 | 68.1 | 44.5 | 72.9 | 120.4 |
80![[thin space (1/6-em)]](https://www.rsc.org/images/entities/char_2009.gif) : :![[thin space (1/6-em)]](https://www.rsc.org/images/entities/char_2009.gif) 20 20 |
91.7 | 64.6 | 38.4 | 68.5 | 171.6 |
70![[thin space (1/6-em)]](https://www.rsc.org/images/entities/char_2009.gif) : :![[thin space (1/6-em)]](https://www.rsc.org/images/entities/char_2009.gif) 30 30 |
98.3 | 58.1 | 37.8 | 85.0 | 172.5 |
60![[thin space (1/6-em)]](https://www.rsc.org/images/entities/char_2009.gif) : :![[thin space (1/6-em)]](https://www.rsc.org/images/entities/char_2009.gif) 40 40 |
166.1 | 96.1 | 54.1 | 105.2 | 352.6 |
![[thin space (1/6-em)]](https://www.rsc.org/images/entities/char_2009.gif) :
:![[thin space (1/6-em)]](https://www.rsc.org/images/entities/char_2009.gif) I ratio on the size and shape of the particulate PEKKs (Table 5). It was found that T
I ratio on the size and shape of the particulate PEKKs (Table 5). It was found that T![[thin space (1/6-em)]](https://www.rsc.org/images/entities/char_2009.gif) :
:![[thin space (1/6-em)]](https://www.rsc.org/images/entities/char_2009.gif) I ratio does have an effect on the shape of the polymer particles. Thus, particles of 100
I ratio does have an effect on the shape of the polymer particles. Thus, particles of 100![[thin space (1/6-em)]](https://www.rsc.org/images/entities/char_2009.gif) :
:![[thin space (1/6-em)]](https://www.rsc.org/images/entities/char_2009.gif) 0 PEKK are near-spherical and have a relatively smooth surface. As the I content and particle size increases, the particles also become more irregular in shape. It appears that many of the particles were hollow and have imploded, possibly during drying stages under vacuum. However, the 70
0 PEKK are near-spherical and have a relatively smooth surface. As the I content and particle size increases, the particles also become more irregular in shape. It appears that many of the particles were hollow and have imploded, possibly during drying stages under vacuum. However, the 70![[thin space (1/6-em)]](https://www.rsc.org/images/entities/char_2009.gif) :
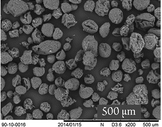
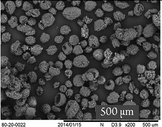
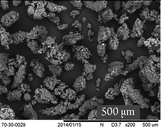
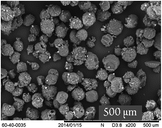
:![[thin space (1/6-em)]](https://www.rsc.org/images/entities/char_2009.gif) 30 PEKK particles were more irregular, with the appearance of agglomerates. When tap water was used in the work-up process, white flecks could be observed on the SEM images of the PEKK samples, which were confirmed to be calcium salts by in situ EDS analysis, but this could be avoided with work-up procedures that used only deionised water. Moreover, the particle size range was typically 40–80 micron; this is slightly smaller than the light scattering data given above, but is consistent with the known swelling behaviour of the particles in the presence of solvent. PEKK (100
30 PEKK particles were more irregular, with the appearance of agglomerates. When tap water was used in the work-up process, white flecks could be observed on the SEM images of the PEKK samples, which were confirmed to be calcium salts by in situ EDS analysis, but this could be avoided with work-up procedures that used only deionised water. Moreover, the particle size range was typically 40–80 micron; this is slightly smaller than the light scattering data given above, but is consistent with the known swelling behaviour of the particles in the presence of solvent. PEKK (100![[thin space (1/6-em)]](https://www.rsc.org/images/entities/char_2009.gif) :
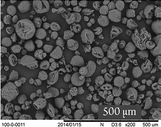
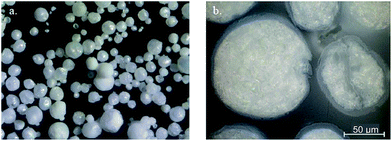
:![[thin space (1/6-em)]](https://www.rsc.org/images/entities/char_2009.gif) 0) particles synthesised under the same conditions were found to be largely spherical in character (Fig. 4(a)) and after being “potted and polished” in epoxy resin to examine their interior, were found to have a diameter >50 μm with a porous centre and a denser skin on the outside (Fig. 4). It is thought that the hydrogen chloride gas evolved under the anhydrous reaction conditions during the polymerisation is responsible for the formation of pores within these particles. The most attractive attribute of the dispersion process is the ability to produce spherical, particulate PEKK without post polymerisation processing. At higher I contents and larger particle sizes, this characteristic is still apparent but less defined.
0) particles synthesised under the same conditions were found to be largely spherical in character (Fig. 4(a)) and after being “potted and polished” in epoxy resin to examine their interior, were found to have a diameter >50 μm with a porous centre and a denser skin on the outside (Fig. 4). It is thought that the hydrogen chloride gas evolved under the anhydrous reaction conditions during the polymerisation is responsible for the formation of pores within these particles. The most attractive attribute of the dispersion process is the ability to produce spherical, particulate PEKK without post polymerisation processing. At higher I contents and larger particle sizes, this characteristic is still apparent but less defined.
![[thin space (1/6-em)]](https://www.rsc.org/images/entities/char_2009.gif) :
:![[thin space (1/6-em)]](https://www.rsc.org/images/entities/char_2009.gif) 0, 90
0, 90![[thin space (1/6-em)]](https://www.rsc.org/images/entities/char_2009.gif) :
:![[thin space (1/6-em)]](https://www.rsc.org/images/entities/char_2009.gif) 10, 80
10, 80![[thin space (1/6-em)]](https://www.rsc.org/images/entities/char_2009.gif) :
:![[thin space (1/6-em)]](https://www.rsc.org/images/entities/char_2009.gif) 20, 70
20, 70![[thin space (1/6-em)]](https://www.rsc.org/images/entities/char_2009.gif) :
:![[thin space (1/6-em)]](https://www.rsc.org/images/entities/char_2009.gif) 30 and 60
30 and 60![[thin space (1/6-em)]](https://www.rsc.org/images/entities/char_2009.gif) :
:![[thin space (1/6-em)]](https://www.rsc.org/images/entities/char_2009.gif) 40 T
40 T![[thin space (1/6-em)]](https://www.rsc.org/images/entities/char_2009.gif) :
:![[thin space (1/6-em)]](https://www.rsc.org/images/entities/char_2009.gif) I ratios
I ratios
![[thin space (1/6-em)]](https://www.rsc.org/images/entities/char_2009.gif) :
:![[thin space (1/6-em)]](https://www.rsc.org/images/entities/char_2009.gif) 0 PEKK prepared in this work possessed 35% degree of crystallinity (Table 6), which is similar to that of the maximum known value.3 On increasing the I content, crystallite formation is disrupted by the geometry of the I monomer segments, decreasing the overall degree of crystallinity; for the 60
0 PEKK prepared in this work possessed 35% degree of crystallinity (Table 6), which is similar to that of the maximum known value.3 On increasing the I content, crystallite formation is disrupted by the geometry of the I monomer segments, decreasing the overall degree of crystallinity; for the 60![[thin space (1/6-em)]](https://www.rsc.org/images/entities/char_2009.gif) :
:![[thin space (1/6-em)]](https://www.rsc.org/images/entities/char_2009.gif) 40 PEKK, no crystallites form and the PEKK is amorphous.
40 PEKK, no crystallites form and the PEKK is amorphous.
![[thin space (1/6-em)]](https://www.rsc.org/images/entities/char_2009.gif) :
:![[thin space (1/6-em)]](https://www.rsc.org/images/entities/char_2009.gif) 0, 90
0, 90![[thin space (1/6-em)]](https://www.rsc.org/images/entities/char_2009.gif) :
:![[thin space (1/6-em)]](https://www.rsc.org/images/entities/char_2009.gif) 10, 80
10, 80![[thin space (1/6-em)]](https://www.rsc.org/images/entities/char_2009.gif) :
:![[thin space (1/6-em)]](https://www.rsc.org/images/entities/char_2009.gif) 20, 70
20, 70![[thin space (1/6-em)]](https://www.rsc.org/images/entities/char_2009.gif) :
:![[thin space (1/6-em)]](https://www.rsc.org/images/entities/char_2009.gif) 30 and 60
30 and 60![[thin space (1/6-em)]](https://www.rsc.org/images/entities/char_2009.gif) :
:![[thin space (1/6-em)]](https://www.rsc.org/images/entities/char_2009.gif) 40 T
40 T![[thin space (1/6-em)]](https://www.rsc.org/images/entities/char_2009.gif) :
:![[thin space (1/6-em)]](https://www.rsc.org/images/entities/char_2009.gif) I ratios as determined by DSC
I ratios as determined by DSC
Polymer T![[thin space (1/6-em)]](https://www.rsc.org/images/entities/char_2009.gif) : :![[thin space (1/6-em)]](https://www.rsc.org/images/entities/char_2009.gif) I I |
Degree of crystallinity/% |
|---|---|
100![[thin space (1/6-em)]](https://www.rsc.org/images/entities/char_2009.gif) : :![[thin space (1/6-em)]](https://www.rsc.org/images/entities/char_2009.gif) 0 0 |
35 |
90![[thin space (1/6-em)]](https://www.rsc.org/images/entities/char_2009.gif) : :![[thin space (1/6-em)]](https://www.rsc.org/images/entities/char_2009.gif) 10 10 |
34 |
80![[thin space (1/6-em)]](https://www.rsc.org/images/entities/char_2009.gif) : :![[thin space (1/6-em)]](https://www.rsc.org/images/entities/char_2009.gif) 20 20 |
27 |
70![[thin space (1/6-em)]](https://www.rsc.org/images/entities/char_2009.gif) : :![[thin space (1/6-em)]](https://www.rsc.org/images/entities/char_2009.gif) 30 30 |
23 |
60![[thin space (1/6-em)]](https://www.rsc.org/images/entities/char_2009.gif) : :![[thin space (1/6-em)]](https://www.rsc.org/images/entities/char_2009.gif) 40 40 |
— |
Firstly, addition of aluminium chloride to the other reagents requires caution in order to manage the substantial exotherms; this strong Lewis acid readily co-ordinates with the several carbonyl-containing reagents in the polymerisation. This temperature control is most readily achieved by the initial addition of aluminium chloride, benzoic acid, TPC/IPC at −20 °C, followed by EKKE and benzoyl chloride, allowing the last and largest exotherm to increase efficiently the reaction temperature to 20 °C without external heating. It was observed that, upon cooling to −20 °C for the initial addition, the mixture became opaque, due to the precipitation of fine white crystals. In a separate experiment, this precipitate was collected and subjected to analysis; the white, highly hygroscopic material was found to be soluble in chloroform, and immediate 1H and 13C NMR spectroscopic analysis indicated the presence of aromatic signals, but these did not correspond to those of benzoic acid. Clearly, this material was also not merely precipitated aluminium chloride, and the implication was that it was therefore an aluminium salt of form AlClx(O2CPh)3−x (x = 0–2). However, mass spectroscopic analysis was inconclusive, and did not return the expected molecular ion peak for any of the possible chloride/benzoate combinations. Isolation of the precipitate under anhydrous conditions was therefore attempted; the material obtained from the same interrupted polymerization process but conducted in a dry box was subjected to X-ray photoelectron spectroscopic analysis (XPS), giving the data shown in Table 7. This confirmed the presence both of aluminium, chloride, and benzoate. The most likely identity of the bulk of the white material is aluminium tribenzoate, along with an aluminium salt of form AlClx(O2CPh)3−x (x = 1 or 2). Of interest is that, if the chloride content is assumed to exist in the form AlCl2(O2CPh), and the remaining aluminium content recalculated for Al(O2CPh)3, then the data in the final column is achieved, suggesting that a possible formulation is [(Al(O2CPh)3)n·(AlCl2(O2CPh))m].
| Atom% | Observed | Calculated for Al(O2CPh)3 | Calculated for Al(O2CPh)3, adjusted with trace AlCl2(O2CPh) |
|---|---|---|---|
| C | 68.20 | 75.00 | 70.67 |
| O | 22.04 | 21.43 | 23.30 |
| Cl | 2.90 | 0 | 0 |
| Al | 6.40 | 3.57 | 6.03 |
Solution 27Al NMR spectroscopy (Fig. 4, ESI†) showed a large peak at 78.00 ppm, with a minor peak at 89.81 ppm, consistent with one major aluminium environment together with another minor aluminium environment. Solution 13C NMR spectroscopy demonstrated peaks at 174.20 (CO), 138.32 (ArC), 133.26 (ArC), 129.58 (ArC), and 126.47 (ArC) ppm, consistent with the presence of benzoate.41 The solid state 27Al NMR spectrum showed two peaks at 29.85 and −26.62 ppm, again indicating two aluminium environments, and the solid state 13C NMR spectrum showed peaks at 170.67, 170.19 (CO) 135.26 (ArC), 134.16 (ArC), 130.44 (ArC), 129.29 (ArC) ppm, again consistent with the presence of benzoate. Mass spectroscopy confirmed the presence of Al(BzO)3 at m/z 390, but no aluminium chlorides could be detected. FT-IR spectroscopic analysis was consistent with the presence of carboxylate anion, indicated by the peak at 1650–1550 cm−1 which could be attributed to asymmetrical stretching, and another at approximately 1400 cm−1 which could be attributed to symmetrical stretching.42 The lack of a broad OH peak confirmed that no water, Al(OH)3 or hydroxyl groups were present. Overall, this analysis was consistent with the formulation of Al(BzO)3, together with a small quantity of chlorinated species of form AlClx(O2CPh)3−x (x = 1 or 2). Optical microscopy demonstrated that the complex was crystalline, with a range in particle size, but all below 25 μm in diameter (Fig. 5). Unfortunately, it was not possible to achieve suitable powder diffraction data, due to the highly hygroscopic nature of this material, and the effect of final reaction temperature on particle size was not examined, due to the difficulty of managing the exotherm in the low boiling dichloromethane solvent.
 | ||
| Fig. 5 Optical microscopy images of the aluminium benzoate crystals, (a and b) transmission and (c) birefringence. | ||
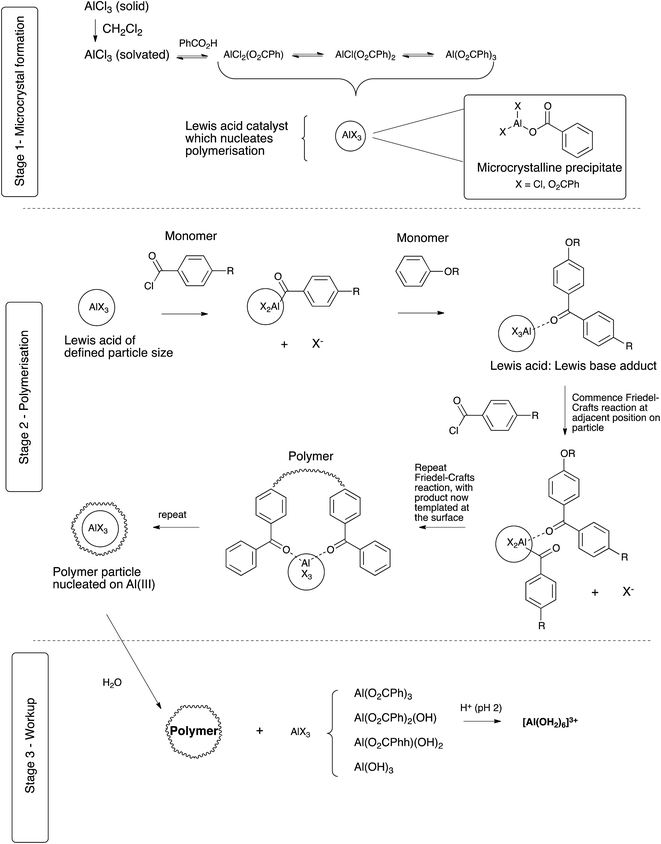
This data is consistent with initial ligand exchange of benzoate with the chloride of aluminium chloride, which generates a solution equilibrium mixture of all possible ligand combinations on aluminium(III) (Scheme 3, stage 1). However, because of the chelating nature of carboxylate ligands, the tribenzoate is capable of forming an oligomeric complex; this phenomenon is also known for other main group metals for benzoate ligands.43 This complex grows in size until the solubility limit is reached at the reaction temperature, at which point precipitation generates microcrystalline aluminium benzoate. However, importantly, the periphery of the microcrystalline complex must necessarily contain some (monodentate) chloride ligands which cap and discontinue the network (Scheme 3, stage 2). Such metal centres at the periphery would also provide a more electrophilic aluminium metal centre suitable for the catalysis of the required Friedel–Crafts reaction. The formation of this microcrystalline aluminium benzoate appears to be the critical physical form of the dispersant, whose chemical effect has been to attenuate the Lewis acidity of the starting aluminium chloride, but whose physical form provides appropriately sized particles for polymer nucleation. Of interest is that aluminium benzoate has been reported to promote crystallization in a range of polymers.44–46
These microcrystals would appear to have two subsequent actions; firstly, they act as a Lewis acid for Friedel–Crafts polymerisation and secondly, template the polymerization leading to a controlled particle size outcome. The central Al(O2CPh)3 gives the overall core structure of the microcrystals of AlX3 with the peripheral exterior Al(O2CPh)nCl3−n centres acting as Friedel–Crafts catalyst. Complexation with and activation of an acid chloride monomer leads to Friedel–Crafts reaction with the arene monomer at the particle surface. This dimer product remains associated with AlX3 via the carbonyl lone pair, as a Lewis acid:Lewis base adduct. The next acid chloride monomer complexes with AlX3 at a location further around the microcrystal, and can then undergo Friedel–Crafts acylation with the oligomeric adduct. Repetition of this process and the movement of the site of complex formation results in polymerisation around the microcrystal to form a polymer shell. Furthermore, release of hydrogen chloride gas under the anhydrous conditions of the reaction and within the growing polymer particle leads to the formation of a highly porous particle. Growth occurs around each crystal until completion of the polymerisation, thereby resulting in uniform polymerization and particle size, with particles being highly porous and with a well-defined outer surface layer. Decomplexation during work-up in iced water destroys the aluminium:polymer complex, to give Al(OH)3, manifested experimentally as an insoluble “gelatinous” precipitate in water (Scheme 3, stage 3). However, a further acid wash has been found to be necessary to achieve complete decomplexation, reflecting the high stability of the aluminium adduct, and this gives the more soluble (hexaaqua)aluminium(III) which is readily washed out. The resulting particles are porous, homogenous materials, but which may collapse from external force.
Conclusion
Particulate poly(ether ketone ketone)s (PEKKs) have been synthesised by a room temperature Friedel–Crafts dispersion polymerisation, whose properties, including glass transition, melting and crystallisation temperatures, the degree of crystallinity and particle size, were readily controlled by altering the ratio of 1,3- to 1,4-units in the polymer backbone. This dispersion polymerisation process is simple to execute and capable of operation at scale, giving material of well-defined size and which is highly porous. A particular benefit to this process is the highly crystalline particulate nature of the product, and it is believed that this arises due to the in situ production of well-defined microcrystalline aluminium benzoate/chloride, which acts as a seed species for controlled polymerisation. This catalyst is highly hygroscopic in character, and this emphasises the need to run the reaction in strictly anhydrous conditions. However, it was possible to isolate this material, and evidence for its structure was obtained using a combination of solid and solution 1H, 13C and 27Al NMR spectroscopy, XPS, combustion analysis and optical microscopy.Experimental
Synthesis and characterisation of polymers30
The PEKKs were synthesised with T![[thin space (1/6-em)]](https://www.rsc.org/images/entities/char_2009.gif) :
:![[thin space (1/6-em)]](https://www.rsc.org/images/entities/char_2009.gif) I ratios determined by monomer feed as detailed in Fig. 1. A representative polymerisation procedure for PEKK with 80
I ratios determined by monomer feed as detailed in Fig. 1. A representative polymerisation procedure for PEKK with 80![[thin space (1/6-em)]](https://www.rsc.org/images/entities/char_2009.gif) :
:![[thin space (1/6-em)]](https://www.rsc.org/images/entities/char_2009.gif) 20 T
20 T![[thin space (1/6-em)]](https://www.rsc.org/images/entities/char_2009.gif) :
:![[thin space (1/6-em)]](https://www.rsc.org/images/entities/char_2009.gif) I ratio is given in Table 8.
I ratio is given in Table 8.
T![[thin space (1/6-em)]](https://www.rsc.org/images/entities/char_2009.gif) : :![[thin space (1/6-em)]](https://www.rsc.org/images/entities/char_2009.gif) I ratio I ratio |
100![[thin space (1/6-em)]](https://www.rsc.org/images/entities/char_2009.gif) : :![[thin space (1/6-em)]](https://www.rsc.org/images/entities/char_2009.gif) 0 0 |
90![[thin space (1/6-em)]](https://www.rsc.org/images/entities/char_2009.gif) : :![[thin space (1/6-em)]](https://www.rsc.org/images/entities/char_2009.gif) 10 10 |
80![[thin space (1/6-em)]](https://www.rsc.org/images/entities/char_2009.gif) : :![[thin space (1/6-em)]](https://www.rsc.org/images/entities/char_2009.gif) 20 20 |
70![[thin space (1/6-em)]](https://www.rsc.org/images/entities/char_2009.gif) : :![[thin space (1/6-em)]](https://www.rsc.org/images/entities/char_2009.gif) 30 30 |
60![[thin space (1/6-em)]](https://www.rsc.org/images/entities/char_2009.gif) : :![[thin space (1/6-em)]](https://www.rsc.org/images/entities/char_2009.gif) 40 40 |
|---|---|---|---|---|---|
| EKKE (g) | 39.0990 | 39.0748 | 38.9996 | 39.0001 | 38.9997 |
| TPC (g) | 16.3642 | 13.0354 | 9.6928 | 6.3780 | 3.0636 |
| IPC (g) | 0 | 3.3194 | 6.6302 | 9.9448 | 13.2596 |
| Benzoic acid (g) | 39.18 | 39.26 | 39.3021 | 39.3039 | 39.3024 |
| AlCl3 (g) | 105.00 | 104.53 | 107.41 | 105.18 | 105.87 |
| Benzoyl chloride (g) | 0.8253 | 0.8007 | 0.7050 | 0.7369 | 0.7055 |
| DCM (ml) | 500 | 500 | 500 | 500 | 500 |
| Polymer yield (g) | 43.92 | 42.38 | 43.76 | 46.01 | 42.95 |
| Polymer morphology | Fine particulate | Fine particulate | Fine particulate | Fine particulate | Fine particulate |
A representative PEKK polymerisation with 80![[thin space (1/6-em)]](https://www.rsc.org/images/entities/char_2009.gif) :
:![[thin space (1/6-em)]](https://www.rsc.org/images/entities/char_2009.gif) 20 T
20 T![[thin space (1/6-em)]](https://www.rsc.org/images/entities/char_2009.gif) :
:![[thin space (1/6-em)]](https://www.rsc.org/images/entities/char_2009.gif) I ratio is as follows. To a one litre reaction flask equipped with a mechanical stirrer, having been purged with dry nitrogen, was added aluminium chloride (105.18 g, 788.81 mmol) along with dichloromethane (250 ml). Stirring was maintained at 200 rpm. Having cooled the slurry to −20 °C, benzoic acid (39.304 g, 321.61 mmol) was slowly added so as not to raise the temperature of the slurry above −10 °C and to minimise any splashing up the walls of the reactor. After cooling back to −20 °C, the combined isophthaloyl chloride (9.9448 g, 48.984 mmol) and terephthaloyl chloride (6.3780 g, 31.416 mmol) was added to the slurry along with a further 100 ml of dichloromethane. Also at −20 °C, l,4-bis(4-phenoxybenzoyl)benzene (EKKE) (39.000 g, 82.887 mmol) was added with a further 100 ml of dichloromethane, which was accompanied by a colour change from yellow to orange. The remaining DCM was added, retaining a small amount (15–20 ml) for the addition of the benzoyl chloride. The stirrer speed was increased to 500 rpm. During this heating, the benzoyl chloride (0.73690 g, 5.2422 mmol), diluted in the remaining DCM, was added. The formation of particles was observed after approximately 15 minutes. The vessel was stirred at a constant rate of 500 rpm and maintained at 20 °C for four hours. The orange polymer was filtered and was added to iced water in portions with stirring, causing it to decomplex and turn white. During decomplexation, the mixture did not exceed 5 °C. The beaker was stirred occasionally over approximately ten minutes until the majority of the polymer had turned white, with some orange parts remaining. The beaker was left to stand overnight and until workup to achieve full decomplexation. Having transferred the polymer to a suitable vessel, the vessel was heated and the dichloromethane distilled off. The polymer was subsequently subjected to a workup procedure of sequential washings, consisting of hot water, aqueous acid and base stages. Polymers were dried at 80 °C for 48 hours, then at 200 °C (up to 250 °C) under vacuum overnight, and then characterised as indicated in the main text.
I ratio is as follows. To a one litre reaction flask equipped with a mechanical stirrer, having been purged with dry nitrogen, was added aluminium chloride (105.18 g, 788.81 mmol) along with dichloromethane (250 ml). Stirring was maintained at 200 rpm. Having cooled the slurry to −20 °C, benzoic acid (39.304 g, 321.61 mmol) was slowly added so as not to raise the temperature of the slurry above −10 °C and to minimise any splashing up the walls of the reactor. After cooling back to −20 °C, the combined isophthaloyl chloride (9.9448 g, 48.984 mmol) and terephthaloyl chloride (6.3780 g, 31.416 mmol) was added to the slurry along with a further 100 ml of dichloromethane. Also at −20 °C, l,4-bis(4-phenoxybenzoyl)benzene (EKKE) (39.000 g, 82.887 mmol) was added with a further 100 ml of dichloromethane, which was accompanied by a colour change from yellow to orange. The remaining DCM was added, retaining a small amount (15–20 ml) for the addition of the benzoyl chloride. The stirrer speed was increased to 500 rpm. During this heating, the benzoyl chloride (0.73690 g, 5.2422 mmol), diluted in the remaining DCM, was added. The formation of particles was observed after approximately 15 minutes. The vessel was stirred at a constant rate of 500 rpm and maintained at 20 °C for four hours. The orange polymer was filtered and was added to iced water in portions with stirring, causing it to decomplex and turn white. During decomplexation, the mixture did not exceed 5 °C. The beaker was stirred occasionally over approximately ten minutes until the majority of the polymer had turned white, with some orange parts remaining. The beaker was left to stand overnight and until workup to achieve full decomplexation. Having transferred the polymer to a suitable vessel, the vessel was heated and the dichloromethane distilled off. The polymer was subsequently subjected to a workup procedure of sequential washings, consisting of hot water, aqueous acid and base stages. Polymers were dried at 80 °C for 48 hours, then at 200 °C (up to 250 °C) under vacuum overnight, and then characterised as indicated in the main text.
Monomer characterisation
Acknowledgements
KJS gratefully acknowledges the award of an 1851 Royal Commission Industrial Fellowship.References
- L. W. McKeen, in Effect of Temperature and other Factors on Plastics and Elastomers, ed. L. W. McKeen, William Andrew Publishing, Norwich, NY, 2008 Search PubMed.
- H. J. Zimmermann and K. Könnecke, Polymer, 1991, 32, 3162–3169 CrossRef CAS.
- D. Kemmish, Update on the Technology and Applications of Polyaryletherketones, Smithers Rapra, Shawbury, 2010 Search PubMed.
- J. M. G. Cowie, Polymers: Chemistry and physics of modern materials, Blackie Academic & Professional, 2nd edn, 1991 Search PubMed.
- B. M. Marks, US Pat., 3 441 538, 1969.
- W. H. Bonner, US Pat., 3 065 205, 1962.
- J. B. Rose, US Pat., 4 396 755, 1983.
- I. Goodman, J. E. Mcintyre and W. Russell, Br. Pat., 971 227, 1964.
- I. D. H. Towle, US Pat., 4 841 013, 1989.
- R. H. Reamey, US Pat., 4 665 151, 1987.
- K. J. Dahl and V. Jansons, US Pat., 3 956 240, 1976.
- K. J. Dahl, US Pat., 4 111 908, 1978.
- J. A. Daniels and I. R. Stephenson, US Pat., 5 734 005, 199814.
- M. Shibata, R. Yosomiya, J. Z. Wang, Y. B. Zheng, W. J. Zhang and Z. W. Wu, Macromol. Rapid Commun., 1997, 18, 99–105 CrossRef CAS.
- T. E. Attwood, P. C. Dawson, J. L. Freeman, L. R. J. Hoy, J. B. Rose and P. A. Staniland, Polymer, 1981, 22, 1096–1103 CrossRef CAS.
- J. B. Rose, and P. A. Staniland, US Pat., 4 320 224, 1982.
- D. R. Rueda, M. G. Zolotukhin, M. E. Cagiao, F. Ania, M. Dosiere, D. Villers and J. de Abajo, J. Macromol. Sci., Part B: Phys., 2001, B40, 709–731 CrossRef CAS.
- D. R. Rueda, M. G. Zolotukhin, M. E. Cagiao, F. J. B. Calleja, D. Villers and M. Dosiere, Macromolecules, 1996, 29, 7016–7021 CrossRef CAS.
- M. G. Zolotukhin, F. J. B. Calleja, D. R. Rueda and J. M. Palacios, Acta Polym., 1997, 48, 269–273 CrossRef CAS.
- M. G. Zolotukhin, H. M. Colquhoun, L. G. Sestiaa, D. J. Williams, D. R. Rueda and D. Flot, Polymer, 2004, 45, 783–790 CrossRef CAS.
- M. G. Zolotukhin, D. R. Rueda, M. Bruix, M. E. Cagiao, F. J. B. Calleja, A. Bulai, N. G. Gileva and L. VanderElst, Polymer, 1997, 38, 3441–3453 CrossRef CAS.
- M. G. Zolotukhin, D. R. Rueda, F. J. B. Calleja, M. Bruix and M. E. Cagiao, Macromol. Chem. Phys., 1997, 198, 1131–1146 CrossRef CAS.
- M. G. Zolotukhin, D. R. Rueda, F. J. B. Callejat, M. E. Cagiao, M. Bruix, E. A. Sedova and N. G. Gileva, Polymer, 1995, 36, 3575–3583 CrossRef CAS.
- M. G. Zolotukhin, D. R. Rueda, F. J. B. Callejat, M. E. Cagiao, M. Bruix, E. A. Sedova and N. G. Gileva, Polymer, 1997, 38, 1471–1476 CrossRef CAS.
- V. Jansons and C. Gors, US Pat., 4 709 007, 1987.
- K. J. Smith and I. D. H. Towle, Br. Pat., 1415972.7, 2014.
- K. J. Smith and I. D. H. Towle, Br. Pat., 1409127.6, 2014.
- K. J. Smith and I. D. H. Towle, Br. Pat., 1409126.8, 2014.
- K. Smith, in Encyclopedia of Polymeric Nanomaterials, ed. S. Kobayashi and K. Müllen, Springer, Berlin Heidelberg, 2015, ch. 414-1, pp. 1–6, DOI:10.1007/978-3-642-36199-9.
- I. D. H. Towle, Br. Pat., WO 2011/004164 A2, 2011.
- P. J. Horner and R. H. Whiteley, J. Mater. Chem., 1991, 1, 271–280 RSC.
- C. J. Borrill and R. H. Whiteley, J. Mater. Chem., 1991, 1, 655–661 RSC.
- C. J. Borrill and R. H. Whiteley, J. Mater. Chem., 1992, 2, 997–1001 RSC.
- K. J. Dahl, P. J. Horner, H. C. Gors, V. Jansons and R. H. Whiteley, US Pat., 4 868 271, 1989.
- M. T. Bishop, F. E. Karasz, P. S. Russo and K. H. Langley, Macromolecules, 1985, 18, 86–93 CrossRef CAS.
- J. W. Akitt and B. E. Mann, NMR and Chemistry: An Introduction to Modern NMR Spectroscopy, CRC Press, 4th edn, 2000 Search PubMed.
- K. H. Gardner, B. S. Hsiao, R. R. Matheson and B. A. Wood, Polymer, 1992, 33, 2483–2495 CrossRef CAS.
- P. C. Dawson and D. J. Blundell, Polymer, 1980, 21, 577–578 CrossRef CAS.
- I. D. H. Towle, personal communication.
- "Cytec Engineered Materials PEKK Thermoplastic Polymer Technical Data Sheet", Cytec Engineered Materials, 2012 Search PubMed.
- R. M. Silverstein, F. X. Webster and D. J. Kiemle, Spectrometric Identification of Organic Compounds, John Wiley & Sons, Inc., 7th edn, 2005 Search PubMed.
- W. Lewandowski, Arch. Environ. Contam. Toxicol., 1988, 17, 131–138 CrossRef CAS.
- J. E. H. Buston, T. D. W. Claridge, S. J. Heyes, M. A. Leech, M. G. Moloney, K. Prout and M. Stevenson, Dalton Trans., 2005, 3195–3203 RSC.
- L. Sun, US Pat., 5 912 292, 1999.
- H. N. Beck, J. Appl. Polym. Sci., 1967, 11, 673-& Search PubMed.
- M. Wales, US Pat., 3 207 737, 1965.
- D. R. Corbin and E. Kumpinsky, US Pat., 4 918 237, 1990.
- T. M. Ford, E. Greenville, E. Kumpinsky and A. Vidal, US Pat., US4918237 1990.
Footnote |
| † Electronic supplementary information (ESI) available. See DOI: 10.1039/c5ra25253a |
| This journal is © The Royal Society of Chemistry 2016 |


