CdSe (quantum dots)–graphene oxide system for thiophene polymerization: a new strategy, a new material†
Edina Rusen*a,
Aurel Diacona,
Alexandra Mocanua,
Raluca Gavrilăb,
Leona Cristina Nistorc and
Adrian Dinescub
aUniversity Politehnica of Bucharest, Department of Bioresources and Polymer Science, 1-7 Gh. Polizu Street, 011061 Bucharest, Romania. E-mail: Edina_rusen@yahoo.com; Tel: +40 021 402 2711
bNational Institute for Research and Development in Microtechnologies (IMT-Bucharest), 126 A, Erou Iancu Nicolae Street, P.O. Box 38-160, 023573 Bucharest, Romania
cNational Institute of Materials Physics, 105 bis Atomistilor, 077125 Magurele-Ilfov, Romania
First published on 22nd February 2016
Abstract
This study presents a novel method for the oxidative polymerization of thiophene (T) by employing cadmium selenide (CdSe) quantum dots and CdSe–graphene oxide (GO) as activators of the polymerization system. The polymerization initiation mechanism is based on the difference between the HOMO–LUMO energy levels of the components, which permits the formation of a donor–acceptor exchange. Thus, T should act both as acceptor and donor for a component with suitable HOMO–LUMO energy levels. We have investigated the polymerization reaction evolution as well as the molecular weights of the obtained polymers. The resulting materials containing PT, CdSe quantum dots and GO have been characterized by FTIR, UV-vis, fluorescence, HRTEM, conductivity and AFM analyses.
Due to its electroconductive properties,1 polythiophene (PT) has been one of the most intensely studied polymers for numerous applications. PT has been widely used in environmentally and thermally stable conjugated polymer based devices, such as chemical and optical sensors,2–4 light-emitting diodes and displays,5 photovoltaic cells,6,7 DNA detection,8 polymer electronic interconnects9 and transistors.10
The development of organic/inorganic hybrid systems3,11,12 constitutes a new strategy for the improvement of future generation solar cells, new device technologies, and a platform to study the dimensional morphology.13 A multitude of concepts have been demonstrated by combining p-type donor polymers with n-type acceptor nanostructures such as CdSe,13 TiO2 and ZnO14–16, carbon nanotubes,17 fullerene,17 graphene18 and graphene oxide.19 These materials may present several advantages compared to the pure polymers, such as enhanced conductivity.20
This study presents the synthesis of a novel hybrid material containing PT–CdSe and GO through a single polymerization step. At present, three techniques are employed for the polymerization of thiophene: electropolymerization,21 metal-catalyzed coupling reactions and chemical oxidative polymerization,22 each with specific advantages and disadvantages.23,24
The novelty of this paper consists in the synthesis of a novel nano-composite material with outstanding properties through the use of an original T polymerization technique. Thus, PT was obtained through an oxidative polymerization using CdSe and CdSe–GO as activators for the polymerization process. This straightforward approach allows the facile synthesis of novel hybrid materials with improved electrical conductivity.
Materials and characterization
Materials
Thiophene (T) (Aldrich) and graphene oxide (GO) (Aldrich) has been used as received.Methods
CdSe-quantum dots (3 nm) have been prepared according to our paper.25Polymerization procedure PT–CdSe: in 5 mL of CdSe solution (0.04 mol L−1), (with or without 0.1 mL GO (2 mg mL−1)) and 0.5 mL T (1 mol L−1) were added at room temperature under stirring. The reaction mixture was irradiated with a 40 W UV lamp (254 nm). The polymers were recovered by precipitation in methanol.
Characterizations
The UV-vis spectra were recorded using a Jasco V-550 spectrophotometer equipped with a temperature controlling unit.The fluorescence spectra were registered using a FP-6500 Able Jasco spectrofluorimeter.
The molecular weights of the resulted polymers and oligomers were analyzed using PL-GPC 50 integrated GPC/SEC system (Agilent Technologies) using 1 mL min−1 THF flow rate and a column oven temperature of 50 °C.
The infrared absorption spectra have been recorded at room temperature with a Nicolet 6700 FTIR spectrometer in the range of 4000–400 cm−1.
The high resolution transmission electron microscopy (HRTEM) studies were performed on an atomic resolution analytical JEOL JEM-ARM 200F electron microscope, operating at 200 kV. Specimens for HRTEM were prepared in the following way: a drop of the solution was put on holey carbon TEM grid and dried at 100 °C for 5 min.
The AFM images of the surface morphology were obtained using a SPMNtegra Aura (NT-MDT) equipment operated in the intermittent-contact mode. For the measurements a Si cantilever was used with an elasticity constant of 3.5 N m−1 and a resonance frequency of 140 Hz, HA_NC (NT-MDT) type.
White light interferometer (WLI) – photomap 3D (Fogale Nanotech, France) was used for film thickness determination.
Electrical measurements have been carried out using a KEITHLEY 4200SCS semiconductor characterization system provided with a SUSS EP6 Manual Analytical Probe Station. The I–V curve and resistance measurements have been acquired using a two-point electrical measurement technique. Electrodes prepared from soft and flexible copper foil were pressed and tightly clamped in a parallel configuration onto the glass slide supporting the film. Different types of foil and clamping systems have been tested in order to provide the best electrical contact.
Results
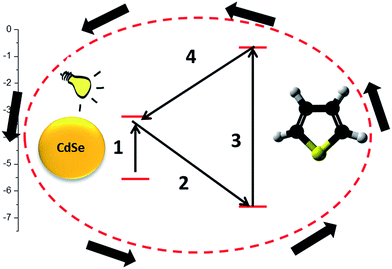
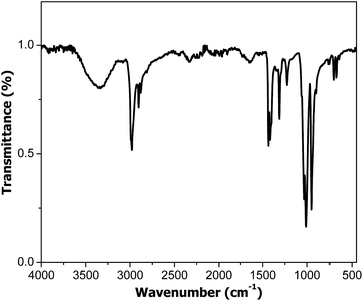
The study presents T polymerization through a cyclic oxidative mechanism achieved by photoinduced electron transfer processes between the monomer and the photoinitiator component. For this reason, T should act both as acceptor (step 2 of Scheme 1) and as donor (step 4 of Scheme 1). Thus, the HOMO energy value of T must be lower than the second component, whereas its LUMO level should be higher. In this case, the excited component would transfer an electron to the HOMO level of T while the oxidized component would be reduced by an electron from a neutral T LUMO level. The oxidized T species would then interact with another neutral monomer molecule and initiate polymerization. The electron exchange sequence would thus be continuous until the total polymerization of the monomer (Scheme 1). In our first approach, the chosen second component was CdSe quantum dots, with a particle size of around 3 nm, because it presents suitable energy levels (HOMO −5.6 eV and LUMO −3.4 eV)26 in relation to T (HOMO −6.66 eV and LUMO −0.66 eV).27 As expected, the experiments realized in the absence of the CdSe quantum dots particles did not reveal any polymerization process taking place.The mixture of T and CdSe was subjected to polymerization at room temperature in the presence of UV radiation. The successful synthesis of PT was demonstrated by FTIR and GPC analyses. The FTIR spectrum (Fig. 1) displays the (C–H) stretching vibration band at 2923 cm−1; (C![[double bond, length as m-dash]](https://www.rsc.org/images/entities/char_e001.gif) C) stretching band at 1458–1596 cm−1; (C–H) in plane bending band at 1113 cm−1 and (C–S) bending band at 749 cm−1 confirming the PT structure. The conversion after 5 h reaction time was around 5%, indicating a slow polymerization rate.
C) stretching band at 1458–1596 cm−1; (C–H) in plane bending band at 1113 cm−1 and (C–S) bending band at 749 cm−1 confirming the PT structure. The conversion after 5 h reaction time was around 5%, indicating a slow polymerization rate.
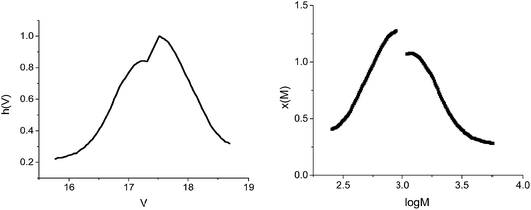
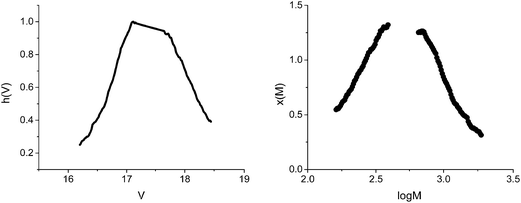
The GPC analysis was performed on the polymer and the results were processed according to Gavrilov et al.28 (Fig. 2 and Table 1).
| Peak | Mn | Mw | D |
|---|---|---|---|
| Peak 1 | 1833 | 2220 | 1.211 |
| Peak 2 | 511 | 574 | 1.123 |
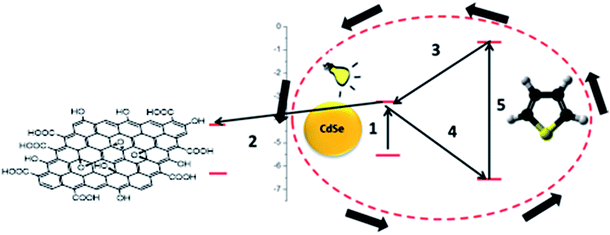
In order to increase the reaction rate, CdSe should present an increased electron deficiency (i.e. holes, possibly generated prior to the addition of T). Consequently, a faster electron transfer from T would ensure a faster polymerization. An ideal candidate for this purpose is GO, an excellent electron accepting species. Moreover, hybrid conductive materials could be obtained by using GO. The reaction stages would be modified as presented in Scheme 2.
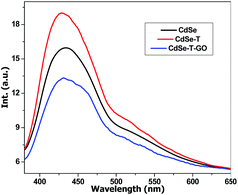
Fluorescence spectroscopy was employed to study the donor–acceptor system and highlight the polymerization initiation process. Fig. 3 presents the emission of CdSe initial quantum dots dispersion, CdSe in the presence of T, and CdSe in the presence of T and GO. The addition of T causes the amplification of CdSe emission which can be attributed to a better dispersion of the quantum dots29 as a result of the interaction with T. This suggests that part of T is adsorbed at the surface of the nanoparticles. The introduction of GO leads to a decrease of the CdSe emission. This is caused by an electron transfer from CdSe to GO, confirming the electron accepting capacity of GO towards the CdSe quantum dots. Moreover, the decrease of the emission intensity is correlated with the reduction of the CdSe/GO ratio (see ESI Fig. S1†). This first fact together with the demonstrated increased efficiency of T polymerization in the presence of GO would supports the polymerization sequence presented in Scheme 2.
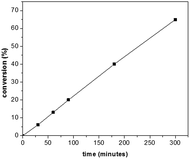
In order to further confirm the polymerization course presented in Scheme 2 (i.e. the increased polymerization efficiency in the presence of GO), polymerization process kinetics was analysed. For this reason, a series of polymerizations, at room temperature (using the UV light source) was performed, investigating the dependence of the conversion with respect to the reaction time. The same experimental conditions as in the synthesis of PT–CdSe were used. The evolution of the conversion vs. time is presented in Fig. 4.
From Fig. 4, it can be observed that the conversion after 4 h approaches 40%, in contrast with the 5% value obtained in the absence of GO. The increase of the polymerization rate and the spectral analyses (Fig. 3) also support the polymerization sequence presented in Scheme 2. The PT specimens were further characterized by GPC analysis (Fig. 5 and Table 2). The molecular weight increases with the conversion in the 1600–1900 g mol−1 range, whereas the dispersity value is in all cases close to unity. This aspect indicates the existence of a step growth polymerization process following a pseudo-living mechanism (see ESI Fig. S2†).
| Peak | Mn | Mw | D |
|---|---|---|---|
| Peak 1 | 1823 | 1968 | 1.08 |
| Peak 2 | 527 | 557 | 1.057 |
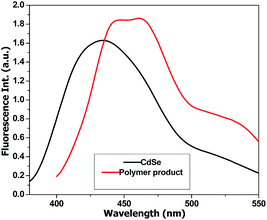
A second peak with a constant molecular weight around 511–550 g mol−1 can be distinguished in all PT samples. This signal can be attributed to the hexamer of T (6T). According to literature data, 6T is a stable species30 that is formed through the dimerization of the trimer (3T).31 In order to confirm this species, the obtained polymers were separated from the reaction mixture, dissolved in THF and analysed by fluorescence spectroscopy (Fig. 6).
The emission spectrum of the polymer-CdSe hybrid material was compared with the CdSe dispersion in order to identify the contribution of PT. In the case of the quantum dots we notice an emission at 420 nm and 520 nm for an excitation wavelength of 370 nm, while the polymer presents 445 nm, 465 nm and 510–540 nm emission peaks for the same excitation wavelength. The emission at 510–540 nm can be associated with 6T species, based on literature.30 The fluorescence spectra and the GPC analysis data highlight the formation of the hexamer species together with higher molecular weight compounds.
FTIR analysis was employed in order to further characterize the GO/PT composite. In addition to the characteristic bands for PT, the signals at 1725 cm−1 (C![[double bond, length as m-dash]](https://www.rsc.org/images/entities/char_e001.gif) O stretching), 1630 cm−1 (deformation of O–H bonds) and 1060 cm−1 (C–O of epoxy group) and 3300–3600 cm−1 (hydrogen bonds) can be noticed, indicating the presence of GO (see ESI Fig. S3†).
O stretching), 1630 cm−1 (deformation of O–H bonds) and 1060 cm−1 (C–O of epoxy group) and 3300–3600 cm−1 (hydrogen bonds) can be noticed, indicating the presence of GO (see ESI Fig. S3†).
The morphology and structure of the hybrid material (PT + CdSe + GO) has been investigated by HRTEM on specimens dried holey amorphous carbon grids. Fig. 7 reveals the general aspect of this composite material. The amorphous PT compound with an irregular edge morphology covers the other two components of the specimen. The GO, amorphous too, has the expected plate-like morphology. In contact with the GO and PT some nanoparticles (NPs) indicated by white arrows are visible. The corresponding electron diffraction (ED) pattern selected on the area containing these NPs (inset) is indexed with the cubic CdSe structure. It can be easily observed that the GO is in direct contact with the CdSe NPs which would sustain the formation of a donor–acceptor system for the initiation of the polymerization reaction. It is worth mentioning that the CdSe NPs are always accompanied by PT (see Fig. S2†). Therefore, CdSe NPs are in direct contact with both PT and GO, which determines an easier electron transfer from one component to the other.
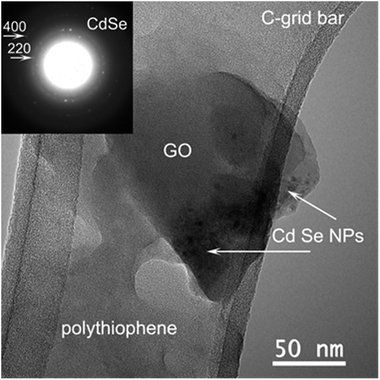 | ||
| Fig. 7 TEM image of the PT + CdSe + GO hybrid material; the inset shows the corresponding ED pattern. | ||
The electrical conductivity of the materials, i.e. the I–V curves and resistance measurements have been performed using a two-point electrical measurement technique (see ESI Fig. S5†).
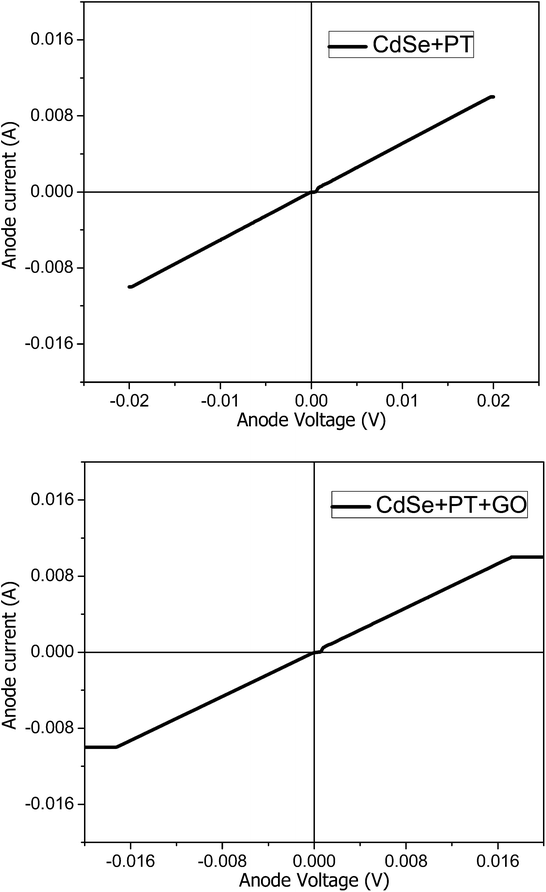
The experimentally acquired current–voltage (I–V) curves exhibits a perfect linear behaviour on the whole measurement range (Fig. 8). The film thickness has been estimated from AFM and WLI measurements on selectively scraped areas. The material conductivity could be inferred from the slope of the I–V curves (the resistance of the film sector enclosed between the two electrodes) and the film thickness.
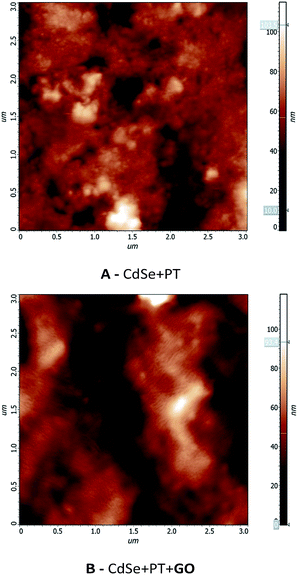
The values presented in Table 3 reveal a higher conductivity for the material obtained in the absence of GO. The increased conductivity could be attributed to a higher degree of order at the molecular level for this material. Nevertheless, the conductivity values in both cases are significantly higher than previously reported PT materials.19,20 The samples were investigated by AFM in order to gain more information on the molecular order degree (Fig. 9). A higher ordering can be observed for CdSe + PT than for CdSe + PT + GO, thus explaining the difference in electric conductivity.
| CdSe + PT | CdSe + PT + GO | ||
|---|---|---|---|
| Film thickness (nm) | Conductivity (S cm−1) | Film thickness (nm) | Conductivity (S cm−1) |
| 100 | 1.5 × 10⁴ | 1500 | 1.06 × 10³ |
| 1000 | 1.5 × 10³ | 2000 | 1.4 × 10³ |
Conclusions
This study presents thiophene polymerization through a cyclic oxidative mechanism accomplished by photoinduced electron transfer processes between the components. For this reason, T should act both as acceptor and as donor for a component with suitable HOMO–LUMO energy levels. The polymerization was initiated using CdSe and CdSe–GO. The polymerization reaction evolution and the molecular weights of the obtained polymers have been characterized through GPC analysis. In all cases the formation of the polymer is accompanied by the formation of stable 6T species. The donor–acceptor system has been investigated by fluorescence spectroscopy confirming the formation of the 6T intermediate product. The obtained materials have been characterized by FTIR, UV-vis, fluorescence, HRTEM and AFM analyses. The direct contact between CdSe and GO was confirmed by HRTEM confirming the formation of the donor–acceptor system necessary for the polymerization initiation step. The highest conductivity of the material was estimated at 1.5 × 10⁴ (S cm−1) for a film of CdSe + PT with 100 nm thickness.Acknowledgements
Aurel Diacon and Alexandra Mocanu acknowledge financial support from the Sectoral Operational Programme Human Resources Development 2007–2013 of the Ministry of European Funds through the Financial Agreement POSDRU/159/1.5/S/132395 and POSDRU/159/1.5/S/132397.References
- A. O. Patil, A. J. Heeger and F. Wudl, Chem. Rev., 1988, 88, 183–200 CrossRef CAS.
- B. Li, S. Santhanam, L. Schultz, M. Jeffries-El, M. C. Iovu, G. Sauvé, J. Cooper, R. Zhang, J. C. Revelli, A. G. Kusne, J. L. Snyder, T. Kowalewski, L. E. Weiss, R. D. McCullough, G. K. Fedder and D. N. Lambeth, Sens. Actuators, B, 2007, 123, 651–660 CrossRef CAS.
- S. Wang, Y. Kang, L. Wang, H. Zhang, Y. Wang and Y. Wang, Sens. Actuators, B, 2013, 182, 467–481 CrossRef CAS.
- C. Zanardi, F. Terzi and R. Seeber, Anal. Bioanal. Chem., 2013, 405, 509–531 CrossRef CAS PubMed.
- I. F. Perepichka, D. F. Perepichka, H. Meng and F. Wudl, Adv. Mater., 2005, 17, 2281–2305 CrossRef CAS.
- S. Yanagida, G. K. R. Senadeera, K. Nakamura, T. Kitamura and Y. Wada, J. Photochem. Photobiol., A, 2004, 166, 75–80 CrossRef CAS.
- G. Dennler, M. C. Scharber and C. J. Brabec, Adv. Mater., 2009, 21, 1323–1338 CrossRef CAS.
- H.-A. Ho, A. Najari and M. Leclerc, Acc. Chem. Res., 2008, 41, 168–178 CrossRef CAS PubMed.
- C. L. Curtis, J. E. Ritchie and M. J. Sailor, Science, 1993, 262, 2014–2016 CAS.
- C. B. Nielsen and I. McCulloch, Prog. Polym. Sci., 2013, 38, 2053–2069 CrossRef CAS.
- P. Gómez-Romero, O. Ayyad, J. Suárez-Guevara and D. Muñoz-Rojas, J. Solid State Electrochem., 2010, 14, 1939–1945 CrossRef.
- R.-A. Mitran, D. Berger, L. Băjenaru, S. Năstase, C. Andronescu and C. Matei, Cent. Eur. J. Chem., 2014, 12, 788–795 CrossRef CAS.
- J. Liu, T. Tanaka, K. Sivula, A. P. Alivisatos and J. M. J. Fréchet, J. Am. Chem. Soc., 2004, 126, 6550–6551 CrossRef CAS PubMed.
- L. E. Greene, M. Law, B. D. Yuhas and P. Yang, J. Phys. Chem. C, 2007, 111, 18451–18456 CAS.
- M. Law, L. E. Greene, J. C. Johnson, R. Saykally and P. Yang, Nat. Mater., 2005, 4, 455–459 CrossRef CAS PubMed.
- A. L. Briseno, T. W. Holcombe, A. I. Boukai, E. C. Garnett, S. W. Shelton, J. J. M. Fréchet and P. Yang, Nano Lett., 2010, 10, 334–340 CrossRef CAS PubMed.
- C. Wang, Z.-X. Guo, S. Fu, W. Wu and D. Zhu, Prog. Polym. Sci., 2004, 29, 1079–1141 CrossRef CAS.
- J. Zhao, Y. Xie, Z. Le, J. Yu, Y. Gao, R. Zhong, Y. Qin and Y. Huang, Synth. Met., 2013, 181, 110–116 CrossRef CAS.
- C. Bora, R. Pegu, B. J. Saikia and S. K. Dolui, Polym. Int., 2014, 63, 2061–2067 CrossRef CAS.
- M. Culebras, C. Gómez and A. Cantarero, Materials, 2014, 7, 6701 CrossRef.
- J. Roncali, J. Mater. Chem., 1999, 9, 1875–1893 RSC.
- K. Yoshino, S. Hayashi and R.-I. Sugimoto, Jpn. J. Appl. Phys., Part 2, 1984, 23, L899 CrossRef.
- R. D. McCullough, Adv. Mater., 1998, 10, 93–116 CrossRef CAS.
- T. A. Skotheim, Handbook of Conducting Polymers, Taylor & Francis, 2nd edn, 1997 Search PubMed.
- E. Rusen, A. Mocanu, L. C. Nistor, P. Hudhomme and A. Diacon, RSC Adv., 2015, 5, 28228–28232 RSC.
- J. N. de Freitas, I. R. Grova, L. C. Akcelrud, E. Arici, N. S. Sariciftci and A. F. Nogueira, J. Mater. Chem., 2010, 20, 4845–4853 RSC.
- M. Wykes, B. Milián-Medina and J. Gierschner, Front. Chem., 2013, 1, 1–12 CAS.
- M. Gavrilov and M. J. Monteiro, Eur. Polym. J., 2015, 65, 191–196 CrossRef CAS.
- L.-Y. Chen, H.-L. Chou, C.-H. Chen and C.-H. Tseng, Nanocryst.: Synth., Charact. Appl., 2012, 149 Search PubMed.
- A. B. Nepomnyashchii, R. J. Ono, D. M. Lyons, C. W. Bielawski, J. L. Sessler and A. J. Bard, Chem. Sci., 2012, 3, 2628–2638 RSC.
- V. Wintgens, P. Valat and F. Garnier, J. Phys. Chem., 1994, 98, 228–232 CrossRef CAS.
Footnote |
| † Electronic supplementary information (ESI) available: Containing: fluorescence emission modification depending on CdSe/GO ratio, GPC analysis for species after 100 min reaction time, FTIR for obtained in the presence of GO, experimental set-up for determining electrical conductivity. See DOI: 10.1039/c6ra00274a |
| This journal is © The Royal Society of Chemistry 2016 |

