Investigation of the promotion effect of WO3 on the decomposition and reactivity of NH4HSO4 with NO on V2O5–WO3/TiO2 SCR catalysts†
Dong Ye,
Ruiyang Qu,
Hao Song,
Chenghang Zheng,
Xiang Gao*,
Zhongyang Luo,
Mingjiang Ni and
Kefa Cen
State Key Laboratory of Clean Energy Utilization, Department of Energy Engineering, Zhejiang University, Hangzhou, 310027, China. E-mail: xgao1@zju.edu.cn; Tel: +86 571 87951335
First published on 3rd June 2016
Abstract
In this study, we systematically investigated the interaction between NH4HSO4 and WO3-promoted V2O5/TiO2 catalysts in the selective catalytic reduction of NO with NH3, along with the promotion effect of WO3 on the decomposition and reactivity of NH4HSO4 with NO. In the NH4HSO4-deposited samples, WO3 addition increased the electron cloud density around the S atoms in SO42−, which was beneficial for the reduction of S atoms with +6 formal oxidation number, as in NH4HSO4, to those in the +4 oxidation state, as in SO2. Consequently, WO3-doping led to an increase in the amount of SO2 released at low-temperature regions during the heating process as well as an obvious enhancement in the decomposition behavior of NH4HSO4, as illustrated by decreases in temperatures attributed to the weight loss peaks. Meanwhile, the introduced WO3 had a slight promotion effect on the reactivity of NH4HSO4 with NO, together with an inhibitory effect on the production of N2O during the reaction process. Finally, WO3-promoted catalysts exhibited enhanced SO2-resistance.
1. Introduction
The selective catalytic reduction of NO with NH3 has been proved to be a mature technology for NOx removal.1 Recently, developing low-temperature SCR systems is significant, because flue gas becomes much cleaner after passing through desulfurized and particulate control devices, which could protect catalysts from being deactivated by high concentrations of ash and SO2 in the flue gas, thereby prolonging the catalyst lifespan. Several types of low-temperature SCR catalysts, which exhibit excellent SCR activity in the temperature region of 100–300 °C, have been developed.2–5 However, certain amount of SO2 and H2O in the flue gas leads to the deposition of NH4HSO4 on the catalysts, which adversely affects the SCR reaction; formation of that product is the main barrier to the commercialization of low-temperature SCR systems.6 Therefore, investigating the key factor in the NH4HSO4 decomposition and reactivity behaviors on the catalysts constitutes the vital step in industrializing low-temperature SCR systems.Our previous study7 has investigated the decomposition and reactivity of the main poisoner, NH4HSO4, on the V2O5/TiO2 catalysts and claimed that V2O5/TiO2 catalysts promote the decomposition and reactivity behaviors of NH4HSO4 with NO. And crystallite ammonium sulfate salts are more stubborn than amorphous salts. Therefore, it seems that the best way to protect catalysts from being deactivated by the deposition of NH4HSO4 is to promote the NH4HSO4 decomposition and reactivity behaviors to avoid the formation of crystallite ammonium sulfate salts on the catalysts, on which scanty research has been conducted, even though V2O5/TiO2 catalyst system is typically used for stationary applications. By contrast, Liu et al.8–11 found NH4HSO4 decomposes and reacts with NO more easily on the V2O5/activated carbon (V/AC) catalysts than on the V2O5/TiO2 catalysts. Interaction between AC and V2O5 is considered to be the main reason for the enhanced NH4HSO4 decomposition and reactivity behaviors on the AC-based catalysts. Knowledge of such effects lays a solid foundation for developing novel catalysts with superior activity and sulfur resistance, even if variations in the physicochemical properties between TiO2 and AC exist.
The typical promoter for V2O5/TiO2 catalysts is the metal oxide WO3, which is widely applied in industrial catalysts. For the behaviors of NH4HSO4 on the WO3-promoted catalysts, Baltin12 claimed that NH4HSO4 formed on the V2O5–WO3/TiO2 catalysts during SCR reactions can react with NO to produce H2SO4 at 170 °C. However, some crucial aspects of the NH4HSO4 behaviors on the WO3-promoted catalysts still lack investigation. (a) It is clear that WO3 addition would decrease the catalyst surface area due to partial plugging of the pore structures,13 which might cause the appearance of crystallite ammonium sulfate salts, thereby inhibiting the NH4HSO4 decomposition and reactivity behaviors to some extent. (b) It has been proved that SO42− are only bonded to the TiO2 surface instead of the V2O5 surface in the NH4HSO4-deposited V2O5/TiO2 samples.7 For WO3-promoted catalysts, SO42− might be also linked to the WO3 surface, because of the high W content in the V2O5–WO3/TiO2 catalysts (WO3 content: ca. 5%). Thus, variations in the NH4HSO4 decomposition and reactivity behaviors would be expected to occur. (c) Provided that NH4HSO4 exist in the amorphous state on the WO3-promoted catalysts and SO42− are only bonded to TiO2 sites rather than WO3 sites, WO3-doping might have a positive effect on the decomposition and reactivity of NH4HSO4 with NO, for WO3-promoted catalysts exhibit an enhanced SO2-resistant ability at lower temperatures.14,15 In this study, attention was focused on the interaction between NH4HSO4 and WO3-promoted catalysts, together with the effect of WO3 on the decomposition and reactivity of NH4HSO4 with NO.
For the purposes above, NH4HSO4 was deposited on V2O5/TiO2 and V2O5–WO3/TiO2 catalysts. As a reference, NH4HSO4-deposited TiO2 and WO3/TiO2 samples were also adopted. X-ray diffraction (XRD), Fourier transform infrared spectroscopy (FTIR), and X-ray photoelectron spectroscopy (XPS) were performed to explore the interaction between NH4HSO4 and catalysts. Temperature-programmed methods were applied to study the promotion effect of WO3 on the NH4HSO4 decomposition and reactivity behaviors. Finally, catalyst sulfur resistance tests were conducted to illustrate the improved NH4HSO4 decomposition and reactivity behaviors could protect catalysts from being deactivated by the excess deposition of NH4HSO4, which leads to an enhanced catalyst SO2-resistant ability.
2. Experimental
2.1 Chemicals
P25 (85%: anatase, 15%: rutile; SBET = ca. 55 m2 g−1) was purchased from Degussa. NH4VO3 (AR: 99.0%), H40N10O41W12·xH2O (AR, WO3 content: 85–90%) and NH4HSO4 (AR, H2SO4 content: 41.5–43.5%) were available from Sinopharm Chemical Reagent Co., Ltd. N2, O2 and NO (0.5% NO + 99.5% N2) were obtained from Hangzhou New Century Mixed Gas Co., Ltd.2.2 Preparation of the samples
According to the formula of commercial SCR catalysts (V2O5 content: 1 wt%, WO3 content: 5, 6.5, 8 wt%), V2O5–WO3/TiO2 (denoted as VW/Ti) catalyst in this study was prepared through the wet impregnation method using the mixture of ammonium metavanadate–oxalic and ammonium tungsate–oxalic solutions. As for the preparation of TiO2, WO3/TiO2 and V2O5/TiO2 (denoted as Ti, W/Ti, V/Ti) catalysts, the same procedures were adopted, except that the mixture of ammonium metavanadate–oxalic and ammonium tungstate–oxalic solutions was replaced by deionized water, ammonium tungsate–oxalic solution and metavanadate–oxalic solution, respectively. All of the prepared samples were dried at 110 °C overnight and calcined at 500 °C for 5 h. The as-prepared catalyst was crushed and sieved into 100 mesh for NH4HSO4 deposition.The NH4HSO4-deposited samples were prepared using a previously reported wet impregnation method.8 The samples were named according to the Ti-based catalysts. For example, ABS-VW/Ti means that NH4HSO4 was deposited on the VW/Ti (WO3 content: 5 wt%) catalyst surface; ABS-VW8/Ti is related to the sample containing 8 wt% WO3 and 10 wt% NH4HSO4, respectively. All of the samples were dried at 110 °C in air overnight. The as-prepared samples were crushed and sieved to 40–60 mesh for temperature-programmed decomposition (TPDC) and temperature-programmed surface reaction (TPSR).
2.3 Reaction systems
Generally, 0.3 g catalyst was used in the sulfur resistance tests at 250 °C. The reaction conditions were as follows: 1000 ppm NO, 1000 ppm NH3, 5% O2, 1000 ppm SO2, 10% H2O, and N2 as balance gas. The total gas flow rate was 1.2 L min−1, corresponding to a gas hourly space velocity (GHSV) of 240![[thin space (1/6-em)]](https://www.rsc.org/images/entities/char_2009.gif) 000 mL g−1 h−1. The NO and NOx concentrations were monitored online by a gas analyzer (Testo 350). The NOx conversion was calculated according to the following equation:
000 mL g−1 h−1. The NO and NOx concentrations were monitored online by a gas analyzer (Testo 350). The NOx conversion was calculated according to the following equation:| NOx conversion (%) = ([NOx]out/[NOx]in) × 100% | (1) |
The relative activity X/X0, where X is the NOx conversion at a certain time in the deactivation process and X0 is the initial NOx conversion for fresh catalysts, was calculated to diagnose the degree of catalyst deactivation resulting from the introduction of SO2 and H2O.
TPDC method was conducted in the reaction systems. Briefly, an NH4HSO4-deposited sample of 0.3 g was preheated to 100 °C in N2 for 30 min in order to remove the physically adsorbed water and other impurities. The sample was then heated to 450 °C at a heating rate of 5 °C min−1 in N2. The outlet SO2 signal, which was used to identify the thermal stability of sulfate species, was monitored using an FTIR flue gas spectrometer (Gasmet, gx4000).
The NH4HSO4 reactivity behavior on the Ti-based catalysts was measured via TPSR with NO. First, 0.4 g or 0.3 g NH4HSO4-deposited catalyst (40–60 mesh) was exposed to a stream containing 1000 ppm NO, 3% O2 and balance N2 at a flow rate of 1.2 L min−1 or 0.5 L min−1, corresponding to a GHSV of 180![[thin space (1/6-em)]](https://www.rsc.org/images/entities/char_2009.gif) 000 mL g−1 h−1 or 100
000 mL g−1 h−1 or 100![[thin space (1/6-em)]](https://www.rsc.org/images/entities/char_2009.gif) 000 mL g−1 h−1, respectively. Then the temperature was ramped from 100 °C to 450 °C at a heating rate of 5 °C min−1. The inlet and outlet concentrations of NO and N2O were monitored using an FTIR spectrometer (Gasmet, gx4000).
000 mL g−1 h−1, respectively. Then the temperature was ramped from 100 °C to 450 °C at a heating rate of 5 °C min−1. The inlet and outlet concentrations of NO and N2O were monitored using an FTIR spectrometer (Gasmet, gx4000).
The reaction rate constant k was calculated according to previous study of Baltin.12 As the change of the concentration of the second reaction partner, NH3, during a single measuring operation (about 5 seconds) is differentially small for every experimental value, the pseudo-first order reaction rate constant k can be calculated using the following equation:
 | (2) |
2.4 Characterizations of the samples
The XRD patterns were recorded using an X-ray diffractometer (RIGAKU D/MAX 2550, Japan), which was equipped with Cu Kα radiation at 40 kV and 100 mA, at a step size of 0.0167° in the 2θ range of 10–80°. N and S elemental analysis was measured on an elemental analyzer (EA1112, Italy).XPS spectra were obtained with a Thermo ESCALAB 250 electron spectrometer, which was equipped with an Al Kα X-ray source and a hemispherical electron analyzer. The binding energy of C 1s was calibrated to 284.5 eV.
FTIR was conducted using a Nicolet 6700 spectrometer. The sample-KBr mixtures in a mass ratio of 1![[thin space (1/6-em)]](https://www.rsc.org/images/entities/char_2009.gif) :
:![[thin space (1/6-em)]](https://www.rsc.org/images/entities/char_2009.gif) 50 were ground. The spectrum was collected 32 times, followed by the automatic subtraction of the background line obtained. The spectra were recorded from 4000 to 400 cm−1.
50 were ground. The spectrum was collected 32 times, followed by the automatic subtraction of the background line obtained. The spectra were recorded from 4000 to 400 cm−1.
Thermogravimetric analysis (TGA) was conducted in the system of TG (TG-Q500 TGA). Approximately 6 mg of the sample was pretreated at 100 °C in a flow of N2 for 30 min to remove physically adsorbed water and other impurities. The sample was then heated to 650 °C at a heating rate of 10 °C min−1 in flowing N2.
In situ diffuse reflectance infrared Fourier transform spectroscopy (DRIFTS) experiments of the NH4HSO4 decomposition and reactivity behaviors were performed using an FTIR spectrometer (Nicolet Nexus 6700), which was equipped with an MCT/A detector. The background spectra were obtained in N2 at 100 °C, 150 °C, 250 °C, 350 °C and 450 °C, respectively. Then the tested sample was heated to certain temperatures in N2 or N2 + NO (1000 ppm) + O2 (5%) to investigate the dynamic changes in the catalyst surface functional groups.
3. Results and discussions
3.1 Catalyst surface functional groups
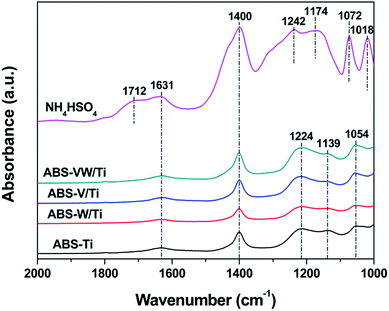
As is shown in Table 1, the deposition amount of NH4HSO4 on each catalyst is almost the same because of the existence of errors during the catalyst preparation process and elemental analysis experiments. The XRD patterns of the samples illustrate that NH4HSO4, V2O5 and WO3 are highly dispersed and exist in the amorphous state on the catalyst surface (Fig. S1†). In the case of the sulfate-free samples, no obvious characteristic peaks can be detected in the range between 1000 and 2000 cm−1, except for the band at 1631 cm−1 attributed to the vibrations of H2O on the catalyst surface (Fig. S2†). This observation suggests that the bands assigned to the S![[double bond, length as m-dash]](https://www.rsc.org/images/entities/char_e001.gif) O and S–O vibrations can only be detected in the NH4HSO4-containing samples. Given the deposition of NH4HSO4 on the TiO2 catalyst surface, the characteristic peaks of bidentate sulfate anions at 1224, 1139, 1054 cm−1, instead of the band attributed to free HSO4− at 1174 cm−1,16,17 are generated (Fig. 1).18,19 Based on previous studies, the characteristic peaks at 1224, 1139, and 1054 cm−1 can be assigned to the v3 vibrations of bidentate SO42− in C2v symmetry.20 In addition, this form of S-containing functional groups is stable and continues to exist after the calcination process of sulfated TiO2 at 500 °C.21 The bands at 1224, 1139 cm−1 are related to the asymmetrical and symmetrical stretching of the S
O and S–O vibrations can only be detected in the NH4HSO4-containing samples. Given the deposition of NH4HSO4 on the TiO2 catalyst surface, the characteristic peaks of bidentate sulfate anions at 1224, 1139, 1054 cm−1, instead of the band attributed to free HSO4− at 1174 cm−1,16,17 are generated (Fig. 1).18,19 Based on previous studies, the characteristic peaks at 1224, 1139, and 1054 cm−1 can be assigned to the v3 vibrations of bidentate SO42− in C2v symmetry.20 In addition, this form of S-containing functional groups is stable and continues to exist after the calcination process of sulfated TiO2 at 500 °C.21 The bands at 1224, 1139 cm−1 are related to the asymmetrical and symmetrical stretching of the S![[double bond, length as m-dash]](https://www.rsc.org/images/entities/char_e001.gif) O vibrations. At 1054 cm−1, this band is assigned to the asymmetrical stretching of the S–O vibrations.19,22,23 These results suggest that chemical interaction occurs when NH4HSO4 is deposited on the Ti catalyst surface, with the transformation of sulfate species from HSO4− to bidentate SO42−, which are subsequently bonded to TiO2 sites.
O vibrations. At 1054 cm−1, this band is assigned to the asymmetrical stretching of the S–O vibrations.19,22,23 These results suggest that chemical interaction occurs when NH4HSO4 is deposited on the Ti catalyst surface, with the transformation of sulfate species from HSO4− to bidentate SO42−, which are subsequently bonded to TiO2 sites.
| Samples | S content (wt%) | N content (wt%) |
|---|---|---|
| ABS-Ti | 2.30 | 0.82 |
| ABS-W/Ti | 2.31 | 0.82 |
| ABS-V/Ti | 2.39 | 0.86 |
| ABS-VW/Ti | 2.41 | 0.86 |
| ABS-VW6.5/Ti | 2.36 | 0.83 |
| ABS-VW8/Ti | 2.37 | 0.84 |
Given the addition of WO3, characteristic peaks assigned to NH4+, adsorbed H2O and bidentate SO42−, are still presented, demonstrating the occurrence of the interaction between NH4HSO4 and TiO2 support in the W-doped samples. At the same time, no extra peaks could be detected; the absence of vanadyl sulfate or tungstate sulfate compound indicates that SO42− are only bonded to the TiO2 surface rather than the V2O5 or WO3 surfaces.24 Although no V–SO4 or W–SO4 species are detected from the IR spectra obtained, chemical interactions between V species (or W species) and NH4HSO4 still need to be explored.
Considering the existence of chemical interaction between NH4HSO4 and catalysts, it is related to the electron deviation between catalyst atoms and ammonium ions or sulfate anions, which is still unknown from the XRD patterns and IR spectra obtained. Therefore, the XPS method was conducted to extensively explore this chemical interaction.
3.2 Catalyst atom environment
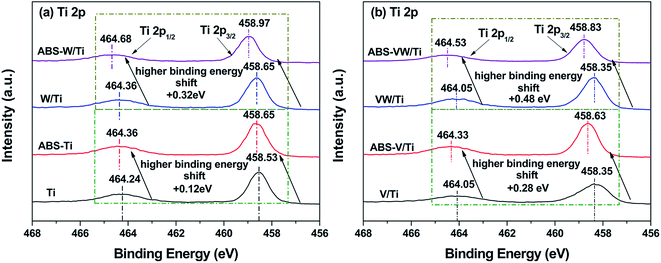
The XPS method was conducted to investigate the variations in the catalyst atom environment before or after the introduction of NH4HSO4. For the V/Ti sample, as shown in Fig. 2(b), the binding energies of Ti 2p3/2 (458.35 eV) and Ti 2p1/2 (464.05 eV) are typical characteristics of Ti4+ ions.25 Given the deposition of NH4HSO4 on the catalyst surface, these Ti 2p photoelectron bands shift towards a high binding energy (increased by about 0.28 eV), indicating that Ti atoms exist in an electron-deficit state in the NH4HSO4-loaded samples.24 While in the VW/Ti sample, greater increase in the binding energy values corresponding to the Ti 2p photoelectron peaks occurs with the introduction of NH4HSO4 (increased by about 0.48 eV). And combined with the binding energy values attributed to the Ti 2p photoelectron peaks of the NH4HSO4-deposited samples (Fig. 2), it seems that Ti species in the W-containing samples show more severe deviation of electron cloud by interacting with NH4HSO4.26For V atoms, the peak ranging between 516.40 eV and 517.00 eV can be indexed to V5+. V4+ and V3+ are in the range of 515.70–516.40 eV and 515.00–515.70 eV, respectively.27 As shown in Fig. 3(a), the deconvolution of V 2p photoelectron peaks indicates the co-existence of V5+, V4+ and V3+ in the V/Ti and VW/Ti samples. After the introduction of NH4HSO4, a dramatic increase in the ratio of V5+/(V4+ + V3+ + V5+) can be seen, indicating the increase in the valence state of V atoms, as shown in Table 2.
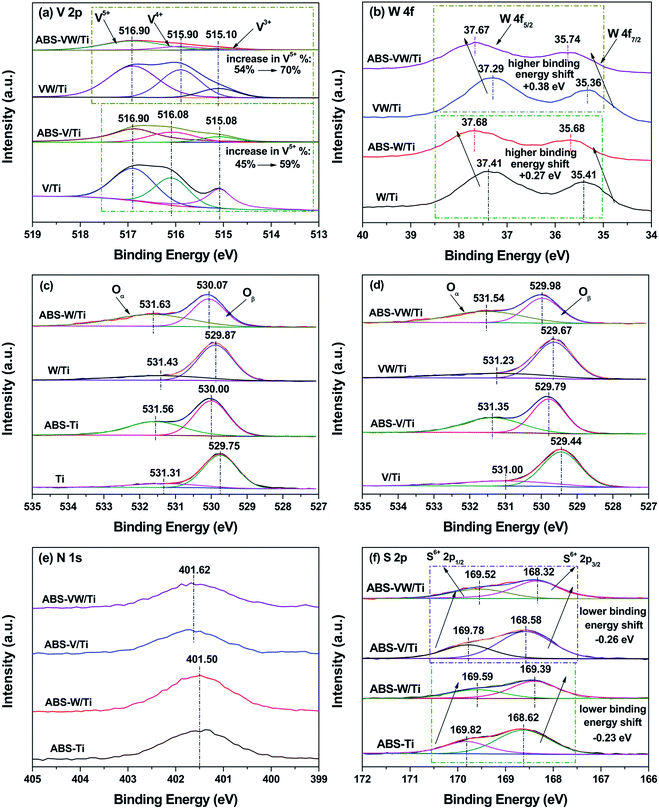 | ||
| Fig. 3 XPS spectra: (a) V 2p; (b) W 4f; (c) O 1s: V-free sample; (d) O 1s: V-containing samples; (e) N 1s; (f) S 2p. | ||
| Samples | Ti atom % | O atom % | V atom % | W atom % | N atom % | S atom % | V5+ % | Oα/(Oα + Oβ) % |
|---|---|---|---|---|---|---|---|---|
| Ti | 32.12 | 67.88 | — | — | — | — | — | 20.44 |
| ABS-Ti | 23.79 | 66.91 | — | — | 4.51 | 4.79 | — | 41.88 |
| V/Ti | 27.96 | 70.86 | 1.18 | — | — | — | 44.58 | 27.00 |
| ABS-V/Ti | 22.9 | 66.25 | 0.39 | — | 5.11 | 5.34 | 59.27 | 43.17 |
| W/Ti | 28.44 | 67.88 | — | 3.68 | — | — | — | 25.44 |
| ABS-W/Ti | 20.09 | 69.17 | — | 2.59 | 4.11 | 4.04 | — | 51.13 |
| VW/Ti | 26.69 | 68.85 | 0.71 | 3.74 | — | — | 54.24 | 26.19 |
| ABS-VW/Ti | 20.16 | 68.1 | 0.31 | 2.53 | 4.42 | 4.48 | 70.42 | 47.56 |
For W atoms, the peaks in the range of 36.36–36.74 eV and 37.41–37.68 eV can be assigned to the spin–orbit splitting components of the W 4f named W 4f7/2 and 4f5/2 respectively, as shown in Fig. 3(b).28 This result illustrates the existence of W atoms in the +6 oxidation state. Given the introduction of NH4HSO4, these W 4f photoelectron peaks shift toward higher binding energies, indicating that the electron cloud density around the W atoms is lower than that in the NH4HSO4-free samples.
According to Fig. 3(c) and (d), the O1s spectra can be deconvoluted into two peaks, which are related to various oxygen-containing chemical bonds. Based on previous studies, the first peak centered in the range of 529.44–530.06 eV is assigned to lattice oxygen O2− (Oβ), and the second peak (531.00–531.62 eV) may be attributed to chemical adsorbed oxygen Oα, including the defect-oxide or hydroxyl-like group.29 The concentration ratio of Oα/(Oα + Oβ) is quite low for the sulfate-free samples; this ratio increases with the deposition of NH4HSO4 (as shown in Table 1). Saur et al.30 claimed that the structure of sulfate species is presented as (M–O)3S![[double bond, length as m-dash]](https://www.rsc.org/images/entities/char_e001.gif) O under dry conditions. By contrast, the sulfate species are bridged bidentate with H, forming a Bronsted site, (M2SO4)H, under wet conditions. Thus, Bronsted sites increase and more hydroxyls come out with the deposition of NH4HSO4, which leads to a relatively high ratio of Oα/(Oα + Oβ). Besides, the binding energies assigned to the O 1s photoelectron peaks increase with the deposition of NH4HSO4, revealing a decreased electron cloud density around the O atoms.31
O under dry conditions. By contrast, the sulfate species are bridged bidentate with H, forming a Bronsted site, (M2SO4)H, under wet conditions. Thus, Bronsted sites increase and more hydroxyls come out with the deposition of NH4HSO4, which leads to a relatively high ratio of Oα/(Oα + Oβ). Besides, the binding energies assigned to the O 1s photoelectron peaks increase with the deposition of NH4HSO4, revealing a decreased electron cloud density around the O atoms.31
As is previously mentioned, NH4HSO4 introduction leads to a decline in the electron cloud density around the catalyst atoms. Considering the charge balance, it can be concluded that electrons around the catalyst atoms in the NH4HSO4-loaded samples might deviate toward sulfate species or ammonium species. As shown in Fig. 3(e), the N 1s spectra demonstrate that N species exist as NH4+.32 No obvious variations in the binding energies corresponding to the N 1s photoelectron peaks could be detected with the addition of WO3 (401.50 eV in V-free sample, 401.62 eV in V-loaded sample). Based on Fig. 3(f), after the curve fitting of S 2p spectra, the S doublet can be attributed to the S 2p3/2 (between 169.82 and 169.52 eV) and S 2p1/2 (ranging from 168.32–168.62 eV) transitions of SO42−.33 Compared with W-free samples, a higher electron cloud density around the S atoms in the W-added samples can be detected, as is illustrated by the decrease in the binding energies of the S 2p photoelectron peaks. Considering the alkalinity of NH3, it seems that SO42− possess higher electronegativity in comparison to NH4+, although no direct evidence about the exact electronegativity values of SO42− and NH4+ is available. Generally, S![[double bond, length as m-dash]](https://www.rsc.org/images/entities/char_e001.gif) O covalent bond is responsible for the generation of acidic sites on the sulfate-containing catalysts and has a strong ability to attract electrons from basic molecules.34 Consequently, electrons around the catalyst atoms in the NH4HSO4-deposited samples deviate to sulfate species resulting from the stronger electron affinity by S6+ in S
O covalent bond is responsible for the generation of acidic sites on the sulfate-containing catalysts and has a strong ability to attract electrons from basic molecules.34 Consequently, electrons around the catalyst atoms in the NH4HSO4-deposited samples deviate to sulfate species resulting from the stronger electron affinity by S6+ in S![[double bond, length as m-dash]](https://www.rsc.org/images/entities/char_e001.gif) O structures, thereby leaving S atoms exist in an electron-enrichment state; and WO3 introduction leads to an increase in the electron cloud density around the S atoms with +6 formal oxidation number as in SO42−.
O structures, thereby leaving S atoms exist in an electron-enrichment state; and WO3 introduction leads to an increase in the electron cloud density around the S atoms with +6 formal oxidation number as in SO42−.
3.3 The promotion effect of WO3 on the NH4HSO4 decomposition behavior
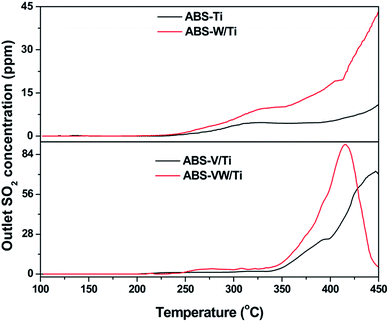
According to previous studies, the decomposition behavior of NH4HSO4 was closely related to the release of SO2 gas.35 That is to say, the NH4HSO4 decomposition behavior on the catalyst surface during the heat process is attributed to the reduction of S atoms in the +6 oxidation state as in SO42− to those in the +4 oxidation state as in SO2, which is promoted in a reduction atmosphere.36 Based on the XPS results, the addition of WO3 increases the electron cloud density around the S atoms in SO42−; it seems that SO42− on the WO3-promoted catalysts would be easily reduced to SO2 during the heat process in comparison to those on the WO3-free catalysts.In order to prove this assumption, TPDC method was conducted to explore the behaviors of sulfate species during the heat process.8 In the case of the ABS-Ti sample, SO2 begins to release at a temperature of ca. 250 °C, as is shown in Fig. 4. With increasing temperature, the outlet SO2 concentration almost keeps constant, which starts to increase at a temperature higher than 400 °C. As for the SO42− consumption behavior on the W/Ti catalyst surface, an obvious increase in the outlet SO2 concentration can be detected, indicating that more S-containing functional groups are consumed during the heat process. Similar phenomenon could be observed in the V-containing samples that the addition of WO3 promotes the SO42− consumption behavior in the lower temperature region, which is consistent with the assumptions drawn from the XPS results.
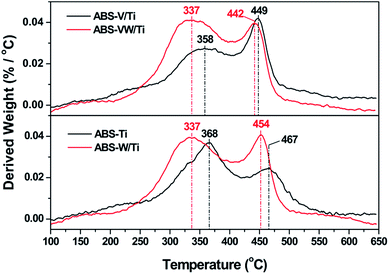
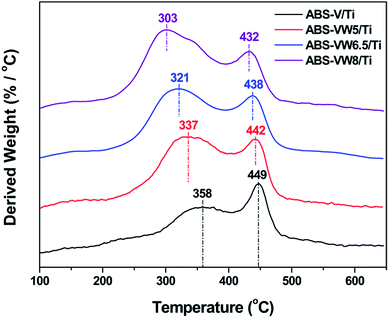
Fig. 5 illustrates the NH4HSO4 decomposition behavior on the W-added or W-free catalysts; all the samples exhibit two weight loss peaks during the heat process. Compared with ABS-Ti sample (at ca. 368 and 467 °C, respectively), temperatures (at ca. 337 °C and 454 °C, respectively) corresponding to the weight loss peaks decrease for the ABS-W/Ti sample. Similar trend could be detected in the V-containing samples that the addition of WO3 exerts a positive effect on the NH4HSO4 decomposition behavior in the lower temperature region, as the decrease in the temperatures assigned to the weight loss peaks illustrates. In comparison with W-free samples, the introduced WO3 lead to a high decomposition rate of NH4HSO4 at low-temperature regions, as the increased derived weight value assigned to the first weight loss peak reveals. That is to say, the addition of WO3 adversely affects the stability of the deposited NH4HSO4, which might be an important reason for the enhanced sulfur resistance of WO3-promoted catalysts at lower temperatures to some extent.1,14 Fig. 6 illustrates the effect of high WO3 contents on the decomposition behavior of the deposited NH4HSO4. The increase in the WO3 content leads to an enhancement in the NH4HSO4 decomposition behavior in the lower temperature region, as the obvious decrease in the temperatures attributed to the weight loss peaks suggests.
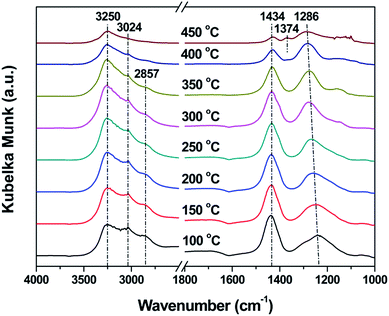
In situ DRIFTS and elemental analysis were conducted to investigate the detailed NH4HSO4 decomposition behavior over the VW/Ti catalyst surface. As shown in Fig. 7, characteristic IR peaks at 1244 and 1434 cm−1, which can be assigned to the asymmetrical stretching vibrations of S![[double bond, length as m-dash]](https://www.rsc.org/images/entities/char_e001.gif) O in bidentate SO42− and NH4+ bonded to Bronsted acid sites, appear when the temperature is 100 °C.7 Meanwhile, obvious N–H stretching vibration bands from ionic NH4+ (3250, 3024 and 2857 cm−1) also come out.31 The surface bidentate sulfate species undergo a blue shift (from 1244 to 1286 cm−1) with the increase in the temperature.37 It should be noted that there is a drastic decrease in the intensity of the peaks assigned to NH4+ at 1434 cm−1 and sulfate species at 1286 cm−1 at the temperature of 450 °C, which is attributed to the decomposition behavior of the deposited NH4HSO4 during the heat process. Additionally, characteristic IR peak at 1375 cm−1, the asymmetrical stretching vibrations of O
O in bidentate SO42− and NH4+ bonded to Bronsted acid sites, appear when the temperature is 100 °C.7 Meanwhile, obvious N–H stretching vibration bands from ionic NH4+ (3250, 3024 and 2857 cm−1) also come out.31 The surface bidentate sulfate species undergo a blue shift (from 1244 to 1286 cm−1) with the increase in the temperature.37 It should be noted that there is a drastic decrease in the intensity of the peaks assigned to NH4+ at 1434 cm−1 and sulfate species at 1286 cm−1 at the temperature of 450 °C, which is attributed to the decomposition behavior of the deposited NH4HSO4 during the heat process. Additionally, characteristic IR peak at 1375 cm−1, the asymmetrical stretching vibrations of O![[double bond, length as m-dash]](https://www.rsc.org/images/entities/char_e001.gif) S
S![[double bond, length as m-dash]](https://www.rsc.org/images/entities/char_e001.gif) O species in tridentate SO42−, starts to appear.31 That might be attributed to the transformation of sulfate species from (M2SO4)H structure to (M–O)3S
O species in tridentate SO42−, starts to appear.31 That might be attributed to the transformation of sulfate species from (M2SO4)H structure to (M–O)3S![[double bond, length as m-dash]](https://www.rsc.org/images/entities/char_e001.gif) O one.38 Elemental analysis was conducted to identify the S and N contents of the ABS-VW/Ti samples after the calcination process at various temperatures (250, 350 and 450 °C), which facilitated estimation of the behaviors of ammonium and sulfate species during the heat process. These temperatures are selected based on the results of TG-DTG. As is shown in Table 3, the sample remains almost unchanged at a calcination temperature lower than 250 °C. The N content starts to decrease at a calcination temperature higher than 350 °C, revealing the decomposition of ammonium ions. Meanwhile, a slight decrease in the S content is observed at a calcination temperature of 350 °C. Sulfate species begin to be greatly consumed when the calcination temperature is increased further. This finding confirms that the first weight loss peak at ca. 337 °C is mainly attributed to the decomposition of NH4+ along with a small part of SO42−, while the latter one might be attributed to the simultaneous consumption of NH4+ and SO42−.
O one.38 Elemental analysis was conducted to identify the S and N contents of the ABS-VW/Ti samples after the calcination process at various temperatures (250, 350 and 450 °C), which facilitated estimation of the behaviors of ammonium and sulfate species during the heat process. These temperatures are selected based on the results of TG-DTG. As is shown in Table 3, the sample remains almost unchanged at a calcination temperature lower than 250 °C. The N content starts to decrease at a calcination temperature higher than 350 °C, revealing the decomposition of ammonium ions. Meanwhile, a slight decrease in the S content is observed at a calcination temperature of 350 °C. Sulfate species begin to be greatly consumed when the calcination temperature is increased further. This finding confirms that the first weight loss peak at ca. 337 °C is mainly attributed to the decomposition of NH4+ along with a small part of SO42−, while the latter one might be attributed to the simultaneous consumption of NH4+ and SO42−.
| Samples | S content (wt%) | N content (wt%) |
|---|---|---|
| Uncalcined | 2.41 | 0.86 |
| 250 °C | 2.39 | 0.82 |
| 350 °C | 2.25 | 0.46 |
| 450 °C | 1.24 | 0 |
Since it has been proved that ammonium species are bonded to sulfate sites according to the FTIR spectra, NH4+ accommodated on sulfate sites would be gradually consumed with increasing temperature, as illustrated by the decreased N content at a calcination temperature higher than 250 °C.7 Provided that a decrease in the amount of sulfate sites occurs during the heat process, a decline in the surface ammonium species would be expected to occur. In the case of W-added samples, the addition of WO3 increases the electron cloud density around the S atoms in SO42−, which is beneficial for the reduction of S atoms in the +6 oxidation state in SO42− to those in the +4 oxidation state in SO2. As a result, the addition of WO3 has a promotion effect on the SO42− consumption behavior at lower temperatures, as is illustrated by the increased SO2 release amount in the lower temperature region for the WO3-promoted samples during the heat process. The decreased surface sulfate sites for the accommodation of NH4+ promotes the NH4+ consumption behavior at low-temperature regions. Consequently, the first weight loss peak mainly attributed to the decomposition of NH4+ would shift to lower temperatures. As previously mentioned, electron deviation from catalyst atoms to sulfate anions would be the key factor in the NH4HSO4 decomposition behavior on the catalysts and WO3 addition increases the electron cloud density around the S atoms with +6 formal oxidation number as in SO42−. Therefore, the decomposition behavior of NH4HSO4 would be promoted on the WO3-added catalysts.
3.4 The promotion effect of WO3 on the NH4HSO4 reactivity behavior with NO
Based on our previous studies, NH4+ belonging to NH4HSO4 acts as a reductant and reacts with NO to produce N2 and H2O.7 Similar with SCR mechanism, it seems that NH4+ activation process might be the key factor in the reactivity behavior of NH4HSO4 with NO, which catalyst redox property determines. It has been proved that the addition of WO3, the typical promoter in industrial catalysts, would enhance the low-temperature SCR activity through tuning the catalyst acid and redox properties,39 which might lead to the variations in the NH4HSO4 reactivity behavior. In this section, TPSR and in situ DRIFTS experiments would be performed to prove these assumptions.The NO TPSR profiles with NH4HSO4 indicate that the addition of WO3 leads to a slight enhancement in the reactivity behavior of NH4HSO4 with NO, as the higher reaction rate constant below 330 °C and a decline in the temperature assigned to the maximum reaction rate constant reveal (Fig. S3(a)†). Meanwhile, an obvious decrease in the outlet concentration of N2O (the unwanted byproduct) is observed with the addition of WO3 (Fig. S3(c)†). Combined with the fairly low outlet concentration of NH3 (less than 1 ppm, Fig. S3(b)†), it can be concluded that the introduced WO3 exert a promotion effect on the catalytic selectivity to N2 during the TPSR process. In addition, the reaction of NH4HSO4 with NO is an important reason for the consumption of the surface ammonium species during the TPSR process (Fig. S3(d)†). Fig. 8 illustrates the effect of high WO3 contents on the reactivity of NH4HSO4 with NO. Given increases in WO3 content, a slight decline in the temperature attributed to the maximum reaction rate constant can be detected. This reaction suggests a little higher reactivity of NH4HSO4 with NO on the high W content catalyst surfaces.
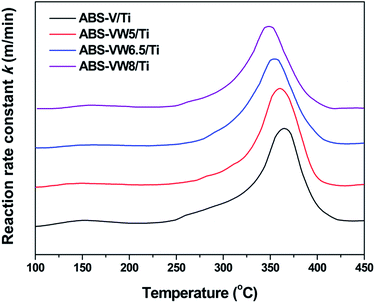 | ||
| Fig. 8 TPSR profiles of NH4HSO4 with NO on the VW/Ti catalysts containing 5, 6.5, 8 wt% WO3; condition: 1000 ppm NO + 3% O2 in N2 at 0.5 L min−1; heating rate: 5 °C min−1; 0.3 g samples. | ||
As for the detailed reactivity behavior of NH4HSO4 with NO at a constant temperature over the VW/Ti catalyst surface, in situ DRIFTS experiments were conducted. It seems that the reaction rate of NH4HSO4 with NO at 250 °C over the VW/Ti catalyst is quite low, because NH4HSO4 remains almost unchanged after the exposure in an NO-containing flue gas in those first three hours, which begins to be obviously consumed after 200 min (Fig. S4†). Combined with NO TPSR profiles, it seems that the low reactivity of NH4HSO4 with NO at low-temperature regions might be an important reason for the serious catalyst deactivation in the SO2- and H2O-containing flue gas below 300 °C to some extent. In addition, no characteristic peaks assigned to nitrate and nitrite species are detected, indicating the reaction pathway between NH4+ species and gaseous NO dominates in the reactivity behavior of NH4HSO4 with NO over the VW/Ti catalyst surface. The dehydrogenation of NH4+ species by adjacent redox sites may be the rate determining step, as the subsequent reaction with NO to produce N2 and H2O follows.1
3.5 The promotion effect of WO3 on the catalyst sulfur resistance
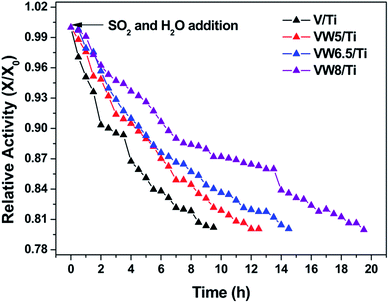
The effects of SO2 and H2O addition on the SCR of NO with NH3 over the V/Ti, VW5/Ti, VW6.5/Ti and VW8/Ti catalysts were detected as a function of time on stream. As is shown in Fig. 9, in the case of the V/Ti catalyst, an obvious decrease in the SCR activity occurs upon the addition of SO2 and H2O. The ratio of X/X0 reaches 0.8 after 9.5 h. In the case of the VW5/Ti catalyst, the duration required for the relative activity X/X0 to reach 0.8 is 12.5 h. Further increasing the WO3 addition amount, a significant enhancement in the catalyst sulfur resistance occurs; for the VW6.5/Ti and VW8/Ti catalysts, the X/X0 ratio reaches 0.8 after 14.5 and 19.5 h, respectively, which are longer than V/Ti and VW5/Ti catalysts. It seems that catalyst sulfur resistance is greatly enhanced with the addition of WO3 at lower temperatures.According to the V2O5/TiO2-based catalyst sulfur poisoning mechanism, it is clearly confirmed that catalyst sulfur resistance is mainly related to the rate difference between the NH4HSO4 formation and consumption behaviors on the catalyst surface.6,10 Considering the inevitable NH4HSO4 formation behavior in the SO2- and H2O-containing flue gas at lower temperatures,40 it seems that catalyst sulfur resistance is closely attributed to the decomposition and reactivity behaviors of NH4HSO4 with NO. Combined with thermogravimetric analysis and TPSR profiles, WO3 addition leads to an enhancement in the NH4HSO4 decomposition and reactivity behaviors, which could protect SCR catalysts from being deactivated by the excess deposition of NH4HSO4. Therefore, WO3-promoted V/Ti catalysts exhibit an enhanced SO2-resistant ability in the lower temperature region.
For the design of catalysts possessing high catalytic activity and sulfur resistance, the addition of promotors may be an effective method. As is mentioned above, electron deviation from catalyst atoms to sulfate anions might play an important role in the NH4HSO4 decomposition behavior; NH4+ activation process might be the key factor in the NH4HSO4 reactivity behavior with NO. Based on the DFT calculations, Sb2O5, as a typical promoter in SCR catalysts, has the higher HOMO energy than WO3, MoO3 and Nb2O5, indicating the easier electron donation of Sb2O5.41 Considering the strong electronegativity of SO42−, it seems that the NH4HSO4 decomposition behavior would be improved with the addition of Sb2O5, which has not been studied. And in comparison to WO3, MoO3 and Nb2O5, Sb2O5 has the lower LUMO energy, indicating the higher oxidation ability of Sb2O5. A high reactivity of NH4HSO4 with NO on the Sb2O5-doped catalysts would be expected to occur. In the next study, extensive investigation would be conducted on the promotion effect of Sb2O5 on the decomposition and reactivity of NH4HSO4 with NO.
4. Conclusion
Catalyst crystal phases and surface functional groups remain unchanged regardless of WO3 addition. Compared with W-free samples, the introduction of WO3 leads to an increased electron cloud density around the S atoms in SO42−, which might have a positive effect on the reduction of S atoms in the +6 oxidation state as in NH4HSO4 to those in the +4 oxidation state as in SO2. Consequently, WO3-doping increases the SO2 release amount at lower temperatures during the heat process; the decomposition behavior of NH4HSO4 is promoted by the introduction of WO3, as the decrease in the temperatures for the weight loss peaks illustrates. Meanwhile, the addition of WO3 has a mild promotion effect on the reactivity of NH4HSO4 with NO together with an inhibitory effect on the production of N2O during the reaction process. Finally, WO3-promoted catalysts exhibit an enhanced SO2-resistant ability.Acknowledgements
This work is supported by the National Science Foundation for Distinguish Yong Scholars of China (No. 51125025) and the National High-Tech Research and Development (863) Program of China (No. 2013AA065401).References
- G. Busca, L. Lietti, G. Ramis and F. Berti, Appl. Catal., B, 1998, 18, 1–36 CrossRef CAS
.
- F. Liu, W. Shan, Z. Lian, L. Xie, W. Yang and H. He, Catal. Sci. Technol., 2013, 3, 2699 CAS
.
- R. Qu, X. Gao, K. Cen and J. Li, Appl. Catal., B, 2013, 142–143, 290–297 CrossRef CAS
.
- F. Liu, H. He, Z. Lian, W. Shan, L. Xie, K. Asakura, W. Yang and H. Deng, J. Catal., 2013, 307, 340–351 CrossRef CAS
.
- M. Kobayashi, R. Kuma and A. Morita, Catal. Lett., 2006, 112, 37–44 CrossRef CAS
.
- Y. Xi, N. A. Ottinger and Z. G. Liu, Appl. Catal., B, 2014, 160–161, 1–9 CrossRef CAS
.
- D. Ye, R. Qu, H. Song, X. Gao, Z. Luo, M. Ni and K. Cen, Chem. Eng. J., 2016, 283, 846–854 CrossRef CAS
.
- Z. Zhu, H. Niu, Z. Liu and S. Liu, J. Catal., 2000, 195, 268–278 CrossRef CAS
.
- Z. Zhu, Z. Liu, H. Niu, S. Liu, T. Hu, T. Liu and Y. Xie, J. Catal., 2001, 197, 6–16 CrossRef CAS
.
- Z. Huang, J. Catal., 2003, 214, 213–219 CrossRef CAS
.
- P. Li, Q. Liu and Z. Liu, Chem. Eng. J., 2012, 181–182, 169–173 CrossRef CAS
.
- G. Baltin, H. Köser and K.-P. Wendlandt, Catal. Today, 2002, 75, 339–345 CrossRef CAS
.
- D. W. Kwon and S. Chang Hong, RSC Adv., 2016, 6, 1169–1181 RSC
.
- D. W. Kwon, K. H. Park and S. C. Hong, Chem. Eng. J., 2016, 284, 315–324 CrossRef CAS
.
- D. W. Kwon and S. C. Hong, Appl. Surf. Sci., 2015, 356, 181–190 CrossRef CAS
.
- A. Goypiron, J. De Villepin and A. Novak, J. Raman Spectrosc., 1980, 9, 297–303 CrossRef CAS
.
- M. Mamlouk, P. Ocon and K. Scott, J. Power Sources, 2014, 245, 915–926 CrossRef CAS
.
- J. P. Chen and R. T. Yang, J. Catal., 1993, 139, 277–288 CrossRef CAS
.
- J. L. Ropero-Vega, A. Aldana-Pérez, R. Gómez and M. E. Niño-Gómez, Appl. Catal., A, 2010, 379, 24–29 CrossRef CAS
.
- J. R. Sohn and H. W. Kim, J. Mol. Catal., 1989, 52, 361–374 CrossRef CAS
.
- S. T. Choo, Y. G. Lee, I.-S. Nam, S.-W. Ham and J.-B. Lee, Appl. Catal., A, 2000, 200, 177–188 CrossRef CAS
.
- L. K. Noda, R. M. de Almeida, L. F. D. Probst and N. S. Gonçalves, J. Mol. Catal. A: Chem., 2005, 225, 39–46 CrossRef CAS
.
- K. Nakamoto, Infrared and Raman spectra of inorganic and coordination compounds, Wiley Online Library, 1986 Search PubMed
.
- X. Guo, C. Bartholomew, W. Hecker and L. L. Baxter, Appl. Catal., B, 2009, 92, 30–40 CrossRef CAS
.
- X. Du, X. Gao, Y. Fu, F. Gao, Z. Luo and K. Cen, J. Colloid Interface Sci., 2012, 368, 406–412 CrossRef CAS PubMed
.
- F. Liu, H. He, C. Zhang, Z. Feng, L. Zheng, Y. Xie and T. Hu, Appl. Catal., B, 2010, 96, 408–420 CrossRef CAS
.
- J. Haber, Catal. Today, 2009, 142, 100–113 CrossRef CAS
.
- R. Camposeco, S. Castillo, V. Mugica, I. Mejía-Centeno and J. Marín, Chem. Eng. J., 2014, 242, 313–320 CrossRef CAS
.
- J.-C. Dupin, D. Gonbeau, P. Vinatier and A. Levasseur, Phys. Chem. Chem. Phys., 2000, 2, 1319–1324 RSC
.
- O. Saur, M. Bensitel, A. B. M. Saad, J. C. Lavalley, C. P. Tripp and B. A. Morrow, J. Catal., 1986, 99, 104–110 CrossRef CAS
.
- F. Liu, K. Asakura, H. He, W. Shan, X. Shi and C. Zhang, Appl. Catal., B, 2011, 103, 369–377 CrossRef CAS
.
- W. Xu, H. He and Y. Yu, J. Phys. Chem. C, 2009, 113, 4426–4432 CAS
.
- S. Liu and X. Chen, J. Hazard. Mater., 2008, 152, 48–55 CrossRef CAS PubMed
.
- T. Yamaguchi, T. Jin and K. Tanabe, J. Phys. Chem. C, 1986, 90, 3148–3152 CrossRef CAS
.
- J. Li and G.-E. Zhang, Acta Phys.-Chim. Sin., 1992, 8, 123–127 CrossRef CAS
.
- H. Tian, Q. Guo, X. Yue and Y. Liu, Fuel Process. Technol., 2010, 91, 1640–1649 CrossRef CAS
.
- B. Q. Jiang, Z. B. Wu, Y. Liu, S. C. Lee and W. K. Ho, J. Phys. Chem. C, 2010, 114, 4961–4965 CAS
.
- A. Kayo, T. Yamaguchi and K. Tanabe, J. Catal., 1983, 83, 99–106 CrossRef CAS
.
- C. Wang, S. Yang, H. Chang, Y. Peng and J. Li, Chem. Eng. J., 2013, 225, 520–527 CrossRef CAS
.
- S. Matsuda, T. Kamo, A. Kato, F. Nakajima, T. Kumura and H. Kuroda, Ind. Eng. Chem. Prod. Res. Dev., 1982, 21, 48–52 CrossRef CAS
.
- X. Du, X. Gao, W. Hu, J. Yu, Z. Luo and K. Cen, J. Phys. Chem. C, 2014, 118, 13617–13622 CAS
.
Footnote |
| † Electronic supplementary information (ESI) available. See DOI: 10.1039/c6ra09072a |
| This journal is © The Royal Society of Chemistry 2016 |

