 Open Access Article
Creative Commons Attribution 3.0 Unported Licence
The crystallization of MgO–Al2O3–SiO2–ZrO2 glass-ceramics with and without the addition of Y2O3 – a combined STEM/XANES study
Sabrina
Seidel
a,
Christian
Patzig
*b,
Thomas
Höche
b,
Michael
Krause
b,
Martin
Ebert†
b,
Yongfeng
Hu
c,
Lucia
Zuin
c,
Antje
Gawronski‡
a and
Christian
Rüssel
a
aOtto Schott Institut, Jena University, Fraunhoferstraße 6, D-07743 Jena, Germany
bFraunhofer Institute for Microstructure of Materials and Systems IMWS, Walter-Huelse-Straße 1, 06120 Halle (Saale), Germany. E-mail: christian.patzig@imws.fraunhofer.de
cCanadian Light Source Inc., University of Saskatchewan, 44 Innovation Boulevard, Saskatoon, S7N 2V3, Canada
First published on 27th June 2016
Abstract
Glasses with the mol% composition of 51.9SiO2/21.2Al2O3/21.2MgO/5.7ZrO2 without and with the addition of 2.5 mol% Y2O3 were melted and subsequently transformed into glass-ceramics via annealing. Both glass-ceramics show strong differences in the microstructure and in the phase composition after crystallization at 950 °C for 5 h and subsequently at 1060 °C for different annealing times. In the glass without Y2O3, the main crystal phase is a quartz solid solution accompanied by the precipitation of ZrO2 and spinel. By contrast, glass-ceramics without the presence of a quartz solid solution were observed after the crystallization of the Y2O3-containing glass, using the same heat treatment. This is confirmed by analytical scanning transmission electron microscopy analysis and X-ray absorption near-edge structure spectroscopy data gathered at the Zr L2-, Y L2,3-, Si K- and Al L-edges. Furthermore, using X-ray absorption spectroscopy the coordination of the respective elements is analysed, and changes of the coordination during crystallization are monitored.
Introduction
Glass-ceramics based on the MgO/Al2O3/SiO2 (MAS) system have excellent mechanical properties, such as high hardness, Young's modulus, strength and fracture toughness.1–7 Since the MAS system tends to surface nucleation,8–11 the addition of nucleating agents such as TiO2,1,12–14 ZrO2![[thin space (1/6-em)]](https://www.rsc.org/images/entities/char_2009.gif) 2–7,14–16 or both17,18 is necessary to achieve bulk crystallization. If the glass contains high enough concentrations of these nucleation agents, during thermal treatment at temperatures slightly above Tg, crystallization in these glasses is initiated by the formation of TiO2, ZrO2 or ZrTiO4 precipitations.4,16,18 Depending on the chemical composition, a further thermal treatment at higher temperatures may lead to the crystallization of quartz solid solutions.1–7 These quartz solid solutions (also denoted as μ-cordierite or “stuffed quartz”) typically contain MgO and Al2O3 in concentrations of 8 to 10 mol%, thus stabilizing the hexagonal, high-temperature β-quartz phase during cooling to room temperature, which, if not stabilized, would otherwise transform into the trigonal, low-temperature α-quartz phase.1,18 Applying an appropriate temperature/time schedule, the formation of spinel (MgAl2O4) is observed by soaking up MgO and Al2O3 from the quartz solid solutions2,7,16 which then contain only around 1 mol% of both MgO and Al2O3.1 These then MgO- and Al2O3-depleted solid solutions are also hexagonal (high quartz solid solutions) but show a phase transition to the trigonal low quartz solid solution during cooling at temperatures in the range from 520 to 580 °C,1 which is accompanied by a decrease in volume of around 0.7%.18 The large thermal expansion coefficients (CTE) of the low quartz solid solution (α20–300 °C = 13.2 × 10⁻⁶ K−1) and spinel (α20–800 °C = 8 × 10⁻⁶ K−1 (ref. 19)) as well as the strong volume decrease during the phase transition of the quartz solid solution are responsible for high stresses in the glass-ceramics, resulting in excellent mechanical properties thereof.1,18 Glass-ceramics containing high quartz solid solutions usually exhibit strengths of around 100 MPa,3,5,7 while in those containing low quartz solid solutions and spinel, strengths of up to 475 MPa are observed.3 The specific temperature and duration required for the formation of ‘transferable” quartz solid solution is strongly affected by the chemical compositions, including the concentrations of nucleating agents and other additives.
2–7,14–16 or both17,18 is necessary to achieve bulk crystallization. If the glass contains high enough concentrations of these nucleation agents, during thermal treatment at temperatures slightly above Tg, crystallization in these glasses is initiated by the formation of TiO2, ZrO2 or ZrTiO4 precipitations.4,16,18 Depending on the chemical composition, a further thermal treatment at higher temperatures may lead to the crystallization of quartz solid solutions.1–7 These quartz solid solutions (also denoted as μ-cordierite or “stuffed quartz”) typically contain MgO and Al2O3 in concentrations of 8 to 10 mol%, thus stabilizing the hexagonal, high-temperature β-quartz phase during cooling to room temperature, which, if not stabilized, would otherwise transform into the trigonal, low-temperature α-quartz phase.1,18 Applying an appropriate temperature/time schedule, the formation of spinel (MgAl2O4) is observed by soaking up MgO and Al2O3 from the quartz solid solutions2,7,16 which then contain only around 1 mol% of both MgO and Al2O3.1 These then MgO- and Al2O3-depleted solid solutions are also hexagonal (high quartz solid solutions) but show a phase transition to the trigonal low quartz solid solution during cooling at temperatures in the range from 520 to 580 °C,1 which is accompanied by a decrease in volume of around 0.7%.18 The large thermal expansion coefficients (CTE) of the low quartz solid solution (α20–300 °C = 13.2 × 10⁻⁶ K−1) and spinel (α20–800 °C = 8 × 10⁻⁶ K−1 (ref. 19)) as well as the strong volume decrease during the phase transition of the quartz solid solution are responsible for high stresses in the glass-ceramics, resulting in excellent mechanical properties thereof.1,18 Glass-ceramics containing high quartz solid solutions usually exhibit strengths of around 100 MPa,3,5,7 while in those containing low quartz solid solutions and spinel, strengths of up to 475 MPa are observed.3 The specific temperature and duration required for the formation of ‘transferable” quartz solid solution is strongly affected by the chemical compositions, including the concentrations of nucleating agents and other additives.
An effective nucleating agent for MAS glass-ceramics is TiO2 which, however, leads to a bluish to purple coloured glass.13 The same happens, if a mixture of ZrO2 and TiO2 is used. However, if solely ZrO2 is applied as nucleating agent, colorless and translucent to opaque glass-ceramics may be obtained.2–4,6,14
In the past few years, also the effect of rare earth oxides on the microstructure and phase formation was reported. It has been shown that the addition of Y2O3 to the glass composition may hinder the crystallization of the quartz solid solution, but also of indialite (also denoted as α-cordierite), e.g. in the system SiO2/MgO/B2O3/Al2O3.20 Furthermore, the addition of Y2O3 to a MAS glass with TiO2 as nucleating agent increases the temperatures of the formation of the first crystalline phase.21 Recently, it was reported how the addition of 2.5 mol% Y2O3 to a glass with the mol% composition 21.2MgO/21.2Al2O3/51.9SiO2/5.7ZrO2 leads to a drastic change of the crystallization behaviour during a two-step heat treatment at 950 °C and 1060 °C.5,6 By means of X-ray diffraction (XRD) and (scanning) transmission electron microscopy [(S)TEM] analysis in combination with energy-dispersive X-ray spectrometry (EDXS), it was shown that the crystallization of the glass without the addition of Y2O3 results in glass-ceramics with nanoscaled ZrO2 precipitations, acting as nucleation agents for a subsequent growth of the β-quartz solid solution and spinel as main crystalline phases, with the β-quartz solid solution transferring into the trigonal, low-temperature α-quartz modification during cooling the sample to room temperature.16 On the contrary, if Y2O3 is added to the glass composition, the occurrence of the quartz solid solution was not observed after thermal treatment at the same crystallization temperatures.5,6 It was shown that Y2O3 for the most part remains in the residual glassy phase during crystallization, stabilizes the glass and prevents the precipitation of the quartz solid solution.5 Nevertheless, the reported Young's moduli and the bending strengths of the resulting glass-ceramics free of the quartz solid solution were still high.6 The detected crystalline phases were spinel (MgAl2O4) and tetragonal or cubic ZrO2 (α = 10.5 × 10⁻⁶ K−1 (ref. 22)) which both show fairly high thermal expansion. In analogy to the glass-ceramics without Y2O3 addition containing the α-quartz solid solution at room temperature, notable stresses should occur in the microstructure leading to the reported good mechanical properties.
In this paper, additional X-ray absorption near-edge structure spectroscopy (XANES) data of the Si K-, Y L2,3-, Zr L2- and Al L2,3-edges of MAS glasses with and without additional Y2O3 is presented to complement and underline the previous XRD- and electron microscopy-based results concerning the crystallization behaviour of these glasses. Furthermore, the coordination of the respective elements within the MAS glasses and glass-ceramics were investigated.
Experimental
Glasses with the mol% compositions 51.9SiO2/21.2MgO/21.2Al2O3/5.6ZrO2 (sample set A) and 50.6SiO2/20.7MgO/20.7Al2O3/5.6ZrO2/2.4Y2O3 (sample set B, equivalent to sample set A with addition of 2.5 mol% Y2O3) were melted from the following raw materials: SiO2, 4MgCO3, Mg(OH)2·5H2O, Al(OH)3, and, in the case of sample set B, Y2O3. A quantity of 150 to 300 g glass was melted at a temperature of 1590 °C and kept for 2 h in a platinum crucible. Then the melt was cast into water, subsequently dried, and crushed to a particle size ≤1.25 mm. The glass was remelted at 1590 °C also for 2 h and then casted into a steal mould preheated to 600 °C. The received glass block was cooled in a muffle furnace, preheated to 850 °C, which was then switched off to cool the glass with a rate of approximately 2–3 K min−1. The crystallization experiments were performed using specimens with a size of 1 × 1 × 0.4 cm3. The samples A1 and B1 were heated to 950 °C for 5 h. Samples A2/B2 were first heated to 950 °C for 5 h and then to 1060 °C and subsequently, without keeping them at this temperature, they were cooled again. Samples A3/B3 and A4/B4 were heated to 950 °C, kept for 5 h and then heated to 1060 °C for 0.5 or 1 h, respectively. The heating and cooling rates were 5 K min−1.The phase composition was determined using X-ray diffraction (XRD, Siemens D5000 diffractometer) with Cu Kα radiation (λ = 0.154 nm) in a 2θ range from 10° to 60°.
XANES measurements of the Zr L2-, Y L2,3- and Si K-edges were performed at the Canadian Light Source (CLS) in Saskatoon, using the Soft X-ray Micro Characterization Beamline (SXRMB). Si(111) crystals were used as monochromator, with an energy resolving power of 104. The energy calibration of the beamline is regularly checked at the P K-edge (2152.4 eV) by recording reference spectra of pure Na4P2O7 powder in the spectral range from 2130 to 2210 eV. The samples were mounted on a sample holder and fixed using a double-sided conducting carbon tape. The pressure supplied in the vacuum chamber was approximately 10−8 mbar.
The fluorescence yield (FY) data were recorded using a Si–Li drift detector. For the Zr L2-edge, the energy range between about 2280 eV and 2340 eV was scanned. Likewise, for the Y L2-edge, the energy range between about 2130 eV and 2180 eV and for the Y L3-edge, the energy range between about 2050 eV and 2110 eV was scanned, whereas for the Si-K edge, the energy range between 1820 eV and 2000 eV was investigated. The FY data were normalized to the incident beam intensity (I0). For the Zr L2- and Y L2,3-edges, the data were background subtracted using the commercially available software UNIFIT 2014,23 where an atan((E − Es)/βs) approach is used to describe the background at the edge jump, with the photon energy E, the edge position Es and the FWHM of the step 2βs. For the Si K-edge, the data was normalized to the average absorption coefficient after the edge crest (>1880 eV). The total electron yield (TEY) data were measured in parallel to the FY, by collecting the sample drain current. However, for this study on glasses and volume-crystallized glass-ceramics, the FY data are presented since the probing depth of the TEY is in the range of approximately 1–10 nm only.24 Thus, using the FY with a probing depth of a few 100 nm is considered more representative for the samples under investigation, since surface-near effects (e.g., surface crystallization effects, which do not represent the state of the bulk sample, where volume crystallization is taking place) might influence the TEY results. Although the data measured in FY is prone to self-absorption effects, this is considered less problematic in the scope of this study, especially for the analyses of Y and Zr, since the contents of these elements in the sample volume are comparably low. The only case where the TEY data was considered more representative than the FY data (since the latter in this case most probably suffers from self-absorption within the sample) concerns the Y L2,3-spectra of the Y2O3 standard reference.
XANES measurements of the Al L2,3-edges were performed at the Canadian Light Source (CLS) in Saskatoon as well, using the Variable Line Spacing-Plane Grating Monochromator (VLS-PGM) beamline, with an energy resolution of ∼0.05 eV.25 The samples were mounted on the sample holder with double-sided conducting carbon tape. The pressure in the vacuum chamber was approximately 5 × 10⁻⁸ mbar. The fluorescence yield (FY) data for the Al L2,3-edges were recorded using a microchannel plate detector26 between 70 eV and 90 eV. The data was normalized to the incident beam intensity (I0) that was measured with a Ni mesh. The energy calibration of the beamline is regularly checked by recording reference spectra of pure AlPO4 and γ-Al2O3 in the spectral range from 75 to 84 eV. The background correction and normalization of the Al L2,3-edge XANES data was done using the software Athena by setting the pre-edge to “0” and post-edge to unity. All data was treated in the same way except for the samples of glass A, glass-ceramic A1, and glass-ceramic B1, as the spectra of these samples could not reliably be normalized using Athena. For these samples, it is believed that self-absorption effects and/or sample charging have led to the noticeable distortion of these spectra. However, as the XANES interpretation of the Al L2,3-edge data is of qualitative nature only, it was decided to present the “as-is” spectra for these three samples, therefore enabling a fair comparison to the spectra of the other samples. In order to aid the comparison of the data, these three distorted or partially distorted spectra were normalized with the maximum intensity within the spectral region of interest set as “1”, and the lowest intensity set as “0”.
The following references were used: (i) Y2O3 (Merck KGaA) containing Y in a distorted six-fold coordination, (ii) natural μ-cordierite samples containing Al in a four-fold coordination and (iii) a natural spinel (MgAl2O4) sample containing Al in a six-fold coordination. Concerning the coordination of Zr, comparisons are made to previously gained XANES data of ZrO2 – nucleated MAS glass-ceramics.5,6
Analytical scanning TEM (STEM) analyses of the MAS glass-ceramics were performed on an FEI Titan3 80–300 electron microscope at 300 kV acceleration voltage. Images were obtained using a ring-shaped high-angle annular dark field (HAADF) detector (Fischione Model 3000), whose signal intensity is proportional to the number of (mainly inelastically) scattered electrons that hit the detector after getting scattered at sample atoms. In combination with energy dispersive X-ray analysis (EDX) using a Super-X EDX detector equipped with four SDD detectors (FEI company), the distribution of different elements of chosen samples was recorded, using the commercially available software Esprit. Element mappings were derived by evaluating the lateral distribution of the peak intensity, i.e. the area underlying the Kα edges of the analyzed elements, with an automatic routine provided by the software. The STEM sample preparation was done by a purely mechanical wedge-polishing routine, followed by a low-energy (2.5 keV) Ar+ broad beam final milling step (precision ion polishing system PIPS, Gatan company) to reach electron transparency as well as to remove any residues from the mechanical polishing step.
Results and discussion
The course of crystallization for both sample sets was followed and described using XRD and analytical (S)TEM techniques. These results are only briefly discussed here since the focus of this work is on the XANES results. Thorough presentations of the XRD and (S)TEM results of these samples have been published previously, they are, nevertheless, summarized and recapitulated in the following in order to complete the picture of the crystallization processes that is drawn within this study.5,6X-ray diffraction
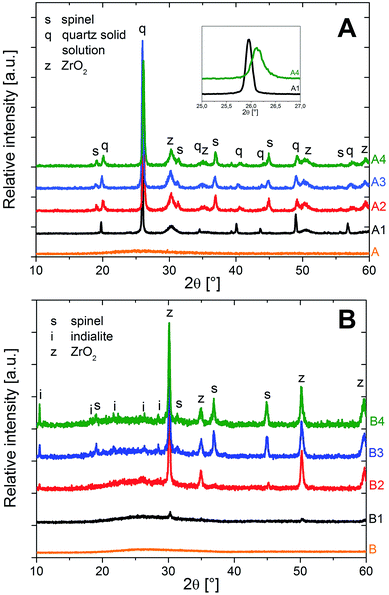
Fig. 1 shows the XRD patterns of the glasses and the crystallized samples, according to the results already published in an earlier study.5 While the glasses A and B are X-ray amorphous, the sample A1 (without Y2O3), thermally treated at 950 °C for 5 h, shows peaks attributable to the high quartz solid solution, and cubic or tetragonal ZrO2 (JCPDS no. 50-1089) phases. The latter two phases cannot be distinguished taking into account the only very small distortion of the tetragonal phase and the line broadening due to the small size of the crystallites. However, the occurrence of monoclinic ZrO2 can be excluded. The [101] peak of the high quartz solid solution at 2θ = 25.9° (JCPDS no. 25-0511) is the most intense one, indicating that the high quartz solid solution is the main crystal phase. The samples A2, A3 and A4, crystallized in a second step at 1060 °C for different times (0/0.5/1 h) show additional peaks that are attributable to spinel (JCPDS no. 21-1152). With longer times of the second crystallization step, the [101] peak of the quartz solid solution is shifted, from 2θ ≈ 25.9° to 26.2°, thus indicating the presence of the low-temperature α-quartz solid solution phase (JCPDS no. 33-1161) after sample cooling. This effect was often reported in the literature:1–5 the high-temperature β-quartz solid solution can be stabilized versus the transformation to the low-temperature α-quartz phase by incorporations of large volume fractions of MgO and Al2O3.1 However, after crystallization for longer times or at higher temperatures, this phase can be depleted from these additives via the formation of spinel (MgAl2O4) as secondary crystalline phase, which in turn allows the transformation to the low-temperature α-quartz solid solution during cooling.1–3 This is evidenced in these samples when comparing sample A1, which according to XRD incorporates β-quartz solid solution, yet not spinel, to the samples A2–A4, where spinel has already crystallized and after sample cooling, the quartz solid solution has transformed into the low-temperature, trigonal α-quartz solid solution phase.In the XRD patterns of sample B1, peaks of minor intensity at ca. 2θ = 31, 35, 51 and 60° are observed. They are attributable to tetragonal or cubic ZrO2. In the XRD pattern of sample B2, the same peaks attributable to ZrO2 are observed. Furthermore, some small peaks indicate the presence of spinel and indialite (Mg2Al4Si5O18, JCDPS no. 75-1439). The latter is proved by the very specific peak at 2θ = 10.2°. In samples B3 and B4, which after thermal treatment at 950 °C for 5 h were heated to 1060 °C for 0.5 or 1 h, distinct lines of ZrO2, spinel and indialite are found. After crystallization for 1 h at 1060 °C (sample B4), the intensity of the indialite peak at 2θ = 10.2° is notably higher. It should be noted that peaks due to the quartz solid solution, especially the characteristic [101] peak at ca. 2θ = 26° are not observed in any of the studied Y2O3 – containing samples, indicating the absence of the quartz solid solution therein.
Scanning transmission electron microscopy
Fig. 2 shows a STEM micrograph of sample A3, obtained with an high-angle annular dark-field (HAADF) detector, in addition with EDX-based element distribution mappings. In the HAADF micrograph, the contrast is sensitive to the atomic mass of the respective sample position (z-contrast imaging).27 Zr is the heaviest atom species in this composition and, hence, appearing very bright in the micrograph. As has already been described previously, the bright, star-shaped areas with diameters of ≈100 nm are ZrO2 crystals that precipitate first during crystallization and act as nucleation seeds for a subsequent growth of the quartz solid solution.16 Furthermore, a large number of very small (diameter ≈ 3–5 nm), spherical ZrO2 crystals is visible as well. It was found that these small ZrO2 crystals precipitate during crystal growth of the quartz solid solution, as they are continuously “spat out” by the growing quartz solid solution in whose crystal lattice they do not incorporate.5,16 The EDXS element distribution mapping of Zr unambiguously underlines this finding. Additionally, it is found that some areas show a diffuse, bright contrast in the HAADF micrograph, preferably at the domain boundaries of the quartz solid solution areas. The EDXS mappings show that these areas are enriched in Mg and Al, while the concentration of Si is reduced there. In combination with the XRD results that indicate the presence of spinel (MgAl2O4) in these samples, it can be concluded that the spinel is forming at the domain boundaries of the quartz solid solution,5 which seems comprehensible as the spinel crystallizes after the quartz solid solution. As the quartz solid solution is already present before spinel crystallizes, and as the spinel formation is related to a depletion of Mg and Al out of the quartz solid solution, a spinel precipitation at the outer rim of the quartz solid solution domains should be expected. Additionally, it can be seen that an enrichment of Al, Mg and Si is not only found at the outer domain boundaries of the quartz solid solution, yet also in direct vicinity of the comparably large, star-shaped ZrO2 crystals which have been described to act as nucleation centers for the quartz solid solution precipitation. This indicates that the quartz solid solution is not precipitating (e.g., epitaxially) directly at the ZrO2 crystal, yet some 10 nm further away from the latter, in good accordance with the previous finding that the star-shaped ZrO2 seed crystals are surrounded by a Zr-depleted zone, behind which the quartz solid solution follows up to expand into the sample bulk.16 Thus, the spinel is not only forming at the outer rim of the quartz solid solution domains, yet also inside the latter, since in this picture, the quartz solid solution domains incorporate a “hollow”, non-crystallized core, consisting of the star-shaped ZrO2 nucleus and its Zr-depleted surrounding – and the depletion of the quartz solid solution in both Mg and Al will then run inwards and outwards the quartz solid solution domain in parallel.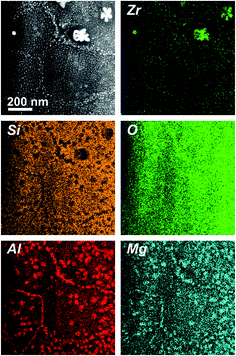 | ||
| Fig. 2 STEM-HAADF micrograph (upper left panel) and respective element mappings of Al, Si, Zr, Mg and O of the (Y2O3-free) sample A3. | ||
Fig. 3 shows a STEM micrograph (HAADF) and EDXS element distribution mappings of the respective elements of sample B4. In contrast to the glass-ceramics of sample set A, in the glass-ceramics of the samples B, the ZrO2 crystals are dendritic and comparably large – the lengths of the long axis of those dendrites are up to a few μm. In good accordance with the XRD results, quartz solid solution crystals are not detected with STEM. Furthermore, Mg and Al (as “marker elements” for spinel, which is present in the samples according to XRD) are enriched in the surroundings of the ZrO2 dendrites, while Si is absent at these positions. Apparently, spinel envelopes the dendritic ZrO2 crystals,5 whereas the Si element map shows the location of the residual glass in those samples. Although XRD indicates the presence of indialite in the glass-ceramic samples B, it is not found with STEM. However, this is not surprising since indialite is prone to precipitate from MAS glasses via surface crystallization,8 yet the STEM samples were prepared from the sample bulk, far from the surface.
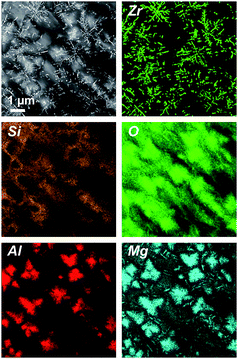 | ||
| Fig. 3 STEM-HAADF micrograph (upper left panel) and respective element mappings of Al, Si, Zr, Mg and O of sample B4 (with Y2O3). | ||
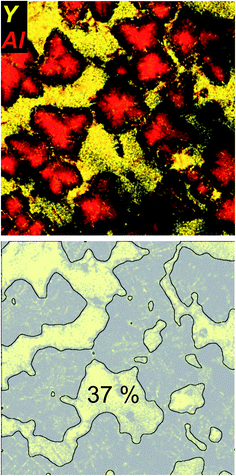
Fig. 4 shows the EDXS element distribution mappings of Y and Al of the same sample area as shown in Fig. 3 in a combined representation. Y is not incorporated in the spinel crystals, and no other Y-bearing crystal phases could be detected with XRD (cf.Fig. 1), apart from the ZrO2 crystals that, according to the EDX data, seem to incorporate a small amount of Y, most likely forming yttria-stabilized zirconia.28 Thus, it can be concluded that the vast majority of the yttria which is present in the samples is restricted to the residual glassy phase within the glass-ceramic samples B. As seen in the combined EDX element mapping of both Y (as “marker element” for the residual glass) and Al (as “marker element” for spinel), Y is located in areas where Al is sparsely found and vice versa. As shown in previous publications,5 in sample set B, it is found that with ongoing crystallization temperature and time (samples B1–B4), the spinel crystals expand further into the sample volume, leading to a decreasing volume of the residual glassy matrix. The growth of MgAl2O4 is accompanied by a steady decrease of the Al and Mg concentration in the residual glass, in contrast to a continuous increase of the yttria concentration within the residual glass, that is as high as 16 mol% in sample B4, in comparison to the 2.4 mol% in the non-crystallized green glass B.5 Although smaller than at earlier heat treatment stages B1–B3, the lateral area of the Y-containing residual glass is still comparably large in the sample B4. This area was estimated by simple image processing of the Y element distribution mapping micrograph that is shown in Fig. 4 with the software ImageJ (http://imagej.nih.gov/ij/) by applying a Gaussian Filter, using the “subtract background” tool of the software, followed by binarization and simple area analysis. As shown in Fig. 4, this results in an estimated residual glass of 37% for this two-dimensional projection of the STEM – analysed sample. Assuming that this analysis is representative for the three-dimensional sample, it can be estimated that roughly 1/3 of the sample volume of glass-ceramic sample B4 consists of residual glass that is strongly enriched in yttria. Apparently, the volume fraction of the residual glass within the Y2O3-containing glass-ceramic samples B free of the quartz solid solution is much larger than that of the quartz-solid solution containing, Y2O3-free glass-ceramic samples A. In the latter, the residual glassy phase is constituted by the small pockets and junctions in-between the adjacent quartz solid solution domains, where it additionally competes for space with the spinel that precipitates at higher temperatures and longer annealing times (samples A2–A4).
X-ray absorption near-edge structure spectroscopy
Fig. 5 shows the XANES spectra of the Zr L2-edge of both sample sets A and B before and after the crystallization. Two well-resolved features, corresponding to the 2p → 4d transitions, can be observed, at ≈2309 and 2312 eV. In the spectra of the glasses A and B, the peak at 2309 eV is more intense than that at 2312 eV, representing a 6-fold coordination of Zr in both MAS glasses, in good accordance with previous results.29 The crystallized samples of the composition A show a shift of the absorption edge maxima to lower energies, indicating an increasing coordination number of Zr4+.29,30 The crystallization of ZrO2 runs parallel to a change in the coordination number: while Zr4+ is incorporated in the glass network in 6-fold coordination, it is 8-fold coordinated in tetragonal and cubic zirconia.29 The spectra of the samples A1 to A4 (in Fig. 4, only the spectra of A1 and A4 are shown for clarity) are almost identical and in good accordance to previously published spectra of MAS glass-ceramic samples of the same composition (though crystallized with a different heat treatment scheme) in which all Zr has transformed into ZrO2.29 This indicates that the transformation of the local environment of Zr from 6-fold coordinated and amorphous (in the glass) to 8-fold coordinated and crystalline (in ZrO2) is already completed after the first step of the heat treatment at 950 °C for 5 h (sample A1). This goes well with the results from the XRD and STEM analyses, showing that the crystallization of ZrO2 is already completed after this stage of heat treatment. Note that according to previously published results, Zr4+ was not detected in the small amounts of residual glassy phase after complete crystallization of MAS glass-ceramics from a sample set similar to the glass-ceramic samples A used here5 – a finding that underlines that the existence of only 8-fold Zr in the glass-ceramic samples is an indication for the absence of Zr in the residual glassy phase of these samples.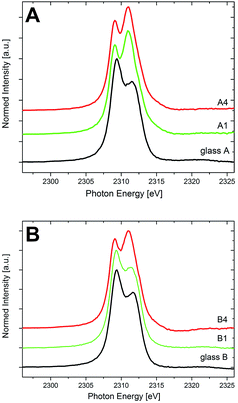 | ||
| Fig. 5 XANES spectra of the Zr-L2 edge of the glasses and the crystallized samples of the compositions (A) and (B). | ||
The shape of the Zr L2-spectrum of glass B is almost identical to that of glass A. Hence, it can be concluded that in both glasses (with and without the addition of Y2O3), Zr4+ ions are 6-fold coordinated. However, in sample set B, the change of the spectral features due to the annealing procedure (i.e., an increase of the intensity of the feature at ≈2312 eV at the expense of the intensity of the feature at ≈2309 eV) that indicates a shift from the 6-fold coordination of Zr (within the vitreous surrounding) to an 8-fold coordination (due to the crystallization of ZrO2) is not as abrupt as it is for sample set A. Whereas in the quartz solid solution-forming samples A, all Zr has transformed to ZrO2 and is thus present in 8-fold coordination after the first heat treatment step already (sample A1), for the sample set B it is found that even after the last heat treatment step (sample B4), the Zr L2-XANES spectrum is not indicating a solely 6-fold or 8-fold coordination. Indeed, from previous analytical data it is known that for the Y2O3-containing glass-ceramic samples, even at the last heat treatment stage, in sample B4 a certain amount of ZrO2 can still be found within the residual glass, in contrast to the quartz solid solution-forming, non-Y2O3 containing glass-ceramic samples A, in which all Zr transforms into ZrO2. The amount of Zr (in at%) that can be found within the residual glass of sample B4 is roughly 2.7%, whereas in the glass B, it is 4.5%.5 Together with the above-calculated volume fraction of the residual glassy phase of approximately 37% (see Fig. 4), a percentage of Zr4+ in the residual glassy phase of approximately (2.7/4.5) × 0.37 = 22% can be calculated for sample B4. Considering the multiple pieces of experimental information that were used to estimate this figure, an estimated error of at least ±4% appears adequate, leading to a Zr4+ – percentage of ≈(18–26)% in the residual glass of sample B4.
Indeed, it is found that the Zr L2-spectrum of sample B4 is almost perfectly fitted by a simple linear combination of 25% of glass B (representing Zr4+ in 6-fold coordination) and 75% of sample A4 (representing Zr4+ in 8-fold coordination in crystalline ZrO2), as is shown in Fig. 6. As can be seen, the XANES data as well as the STEM-EDXS data complement each other fairly well – from both methods, the conclusion can be drawn that whereas in the Y2O3-free MAS glass-ceramics A, all Zr transforms into ZrO2 upon annealing, only ≈75% of the Zr crystallizes as ZrO2 within the quartz solid solution-free glass-ceramics B when the same annealing scheme is applied. Additionally, the conclusion can be drawn that although the composition of the residual glass changes drastically with respect to the green glass composition,5 the coordination of Zr within this MAS residual glass remains 6-fold, just as it is in the MAS green glass B.
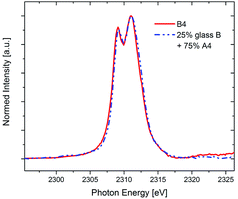 | ||
| Fig. 6 XANES spectra of the Zr-L2 edge of the glass-ceramic B4 compared with a linear combination of 25% glass B (6-fold coordinated) and 75% A4 (completely 8-fold coordinated). | ||
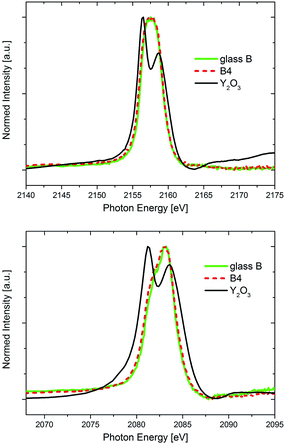
In Fig. 7, the Y L2- and Y L3-XANES spectra (corresponding to the 2p → 4d transitions) of glass B and the glass-ceramic B4 are shown in comparison to those of an Y2O3 powder reference. The spectra of both glass and glass-ceramic sample are identical, indicating that no shift of neither valency nor coordination is observed for Y. The crystalline Y2O3 powder reference sample Y L2,3-XANES spectra look different, with two clearly resolved spectral features at both edges. It should be noted that crystalline Y2O3 has the space group Ia![[3 with combining macron]](https://www.rsc.org/images/entities/char_0033_0304.gif) .31 As such, the spectra with the two distinct features are representative for a crystalline sample with Y in a distorted 6-fold coordination. However, these two clearly distinct, ligand-field splitting related spectral features which appear in the Y L2,3-XANES of the Y2O3 reference are not seen for the glass and glass-ceramic samples. Especially the Y L2-edge shape is quite uniform, and only a small shoulder appears at the low-energy side of the Y L3-spectrum that might indicate the existence of multiple spectral features there. Thus, it cannot be concluded with certainty that the Y coordination in both glass and glass-ceramic samples is 6-fold, as it is in Y2O3. Rather, the absence of the two spectral features in the Y L2,3-XANES spectra of the glass and glass-ceramic samples might indicate that Y in these samples exists in a more amorphous environment, since the ligand field splitting – that leads to the two distinct features in the crystalline Y2O3 reference sample – is not resolved. This interpretation underlines the STEM-EDXS finding that most of the Y within the sample set B is enriched in the residual glass of the glass-ceramics, with ever-increasing content if annealing time and/or temperature are raised.5 On the other hand, as discussed previously it might well be that a small portion of the Y is incorporated within the ZrO2 dendrites in form of YSZ, which would then result in the presence of a small amount of 8-fold Y in the samples as well.
.31 As such, the spectra with the two distinct features are representative for a crystalline sample with Y in a distorted 6-fold coordination. However, these two clearly distinct, ligand-field splitting related spectral features which appear in the Y L2,3-XANES of the Y2O3 reference are not seen for the glass and glass-ceramic samples. Especially the Y L2-edge shape is quite uniform, and only a small shoulder appears at the low-energy side of the Y L3-spectrum that might indicate the existence of multiple spectral features there. Thus, it cannot be concluded with certainty that the Y coordination in both glass and glass-ceramic samples is 6-fold, as it is in Y2O3. Rather, the absence of the two spectral features in the Y L2,3-XANES spectra of the glass and glass-ceramic samples might indicate that Y in these samples exists in a more amorphous environment, since the ligand field splitting – that leads to the two distinct features in the crystalline Y2O3 reference sample – is not resolved. This interpretation underlines the STEM-EDXS finding that most of the Y within the sample set B is enriched in the residual glass of the glass-ceramics, with ever-increasing content if annealing time and/or temperature are raised.5 On the other hand, as discussed previously it might well be that a small portion of the Y is incorporated within the ZrO2 dendrites in form of YSZ, which would then result in the presence of a small amount of 8-fold Y in the samples as well.
Fig. 8 shows the XANES spectra recorded at the Si K-edge at energies in the range from 1825 and 1890 eV for the compositions A and B. The main peak occurs at around 1849 eV for all studied samples, thus indicating the 4-fold coordination of Si in SiO4 tetrahedra for all samples. The spectrum of glass A resembles the typical features that are found in SiO2 glasses: the main edge feature (white line) around 1849 eV, related to the 1s → 3d transition, and a rather broad peak at around ≈1860–1870 eV.32 The latter peak is related to 1s → 3d/p transitions and its intensity is related to the Si–O–Si angle in the SiO4 tetrahedra.33 Once the samples are annealed and the quartz solid solution is formed, further peaks arise at the high-energy side of the main feature in the spectra of the samples of sample set A, exemplified by the spectra of samples A1 and A4 as shown in Fig. 8. These peaks arise at ≈1852 eV and at ≈1855 eV. The former has been explained by multiple scattering from the structure behind the first coordination sphere, the latter has also been related to 1s → 3d/p transitions.24,32 These spectral features between ≈1850 and 1860 eV are specifically indicating the occurrence of crystalline SiO2 polymorphs, as they are not found for SiO2 in amorphous environments such as SiO2 glass.32 Hence, they indicate the annealing-induced formation of quartz or quartz solid solutions in the sample set A and thus underline the XRD and STEM analyses, which also show the presence of the quartz solid solution in these samples.
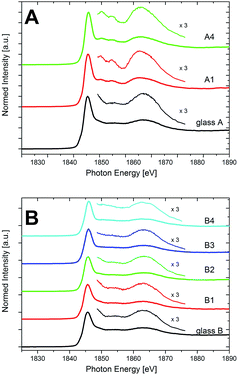 | ||
| Fig. 8 XANES spectra of the Si-K edge of the glasses and the crystallized samples of the compositions (A) and (B). | ||
The spectrum of glass B, just as that of glass A, shows no defined features at the high-energy side of the main edge feature at ≈1849 eV and before the broad peak between ≈1850 and 1860 eV. Unlike as for sample set A, this does not change with annealing, as the spectra of samples B1–B4 in Fig. 8 show. Thus, in accordance with the XRD and STEM-EDXS data, no indication of a quartz or quartz solid solution precipitation is found in these Y2O3-containing samples, and Si (just like Y, as discussed above) rather keeps an amorphous environment in sample set B. It can be observed, though, that the high-energy side of the main feature in the spectra of samples B exhibits a shoulder between ≈1849 and 1852 eV, that flattens with increasing annealing time and temperature. This shoulder has been described for different types of silicate glasses.24 Especially for alkaline-earth containing glasses, it was described to indicate changes in the medium range order of silicon, initiated by the presence of network modifiers.34 In sample set B, from STEM-EDXS it is known that the Y concentration in the residual glassy phase increases strongly with the increase of annealing temperature and time from sample B1–B4, whereas likewise, the content of Mg and Al steadily decreases.5 Thus, the change of the shoulder in the spectra might indicate the change of the composition of the residual glassy phase as a result of the thermal treatment. Finally, it can be observed that the main feature of the spectra of sample set B is slightly shifted by ≈0.4 eV to higher energies during the course of crystallization. According to Li et al.,35 this shift might be an indication of a shortening of the Si–O bond distance in the glass. Although this is just a qualitative explanation, it goes along with the STEM-observed decrease of the volume density of the glassy phase in the samples with ongoing heat treatment, whereas the density of the residual glass itself increases due to a strong increase of the Y content therein.5
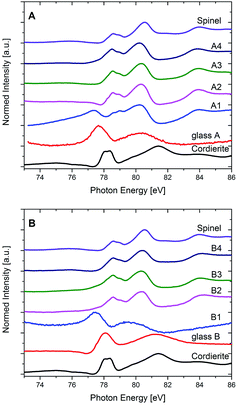
In Fig. 9, XANES spectra recorded at the Al L2,3-edge of all studied samples together with the spectra of μ-cordierite and spinel as reference samples for Al in 4-fold (μ-cordierite) and 6-fold (spinel) coordination are shown. As already described in the Experimental section, it has to be kept in mind that the spectra of the samples from glass A, A1 and B1 are presented in their pristine form in Fig. 9, since a normalization according to the routine that was applied for all other samples led to no reliable results in that case. However, this does not affect the following discussion of the results, since it is of qualitative nature only.
The Al L2,3-edge of glass A is characterized by a broad feature at ≈77–78 eV and another even broader feature at ≈79–81 eV directly behind. In good correlation to published data of reference materials with Al in 4-, 5- and 6-fold coordinated environments, as well as in mixed coordination states,36 a 4-fold coordination of the Al3+ within the glass is indicated. It must be noted that the spectrum of glass A, although similar to that of the crystalline μ-cordierite reference, differs from the latter as its features are less pronounced and the onset of the Al L2,3-edge is shifted toward lower energies. These differences are most likely reflecting the distinction between a crystalline sample with a perfect 4-fold Al environment (μ-cordierite) and a glass, in whose amorphous environment that lacks a long-range order, Al is preferably 4-fold coordinated, yet local discrepancies might occur to a certain extent. The spectra of sample A1 shows features that are typical for the 4-fold coordinated Al as it is present in the glass and in the μ-cordierite sample, i.e., a first feature that appears at ≈77 eV. However, it also shows features that are rather representing a 6-fold coordination, as they are found in the spinel reference sample, such as a double-peak feature at around 78 eV (due to spin–orbit splitting of the Al 2p level), a major peak between ≈79 and 81 eV and a further feature at higher energies, at about 84 eV. Thus, it is likely that Al is present in both coordination states in sample A1: 4-fold, as it should be expected in the β-quartz solid solution (with a composition close to that of μ-cordierite), yet also 6-fold, although no spinel has been crystallized in this sample at this annealing stage according to XRD results. From STEM-EDXS results it is known that the spinel in these samples is preferably crystallizing at the outer (and inner) rim of the quartz solid solution at later annealing stages (samples A2–A4), while the quartz solid solution itself gets depleted in Al and Mg at the same time. Hence, the finding that 6-fold coordinated Al already exists in sample A1, might indicate that although spinel is not yet formed, the diffusion of Al (and probably also Mg) from the interior of the quartz solid solution towards its exterior is already taking place at this annealing stage, and it is most probably accompanied by a change of the coordination of the Al3+ ions from 4-fold in the quartz solid solution crystal lattice to 6-fold at the outer rim of the quartz solid solution, where later on the spinel precipitates. On the other hand, the presence of 6-fold coordinated Al in sample A1 might also be an indication that the Al coordination in the residual glass pockets between the quartz solid solution domains is 6-fold and has thus changed with respect to the glass A, where Al is 4-fold coordinated.
The Al L2,3-edge spectra of samples A2–A4 are nearly identical and in good correlation with the spinel reference spectrum. It can therefore be concluded that Al is mainly six-fold coordinated in sample set A once spinel has formed. Hence, most of the Al in these samples is incorporated in the spinel phase, which underlines the XRD-observed transformation of the main crystalline phase, from β-quartz solid solution to α-quartz solid solution – a depletion of the β-quartz solid solution in both Al and Mg is a prerequisite for this.
As seen in Fig. 9, the Al L2,3-edge spectrum of the Y2O3-containing glass composition B indicates a 4-fold Al coordination as well. Shape and energetic position of the main features are even closer to the 4-fold μ-cordierite reference here as it is the case for glass A. In sample B1, the Al is still in an amorphous environment, as at this annealing stage in the Y2O3-containing glasses, only ZrO2 has developed as crystalline phase, yet no precipitation of quartz solid solution is found, as can be seen in the XRD or STEM-EDXS results presented earlier. The Al L2,3-XANES spectrum of sample B1 has nevertheless changed with respect to that of glass B. As Fig. 9 shows, the main features have shifted to lower energies, very much as it is the case for glass A in comparison to the μ-cordierite reference spectrum. This indicates that although the overall Al coordination stays 4-fold for sample set B at the first annealing stage, the short-range order in the glass is changed notably once ZrO2 has crystallized and the composition of the residual glass has therefore changed. The similarity of the spectra of samples B2–B4 with the reference spectrum of spinel is remarkable and shows that since a heat treatment at higher temperatures (1060 °C) leads to the growth of spinel as second crystalline phase in the glass-ceramics of the Y2O3-containing type B, most of the Al is then present in 6-fold coordination.
Conclusions
The effect of the addition of 2.5 mol% Y2O3 to the crystallization behaviour of a glass with the mol% composition of 51.9SiO2/21.2MgO/21.2Al2O3/5.6ZrO2 was studied. In the Y2O3-containing glass, strong differences in the microstructure and in the phase composition are observed in comparison to the glass without the addition of Y2O3 after an appropriate two-stage heat treatment at 950 °C for 5 h and at 1060 °C for 0–1 h. While the main crystal phase is the quartz solid solution in the Y2O3-free glass-ceramics, this phase is not detected in the Y2O3-containing glass-ceramics in the XRD and STEM analyses. Here, only the occurrence of dendritic ZrO2 crystals and spinel via volume crystallization, as well as a minor indialite concentration that most likely crystallizes in the surface-near sample regions only, are observed. The main focus of the present study was on XANES measurements at the Zr L2-, Y L2,3-, Si K- and Al L2,3-edge. The evaluation of the Zr L2-edge spectra shows that while for the Y2O3-free samples, the Zr coordination experiences an abrupt shift from 6-fold in the glass to 8-fold in the glass-ceramics due to the complete crystallization of ZrO2, in the Y2O3-containing samples this is not the case. There, a certain amount of Zr4+ remains 6-fold coordinated in the residual glass after the heat treatment. The Si K-edge spectra of the Y2O3-free samples reflect the quartz solid solution formation therein, whereas in the Y2O3-containing samples, any spectral features that indicate the presence of crystalline quartz solid solution are missing. The Y L2,3-edge spectra of the Y2O3-containing samples show that the valency and coordination of Y does not change upon the heat-treatment induced crystallization, and underline the finding that Y is present in the glass as well as in the glass-ceramic samples in a mostly amorphous environment. Finally, the analysis of the Al L2,3-XANES shows that in both sample sets with and without Y2O3, the initially 4-fold Al coordination in the glasses changes into 6-fold once spinel is forming in both sample types, soaking up the majority of the Al that is present in the samples.Acknowledgements
This work was supported by the German Research Foundation (DFG) under the research grant No. Ru 417/17-1 and Ho 1691/6-1, and by a PPP Canada travel grant from the German Academic Exchange Service (DAAD), project No. 57127505. Research described in this paper was performed at the Canadian Light Source, which is supported by the Canada Foundation for Innovation, Natural Sciences and Engineering Research Council of Canada, the University of Saskatchewan, the Government of Saskatchewan, Western Economic Diversification Canada, the National Research Council Canada, and the Canadian Institutes of Health Research.References
- P. Wange, T. Höche, C. Rüssel and J.-D. Schnapp, J. Non-Cryst. Solids, 2002, 298, 137–145 CrossRef CAS.
- M. Dittmer, M. Müller and C. Rüssel, Mater. Chem. Phys., 2010, 124, 1083–1088 CrossRef CAS.
- M. Dittmer and C. Rüssel, J. Biomed. Mater. Res., Part B, 2012, 100, 463–470 CrossRef PubMed.
- M. Dittmer, C. F. Yamamoto, C. Bocker and C. Rüssel, Solid State Sci., 2011, 13, 2146–2153 CrossRef CAS.
- A. Gawronski, C. Patzig, T. Höche and C. Rüssel, CrystEngComm, 2013, 15, 6165–6176 RSC.
- A. Gawronski and C. Rüssel, J. Mater. Sci., 2013, 48, 3461–3468 CrossRef CAS.
- A. Gawronski, C. Patzig, T. Höche and C. Rüssel, J. Mater. Sci., 2015, 50, 1986–1995 CrossRef CAS.
- N. Diaz-Mora, E. D. Zanotto, R. Hergt and R. Müller, J. Non-Cryst. Solids, 2000, 273, 81–93 CrossRef CAS.
- S. Berndt, A. Gawronski, C. Patzig, W. Wisniewski, T. Höche and C. Rüssel, RSC Adv., 2015, 5, 15164–15171 RSC.
- C. Bocker, M. Kouli, G. Völksch and C. Rüssel, J. Mater. Sci., 2014, 49, 2795–2801 CrossRef CAS.
- W. Wisniewski, C. A. Baptista, M. Müller, G. Völksch and C. Rüssel, Cryst. Growth Des., 2011, 11, 4660–4666 CAS.
- H. Shao, K. Liang, F. Zhou, G. Wang and A. Hu, Mater. Res. Bull., 2005, 40, 499–506 CrossRef CAS.
- W. Zdaniewski, J. Mater. Sci., 1973, 8, 192–202 CrossRef CAS.
- W. Zdaniewski, J. Am. Ceram. Soc., 1975, 58, 163–169 CrossRef CAS.
- C. Patzig, M. Dittmer, A. Gawronski, T. Höche and C. Rüssel, CrystEngComm, 2014, 16, 6578–6587 RSC.
- C. Patzig, M. Dittmer, T. Höche and C. Rüssel, Cryst. Growth Des., 2012, 12, 2059–2067 CAS.
- A. Hunger, G. Carl, A. Gebhardt and C. Rüssel, J. Non-Cryst. Solids, 2008, 354, 5402–5407 CrossRef CAS.
- A. Hunger, G. Carl and C. Rüssel, Solid State Sci., 2010, 12, 1570–1574 CrossRef CAS.
- W. Vogel, Glass chemistry, Springer, Berlin, 2rd edn, 1994 Search PubMed.
- K. Singh, N. Gupta and O. P. Pandey, J. Mater. Sci., 2007, 42, 6426–6432 CrossRef CAS.
- I. P. Alekseeva, O. S. Dymshits, A. A. Zhillin, M. D. Mikhailov and A. A. Khubetsov, Glass Phys. Chem., 2015, 41, 597–606 CrossRef CAS.
- J. F. Shakelford and W. Alexander, Materials science and engineering handbook, CRC Press, Boca Raton, 3rd edn, 2001 Search PubMed.
- R. Hesse, UNIFIT2014, www.unifit-software.de Search PubMed.
- G. S. Henderson, F. M. F. de Groot and B. J. A. Moulton, Rev. Mineral. Geochem., 2014, 78, 75–138 CrossRef CAS.
- Y. F. Hu, G. Wrigth, R. Igarashi, M. McRibben, T. Wilson, S. Y. Chen, T. Johnson, D. Maxwell, B. W. Yates, T. K. Sham and R. Reininger, Rev. Sci. Instrum., 2007, 78, 083109 CrossRef CAS PubMed.
- M. Kasrai, Z. Yin, G. M. Bancroft and K. H. Tan, J. Vac. Sci. Technol., A, 1993, 11, 2694–2699 CAS.
- D. B. Williams and C. B. Carter, Transmission Electron Microscopy – A Textbook for Materials Science, Springer, New York, 2nd edn, 2009 Search PubMed.
- J. R. Kelley and I. Denry, Dent. Mater., 2008, 24, 289–298 CrossRef PubMed.
- C. Patzig, M. Krause, T. Höche, M. Dittmer, A. Gawronski, C. Rüssel, Y. Hu, H. Ikeno, I. Tanako and G. S. Henderson, J. Non-Cryst. Solids, 2014, 384, 47–54 CrossRef CAS.
- G. E. Brown, G. Calas, G. A. Waychunas and J. Petiau, Rev. Mineral., 1988, 18, 431–512 CAS.
- F. Hanic, M. Hartmanova, G. G. Knab, A. A. Urusovskaya and K. S. Bagdasarov, Acta Crystallogr., Sect. B: Struct. Sci., 1984, 40, 76–82 CrossRef.
- D. Li, G. M. Bancroft, M. Kasrai, M. E. Fleet, R. A. Secco, X. H. Feng, K. H. Tan and B. X. Yang, Am. Mineral., 1994, 79, 622–632 CAS.
- I. Davoli, E. Paris, S. Stizza, M. Benfatto, M. Fanfoni, A. Gargano, A. Bianconi and F. Seifert, Phys. Chem. Miner., 1992, 19, 171–175 CrossRef CAS.
- G. S. Henderson and C. J. St-Amour, Chem. Geol., 2004, 213, 31–40 CrossRef CAS.
- D. Li, G. M. Bancroft, M. E. Fleet and X. H. Feng, Phys. Chem. Miner., 1995, 22, 115–122 CAS.
- C. Weigel, G. Calas, L. Cormier, L. Galoisy and G. S. Henderson, J. Phys.: Condens. Matter, 2008, 20, 135219 CrossRef.
Footnotes |
| † Now with: Department of Electronics and Computer Science, University of Southampton, University Road, Southampton SO17 1BJ, Great Britain. |
| ‡ Now with: Barberini GmbH, Hüttenstraße 1, 31073 Grünenplan, Germany. |
| This journal is © The Royal Society of Chemistry 2016 |

