Enhancement of lipase activity for the oily wastewater treatment by an electrostimulation process
A.
Adibzadeh
a,
A.
Rezaee
 *a and
Z.
Salehi
b
aDepartment of Environmental Health Engineering, Faculty of Medical Sciences, Tarbiat Modares University, Tehran, Iran. E-mail: rezaee@modares.ac.ir; Fax: +98-2182883575
bSchool of Chemical Engineering, College of Engineering, University of Tehran, Tehran, Iran
First published on 28th November 2016
Abstract
The efficacy of electrostimulation on bacterial lipase activity and COD removal was studied using a laboratory bioelectrochemical system. A stainless steel mesh was used as both anode and cathode. The results showed that the maximum lipase activity obtained was 38 Umol mL−1 at an applied current of 1 mA and a COD concentration of 1100 mg L−1. COD removal efficiency decreased when the reaction time was shorter. Moreover, the lipase activity increased when current was increased to 10 mA. The optimum pH for the lipase activity was 7.0, and when the pH value was increased to 9.0, the lipase activity decreased. The kinetics for the COD removal were specified based on the data for the decomposition time, which was the reaction time required to attain a COD removal of more than 99% in the feed wastewater. Linear plotting showed that the experimental data fitted very well with that of the Michaelis–Menten model (R2 = 0.9955). This shows that a suitable applied current could stimulate and improve the lipase activity. Therefore, this study provides useful information to correct the bioelectrochemical system designs and increase the removal efficiency of dissolved oils.
Introduction
Fats, oils, and grease (FOG) are discharged from various industries (such as heating, textile, oil mills, food, dairy, metals, and petroleum) into the aquatic environment. Usually, FOG pollution found in water exist in three forms: free, emulsified, and dissolved oils. Free oil floats and covers the surface of seas, lakes, and rivers. This contaminant disturbs the transfer of oxygen to water. Many treatment systems, such as grease traps, tilted plate separators, dissolved air flotation, and physicochemical methods, are used for the removal of free oil. Physicochemical methods are debatable in terms of cost, materials needed, and effectiveness; in particular, some of the emulsified oil remains in the effluent.1,2 Many different methods are used for the emulsified and dissolved oil removal.3,4 Recently, the use of modified bioelectrochemical techniques, such as utilization of enzymes for the treatment of oily wastewater, have shown great potential. Microbial activity plays a main role in this field. Lipase is one of the enzymes involved in this pathway and it hydrolyses triglycerides to glycerol and free fatty acids, as shown in Fig. 1.2,5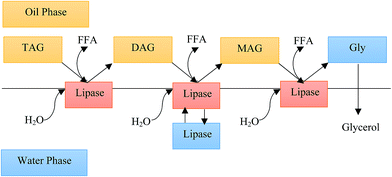 | ||
| Fig. 1 TAG hydrolysis by lipase in a biphasic oil–water system (adapted from Hermansyah et al., 2007).6 | ||
Unlike traditional methods of chemical hydrolysis, enzymatic hydrolysis works at ambient temperature and air pressure, neutral pH, and requires little energy.7 The lipase catalytic reaction occurs between the aqueous surface phase, which contains the enzyme, and the oil phase. Various microorganisms, such as bacteria, fungi, and yeasts, have the ability to produce lipase enzymes.1,8,9 Various factors can cause an increase in the amount of lipases produced by bacteria. Factors such as the type of metal ions, temperature, nitrogen source, pH, and carbon source are important for decreasing or increasing the generation of lipase.10 In addition, ions such as Ca2+, K+, Na+, Mg2+, and Ba2+ have a stimulatory effect on the lipase production.1,11
One possible way to enhance the stimulation of bacteria and biodegradation efficiency is the application of a direct electric current (DC) in the bioelectrochemical systems (BESs). BESs have many potential applications in water remediation.12–14 The DC stimulates the cell growth and metabolic activity of the microorganisms.15 In these systems, solid electrodes are used, and based on specific reactions, they directly or indirectly provide electrons to the microorganisms. These systems show a close relationship between the microorganisms and the electron source. BESs are the bioreactors that use electrochemically active microbial species to accelerate the reduction and oxidation reaction at the surface of the electrodes.16,17 The electrons admitted by the anode are transmitted as a measurable current through an external circuit towards the cathode section, where a wide range of soluble products containing dissolved O2 can be used as the final electron acceptors.18 Electrode materials have a strong impact on the performance and cost of this system; therefore, finding cheap and effective electrode materials is of great importance.19
The abovementioned effects of the electrical stimulation are related to the kind of carrier, DC applied modes (such as current intensity and reaction time), microbial species, etc. Until now, the electrical stimulation for the biodegradation by microbial species has been primarily focused on the non-conductive biofilm carriers, such as perlite and propylene, and there is a shortage of research studies on the conductive carriers. DC applied modes require further optimization for better efficiency. During this process, the efficiency is increased. Also, biodegradation does not require the addition of chemicals.20,21
According to reports, low levels of current in a BES have no significant effect on the COD removal, but it stimulates the growth of the microorganisms.22,23 Although electrical current could increase the metabolic activity of bacteria, the optimization of current is very important.24,25 In biological processes, adaptation is an important step. Adaptation can be done in different ways. The first way of adaptation is increasing the pollutant concentration during a short contact time, which may lead to a mild or severe shock. Under these conditions, immediate adaptation could occur. This strategy reduces the COD as much as 95% during the time of operation.26 The second way is to gradually increase the pollutant concentration for a long contact time, and this strategy usually prevents severe shocks. Gradual adaptation is commonly used in the wastewater treatment in many industries.27 In this study, to further investigate the effects of electrostimulation on the lipase activity of a consortium of activated sludge bacteria and on the emulsified oil degradation efficiency, a small bioelectrochemical system was extended. Specifically, the goals of this study were as follows: (1) investigate the current density effect on the lipase activity and suspension oil (as COD) removal efficiency, (2) determine the effect of pH on the lipase activity under an optimum current density, and (3) elucidate the kinetics of the lipase activity under optimum conditions in the bioelectrochemical treatment system. To the best of our knowledge, there is no report on the enhancement of lipase activity for oily wastewater treatment by an electrostimulation process.
Experimental
Synthetic oily wastewater preparation
The stock oily suspension was prepared by dissolving 1 sodium dodecyl sulfate (SDS) and 10 mL flower oil in one liter of distilled water and mixing it for 1 h at 900 rpm (magnetic stirrer, AlFa-HS860, Iran). Then, 1 mL of stock suspension was added to 250 mL of tap water.Synthetic oily wastewater was prepared by dissolving 0.162 g of NH4Cl, 0.04 g of K2HPO4, and 0.01 g of KH2PO4, and adding 25 mL of the second suspension in 1.5 L of tap water. The concentration of COD in the prepared suspension was 1000 mg L−1. The original pH of the synthetic wastewater was approximately 7.00 ± 0.02 and needed no further adjustment. All the chemical reagents used in the study were of analytical grade.
Experimental apparatus
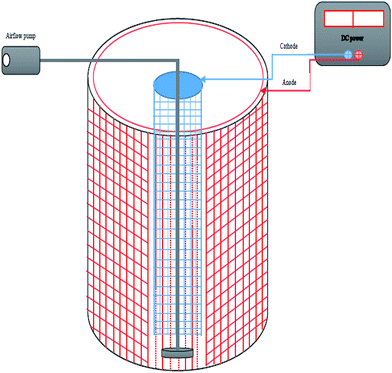
Experimental apparatus included a bench-scale bioelectrochemical system, a DC (Direct Current) power supply, an air flow pump, and a magnetic stirrer. The BES consisted of a cylindrical flask (1.5 L), an anode, and a cathode. A cylindrical shaped stainless steel mesh (SSM-mesh 12) was utilized as an anode, at a 5 mm distance from the reactor wall. The cathode was cylindrical in shape, made up of the same material, and installed in the core of the reactor. Indeed, the cathode was fixed in the center of the anode. Anode and cathode heights were 14 cm and their diameters were 12 and 3.5 cm, respectively (Fig. 2). All experiments were carried out at laboratory temperature and were repeated three times. For mixing, a magnetic stirrer (AlFa-HS860, Iran) was used to ensure the homogeneous distribution of the synthetic oily wastewater in the system during the experiment. A DC power supply (DAZHENG 30V 5A/PS-305D, China) was used to provide a stable DC for the experiments. In addition, an airflow pump (HAILEA, China) was used for aeration.Acclimation of sludge
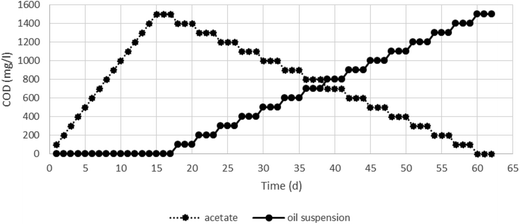
Activated sludge for the insemination of bacteria was collected from a wastewater treatment plant (Tehran, Iran) and washed three times with tap water to remove the impurities. Then, it was cultivated in 1 L of liquid nutrient medium (1.62 g CH3COONa, 0.162 g NH4Cl, 0.04 g K2HPO4, and 0.01 g KH2PO4) and replaced every day. The prepared sludge was added to the reactor; with intense mixing, the sludge was attached to the anode. After one week, when the sludge was well attached to the anode, the cathode was placed and a current of 1 mA was applied. Based on Fig. 3, the adaptation was done in steps. In each step, the COD concentration increased. The adaptation process was considered successful when the COD removal efficiency did not change and reached a constant value, with the sludge turning brown. Aeration was carried out at 1 L min−1.Experimental set up
After attaching the sludge on the anode, synthetic oily wastewater (1.5 L) was added to the BES at the beginning of each experiment. Each group of tests was independent. To investigate the effects of different currents, initial pH, COD concentration, and reaction time on the lipase activity, the current was set at 1, 5, 10, 15, and 20 mA at an initial pH of 7.00 ± 0.002. Then, the effect of pH was studied by adjusting the pH value to 5, 6, 7, 8, and 9 with 1 mol L−1 NaOH and 1 mol L−1 HCl solutions (Bante, made in China) at the observed optimum current, COD concentration, and reaction time (Table 1).| Variables | Condition | ||||
|---|---|---|---|---|---|
| pH | COD (mg L−1) | Reaction time (h) | Current (mA) | Temperature (°C) | |
| COD concentration | 7.00 | 100–1500 | 18 | 1 | 20 |
| Reaction time | 7.00 | 1100 | 1–24 | 1 | 20 |
| Applied current | 7.00 | 1100 | 18 | 1–20 | 20 |
| pH | 5–9 | 1100 | 18 | 10 | 20 |
Analytical methods
Lipase activity was determined by analyzing the amount of fatty acids released (FFA) by titration, according to the method suggested by Alshawabkeh et al.22 The reaction emulsion consisted of olive oil (10% w/v) and arabic gum (5% w/v) in 0.1 mol L−1 sodium phosphate buffer at pH 7.0. This mixture was homogenized in a blender for 3 min and the enzymatic reaction was started by adding 1 mL of the reactor supernatant. The assay was carried out at 37 °C and 160 rpm for 30 min. After this, the fatty acids were extracted with an acetone–ethanol solution (1![[thin space (1/6-em)]](https://www.rsc.org/images/entities/char_2009.gif) :
:![[thin space (1/6-em)]](https://www.rsc.org/images/entities/char_2009.gif) 1 v/v). Finally, the fatty acids released were titrated with 0.05 M NaOH to a pH endpoint of 9.5. Lipase activity was defined as the amount of enzyme that liberates 1 μmol of fatty acid equivalent per minute under the assay conditions.
1 v/v). Finally, the fatty acids released were titrated with 0.05 M NaOH to a pH endpoint of 9.5. Lipase activity was defined as the amount of enzyme that liberates 1 μmol of fatty acid equivalent per minute under the assay conditions.
Chemical oxygen demand (COD) was determined according to the procedures explained in the standard methods of water and wastewater analysis (method 5220). This parameter was analysed by spectrometry (Rayleigh spectrometry UV 9200, China). The performance of the BES for COD biodegradation was assayed based on the COD removal efficiency (CRE) and specific COD biodegradation rate (SCBR) according to the following equations:
 | (1) |
 | (2) |
Results and discussion
Adaptation and acclimation conditions
The presence of hydrocarbon degrading bacteria during the biodegradation is important. Microorganisms in the oily wastewater treatment plants are capable of degrading the hydrocarbons. When adaptation is properly done, it does not need bioaugmentation.26As shown in Fig. 3, there is a first stage up to the fifteenth day, in which the concentration of acetate as COD was gradually increased to 1500 mg L−1. To achieve stable conditions, the COD of 1500 mg L−1 was maintained for three days. On the seventeenth day, acetate concentration was gradually decreased and the oil suspension was added to the reactor. On the sixtieth day, acetate concentration was zero and oil suspension was completely added as a carbon source for the bacterial growth.
During the adaptation period, the current and pH were adjusted to 1 mA and 7.00 ± 0.02, respectively, and all the runs were performed at laboratory temperature. Generally, oily compounds contain long chain hydrocarbons; therefore, the addition of oily compounds in high concentrations may cause a shock to the bioelectrochemical system in the early days and the bacteria may die. However, the gradual addition of oily compounds gives the microorganisms an opportunity to produce the enzymes for decomposing the pollutants. Thus, the biomass does not experience a pollutant shock.
COD removal and lipase activity
Fig. 4 shows the relationship between the lipase activity (in Umol mL−1), COD concentration (in mg L−1), and COD removal efficiency in the BES. As seen in Fig. 4, COD removal efficiency was complete up to a COD concentration of 800 mg L−1. At concentrations above 800 mg L−1, the efficiency decreased with the increase in concentration. On the other hand, upon increasing the COD concentration, lipase activity also increased at concentrations up to 1100 mg L−1. The maximum lipase activity was observed at a concentration of 1100 mg L−1. After this, increasing the COD concentration led to a gradual decrease in the lipase activity.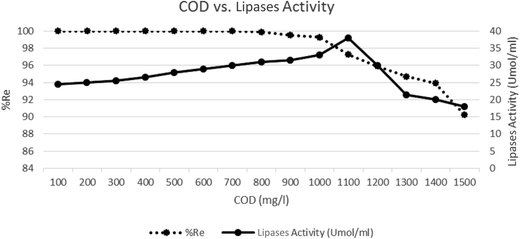 | ||
| Fig. 4 Lipase activity at different COD concentrations (pH = 7.00 ± 0.02, current = 1 mA, reaction time = 18 h). | ||
Decreased activity can be described as a situation when the time required for the effective lipase activity at concentrations up to 1100 was not enough. Also, with the occurrence of a certain amount of microbial biofilms, the microbial population may not have more enzymes under these conditions. With an increase in the COD concentration, biodegradation time increases. Kempka and colleagues in 2013 reported that the COD output was dependent on the COD input, and the COD removal efficiency obtained was 90.01%. They believed that the enzymatic hydrolysis facilitates the degradation of poorly biodegradable pollutants and maximum lipase activity was obtained at 31.50 μmol mL−1.23 In this study, at the highest COD concentration, removal efficiency was about 90%, whereas the enzymatic activity was greater than that in the Kempka's study. Probably, the electrical current caused an electrical stimulation and increased the enzymatic activity, whereas in Kempka's study, no electrical current was applied.
Effect of current on the lipase activity
Fig. 5 shows the relationship between lipase activity (Umol mL−1) and applied current (mA), and the effect of current on the lipase activity in BES. As shown in Fig. 5, upon increasing the applied initial current of 1 mA, there was an increase in the lipase activity. At a current of 10 mA, lipase activity reached a maximum rate and above 10 mA, lipase activity decreased on increasing the current. These results show that the optimum current had positive effects on the bacteria and their enzymatic activity. This result is similar to that obtained in the Rezaee et al. study.12 Sukla (2017) believed that the electrical stimulation at a certain voltage (0.2–1 V) can increase the permeability of the cell membrane and allow the penetration of ions, molecules, and macromolecules into the cell.27 Similarly, an optimum amount of current can increase the transfer of nutrients into the cell.12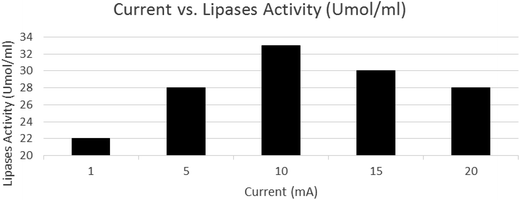 | ||
| Fig. 5 Lipase activity under different applied currents (COD = 1100 mg L−1, pH = 7.00 ± 0.02, and reaction time = 18 h). | ||
The subject in this study is different because lipase is an extracellular enzyme, and the soluble oils are broken down and converted into simple compounds. The simple compounds are used as a carbon source by the microorganisms. It seems that a 10 mA current for bacteria provides the optimal conditions in which maximum lipase activity is obtained. Lipase activity can be used as a bioindicator for evaluating the metabolic activity of bacteria during the bioelectrochemical processes. On the other hand, a current higher than the optimal has negative effects on the bacteria. The high electrical current can cause the direct oxidation within the cell structure without destroying the cell wall and killing the cells.28 High electrical current can cause a reversal in the permeability of the cell wall and thus the cell contents can be transmitted outside.29 A high electrical current can cause the electrolysis of water and produce H2O2 and radicals, such as OH* and  which are harmful to the bacteria and can affect the microbial metabolism, leading to inhibitory effects.15,30 Biofilm thickness should be maintained at an optimal level because an increase in the thickness causes an impaired electron transfer.20
Effect of initial pH on the lipase activity
This study was designed with an initial pH of 5–9 at a COD concentration of 1100 mg L−1 and an applied current of 10 mA, according to the optimum conditions found in the abovementioned experiments. Fig. 6 shows the lipase activity and final pH in the reactor at different initial pH values. The lipase activity increased as the pH value increased from 5 to 7. Maximum lipase activity was achieved at pH 7, and then at higher initial pH of up to 9, lipase activity decreased. However, initial pH increased during the reaction and the final pH shows that the bioelectrochemical reaction can cause an increase in pH. However, as shown in Fig. 6, an initial pH value adjusted to 7 was better than the other pH values because the lipase activity was maximum at this pH and the final pH was within the acceptable range for discharge into the receiving waters.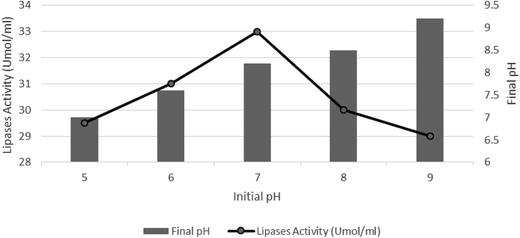 | ||
| Fig. 6 Lipase activity and final pH under different initial pH values (COD = 1100 mg L−1, current = 10 mA, reaction time = 18 h). | ||
This result is similar to that of a previous study, which showed that pH 7 is the optimal pH for the maximum lipase activity,31 but in the present study, a consortium of microorganisms was used. Mobarak-Qamsari (2011) showed that Pseudomonas aeruginosa had a high lipase activity and the maximum lipase activity was obtained at pH 8 and at 45 °C;8 however, in our study, maximum lipase activity was obtained at room temperature. This means that the bioelectrochemical process employed herein has a good activity under the field conditions. Ramyasree (2013) reported that the microbial consortium is composed of various microorganisms that have a better application in the production of lipase. They obtained a maximum lipase activity at pH 5 at a temperature of 30 °C using Lactococcus and Lactobacillus spp.9 Unlike this study, it was shown that the consortium of the activated sludge in this research inclines to a neutral pH and the maximum activity was achieved at pH 7. Based on the Kanmani's results (2015), an increase in pH can cause an increase in the lipase activity and the best activity was obtained at pH 9.1 Their results are not consistent with those obtained in our study because, as shown in Fig. 6, the enzyme activity decreased when pH was greater than 7. Kanmani (2015) used Ca2+ and K+ for the enzyme stimulation, whereas in our study, electric current was used for electrostimulation. Thus, lipase activity in our study was higher than that in the Kanmani's study.
Effect of COD concentration on the lipase activity
The process of reduction in the amount of pollutants and the lipase activity are shown in Fig. 7. As observed, with an increase in the reaction time, there was an increase in the removal efficiency and finally, a decrease in the lipase activity. During the first hour, the amount of pollutant and the enzyme activity were maximum. Over time, the amount of pollutant decreased and, therefore, the activity of lipase also decreased. This shows that the biomass is sensitive to the concentrations of pollutant. When the pollutant concentration was increased, the enzyme activity also increased, which suggests that the microorganisms sharply reacted to the concentration of pollutants.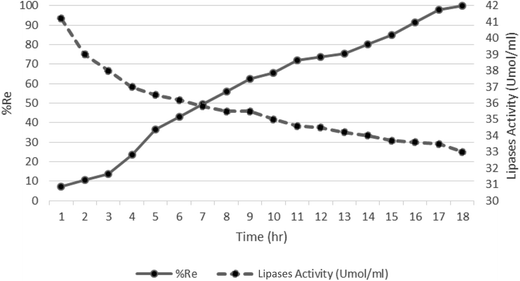 | ||
| Fig. 7 Lipase activity and COD removal at different times (COD = 1100 mg L−1, current = 10 mA, pH = 7.00 ± 0.02, and reaction time = 18 h). | ||
Another point is the intersection of the two lines in the seventh hour. At the point of intersection, removal efficiency was approximately 50% and the lipase activity was about 36 Umol mL−1. It shows that at the seventh hour, lipase activity decreased by two thirds and COD concentration decreased to 50% as removal efficiency. Also, Fig. 7 shows that within the first seven hours, decomposition of pollutants was faster than in the following 11 hours because the high concentration of pollutants was available as carbon source. Gradually, with the decrease in the concentration, the time needed to reduce the remaining pollutants increased and the lipase activity decreased.
Morphology of the bacteria in the wastewater
The morphology of the bacteria in the wastewater was studied by scanning electron microscopy (SEM) at a magnification of 30![[thin space (1/6-em)]](https://www.rsc.org/images/entities/char_2009.gif) 000×, as shown in Fig. 8. In the images, cocci-shaped bacteria (0.2 μm) with Monococcus and diplococcus forms were observed. The biofilm had a compressed combination composed of a compact population of cocci-shaped bacteria attached to each other. The structure of the bacteria in the biofilm had many channels extending from its surface to the internal core, which permitted the transfer of hydrocarbons from the solution into the internal parts of the biofilm.32 The results of this study are similar to those of Dreesa study.33 Luo observed cocci and rod-shaped bacteria, whereas in our study, only cocci bacteria were observed. This incongruity may be due to differences in the type of contaminants. It also seems that the cocci bacteria are dominant in the BESs because their structures exhibit good resistance to the electrical current.
000×, as shown in Fig. 8. In the images, cocci-shaped bacteria (0.2 μm) with Monococcus and diplococcus forms were observed. The biofilm had a compressed combination composed of a compact population of cocci-shaped bacteria attached to each other. The structure of the bacteria in the biofilm had many channels extending from its surface to the internal core, which permitted the transfer of hydrocarbons from the solution into the internal parts of the biofilm.32 The results of this study are similar to those of Dreesa study.33 Luo observed cocci and rod-shaped bacteria, whereas in our study, only cocci bacteria were observed. This incongruity may be due to differences in the type of contaminants. It also seems that the cocci bacteria are dominant in the BESs because their structures exhibit good resistance to the electrical current.
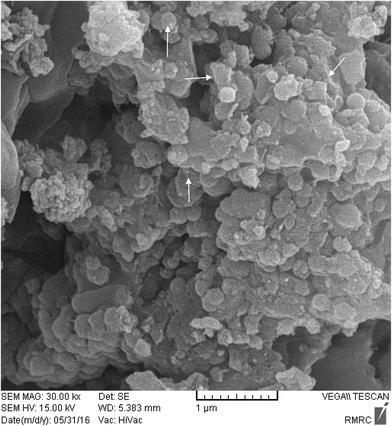 | ||
| Fig. 8 SEM image of the biofilm when degrading emulsified oil. EPS and other substances surround a group of bacteria. | ||
Moreover, secretions were seen among the bacterial cells. These secretions are likely to be extracellular polymeric substances (EPSs). Typically, EPSs are formed by the polysaccharides and proteins. Since the enzymes are proteins, EPSs might have resulted from the secretion of extracellular lipases and other enzymes and these compounds are very important in the biofilm formation.34
Biokinetic studies
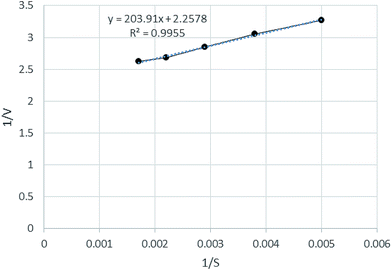
Studies on the lipase activity enhancement via the electrostimulation process were performed under the optimal conditions. The half-saturation concentration (Ks) and the maximum specific COD biodegradation rate (Vmax) were studied and the results are shown in Fig. 9. Kinetic parameters were calculated according to the linearized Michaelis–Menten equation (eqn (3)): | (3) |
The kinetics of COD removal were determined based on the decomposition time, which is the reaction time required to obtain a COD removal higher than 99% in the feed wastewater. Results of the linear plotting showed that the experimental data fitted very well with that of the Michaelis–Menten model (R2 = 0.9955). Based on the linear regression equation fitted to the pilot data (Fig. 9), the values of Vmax and Ks were defined as 0.44 g COD per g biomass and 90.31 g COD per L, respectively. As can be seen in Fig. 9, both the Vmax and Ks values increased with the electrostimulation at 20 °C. This plot shows the relationship between the COD removal and microbial biomass. The reaction rate increases with increase in time.
Conclusions
In this study, it was demonstrated that oily wastewater with regards to COD could be effectively removed with the cooperation of lipase enzymes by electrostimulation at an optimum applied current of 10 mA. Moreover, at the optimum applied current, lipase activity achieved the maximum value. COD was effectively removed in the bioelectrochemical system and with the increase in COD, lipase activity gradually decreased. The bacterial lipase activity increased with electrostimulation and the results shown in this study have a far-reaching significance for improving the efficiency of applying BES in the oily wastewater treatment.Acknowledgements
The authors gratefully acknowledge the technical support provided by the Tarbiat Modares University of Tehran, Iran. This study was financially supported by grant No. 950401 of the Biotechnology Development Council of the Islamic Republic of Iran.References
- P. Kanmani, K. Kumaresan and J. Aravind, Electron. J. Biotechnol., 2015, 18(1), 20–28 CrossRef CAS.
- M. C. Cammarota and D. M. G. Freire, Bioresour. Technol., 2006, 97, 2195–2210, DOI:10.1016/j.biortech.2006.02.030.
- A. Lobo, A. Cambiella, J. Benito, C. Pazos and C. Coca, J. Membr. Sci., 2006, 278(1), 328–334, DOI:10.1016/j.memsci.2005.11.016.
- A. L. Ahmad, S. Sumathi and B. H. Hameed, Adsorpt. Sci. Technol., 2004, 22(1), 75–88, DOI:10.1260/026361704323151015.
- S. Gupta, J. Environ. Chem. Eng., 2016, 4, 1797–1809, DOI:10.1016/j.jece.2016.03.007.
- H. Hermansyah, A. Wijanarko, M. Gozan, R. Arbianti, T. Surya Utami, M. Kubo, N. Shibasaki-Kitakawa and T. Yonemoto, J. Teknol., 2007, 2, 151–157 Search PubMed.
- E. Jurado, F. Camacho, G. Luzon, M. Fernandez-Serrano and M. Garcia-Roman, Chem. Eng. Sci., 2006, 61, 5010–5020 CrossRef CAS.
- E. Mobarak-Qamsari, R. Kasra-Kermanshahi and Z. Moosavi-nejad, Iran. J. Microbiol., 2011, 3(2), 92–98 CAS.
- S. Ramyasree and J. Ray Dutta, Biocatal. Agric. Biotechnol., 2013, 2, 393–398, DOI:10.1016/j.bcab.2013.08.002.
- B. Sethi, P. Nanda and S. Sahoo, Braz. J. Microbiol., 2016, 47, 143–149, DOI:10.1016/j.bjm.2015.11.026.
- F. N. Niyonzima and S. S. More, J. Sci. Ind. Res., 2015, 74, 105–113 CAS.
- A. Rezaee, M. Safari and H. Hossini, Environ. Technol., 2015, 36, 1057–1062, DOI:10.1080/09593330.2014.974680.
- E. Hoseinzadeh and A. Rezaee, RSC Adv., 2015, 5, 96918, 10.1039/c5ra19686h.
- D. Pant, A. Singh, G. Van Bogaert, S. Irving Olsen, P. Singh Nigam, L. Diels and K. Vanbroekhoven, RSC Adv., 2012, 2, 1248–1263, 10.1039/c1ra00839k.
- H. Hossini, A. Rezaee, B. Ayati and A. Mahvi, RSC Adv., 2015, 5, 72699–72708 RSC.
- K. Guo, D. Hidalgo, T. Tommasi and K. Rabaey, Bioresour. Technol., 2016, 211, 664–668, DOI:10.1016/j.biortech.2016.03.161.
- D. K. Yeruva, S. Jukuri, G. Velvizhi, A. Naresh Kumar, Y. V. Swamy and S. Venkata Mohan, Bioresour. Technol., 2015, 188, 33–42, DOI:10.1016/j.biortech.2015.02.014.
- H. Mohammadi Khalfbadam, M. Ginige, R. Sarukkalige, A. Kayaalp and K. Y. Cheng, Chem. Eng. J., 2016, 296, 225–233, DOI:10.1016/j.cej.2016.03.067.
- K. Guo, A. Prévoteau, S. A. Patil and K. Rabaey, Curr. Opin. Biotechnol., 2015, 33, 149–156 CrossRef CAS PubMed.
- N. Ailijiang, J. Chang, P. Liang, P. Li, Q. Wu, X. Zhang and X. Huang, Bioresour. Technol., 2016, 201, 1–7, DOI:10.1016/j.biortech.2015.11.026.
- L. Gonzalez-Gutierrez, C. Frontana and E. Martinez, Bioresour. Technol., 2015, 176, 292–295, DOI:10.1016/j.biortech.2014.11.018.
- A. N. Alshawabkeh, Y. Shen and K. Y. Maillacheruvu, Environ. Eng. Sci., 2004, 21, 321–329, DOI:10.1089/109287504323066969.
- M. Zeyoudi, E. Altenaiji, L. Y. Ozer, I. Ahmed, A. F. Yousef and S. W. Hasan, Electrochim. Acta, 2015, 181, 271–279, DOI:10.1016/j.electacta.2015.04.095.
- S. A. Jackman, G. Maini, A. K. Sharman and C. J. Knowles, Enzyme Microb. Technol., 1999, 24, 316–324, DOI:10.1016/S0141-0229(98)00128-8.
- V. Wei, M. Elektorowicz and J. A. Oleszkiewicz, Water Res., 2011, 45, 5058–5062, DOI:10.1016/j.watres.2011.07.011.
- A. Wosman, Y. Lu, S. Sun, X. Liu, C. Wan, Y. Zhang, D. J. Lee and J. H. Tay, J. Hazard. Mater., 2016, 317(5), 221–228, DOI:10.1016/j.jhazmat.2016.05.074.
- G. Gonzalez, G. Herrera, M. T. Garcĺ and M. Pena, Bioresour. Technol., 2001, 80, 137–142 CrossRef CAS PubMed.
- D. A. Freire, E. M. F. Teles, E. P. S. Bon and G. L. Sant' Anna, Appl. Biochem. Biotechnol., 1997, 63(1), 409–421, DOI:10.1007/BF02920442.
- A. P. Kempka, R. Celuppi and J. H. Palácio Revello, J. Agric. Sci. Technol., 2013, 3, 757–765 Search PubMed.
- R. A. Tahhan and R. Y. Abu-Ateih, Int. Biodeterior. Biodegrad., 2009, 63, 1054–1060, DOI:10.1016/j.ibiod.2009.09.001.
- C. Chen, S. W. Smye, M. P. Robinson and J. A. Evans, Med. Biol. Eng. Comput., 2006, 44, 5–14, DOI:10.1007/s11517-005-0020-2.
- N. Matsumoto, S. Nakasono, N. Ohmura and H. Saiki, Biotechnol. Bioeng., 1999, 63, 79–85 CrossRef.
- K. P. Dreesa, M. Abbaszadegan and R. M. Maiera, Water Res., 2003, 37, 2291–2300, DOI:10.1016/S0043-1354(03)00009-5.
- J. C. Thrash and J. D. Coates, Environ. Sci. Technol., 2008, 42(11), 3921–3931, DOI:10.1021/es702668w.
| This journal is © The Royal Society of Chemistry 2016 |

