The structures and magnetic properties of FexCo1−xSb2O4 and MnxCo1−xSb2O4, 0 ≤ x ≤ 1†
Received
14th October 2015
, Accepted 24th November 2015
First published on 25th November 2015
Abstract
MnxCo1−xSb2O4 and FexCo1−xSb2O4 have been synthesised for 0 ≤ x ≤ 1 and their structures and magnetic properties examined. For all compounds, neutron powder diffraction (NPD) data reveal a canted AFM structure that changes gradually from C-type (x = 0) to A-type (x = 1). This transition corresponds to a gradual rotation of the moments through 90°, from ±[001] to ±[100]. It is primarily caused by a change in the relative magnitudes of the three types of magnetic exchange that exist between cations. Within a given chain, direct exchange promotes an antiferromagnetic ground state for the two cations and 90° superexchange that favours ferromagnetic order. Between chains, antiferromagnetic order is preferred. However, the observed magnetic moments (from NPD) are significantly lower than expected except for the end-members of the series; this suggests that incomplete magnetic order is present. Magnetic susceptibility data also suggest complex magnetic behaviour except for the end-member compounds. The complex magnetic features appear to originate from composition inhomogeneity, local magnetic order in the chains of octahedra being dependent on small clusters of the same transition metal ion and the delicate energy balance that clearly exists between the two ordered configurations in the mid-composition region where x is near to 0.5.
1. Introduction
The mineral schafarzikite, FeSb2O4, has the low-dimensional structure shown in Fig. 1 (tetragonal, P42/mbc, a = 8.62 Å and c = 5.91 Å)1 in which chains of edge-linked FeO6 octahedra along [001] enclose channels which are parallel to the chains and have a diameter of approximately 4 Å. The chains of octahedra are connected by SbO3 trigonal pyramids. The Sb3+ lone pairs (e) are directed into the channels and provide pseudo-tetrahedral SbO3e coordination. Strong intrachain magnetic exchange (primarily direct orbital overlap between adjacent Fe2+ ions) results in A-type magnetic order (Fig. 2a) below the Néel temperature, TN = 46 K.2,3
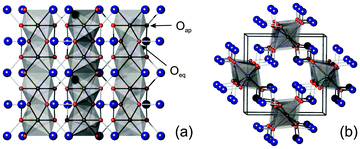 |
| | Fig. 1 MSb2O4 structure viewed (a) along [100] and (b) approximately along [001]. M – grey octahedra, Sb – large blue spheres, O – red spheres. | |
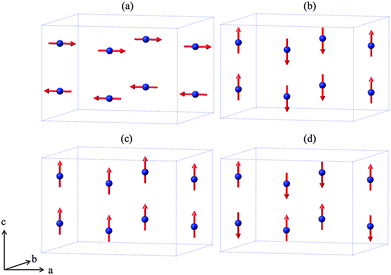 |
| | Fig. 2 The four possible collinear spin alignments generating magnetic structures: (a) A-type, (b) C-type, (c) F-type and (d) G-type. | |
Related MSb2O4 materials (M = magnetic transition metal) are known for M = Mn, Co, Ni, Cu and Zn.4–9 All order magnetically at low temperatures except for CuSb2O4, which shows no long range order above 2 K9 and the diamagnetic ZnSb2O4. Whereas the phases with M = Mn, Fe display predominantly A-type magnetic order (Fig. 2a), the M = Co, Ni phases are C-type antiferromagnets (Fig. 2b).1,10,11 In fact, the magnetic order is quite complex and FeSb2O4, for example, may show a small rotation of the magnetic moment vectors to introduce some G-type character.1,12 It has been suggested that the nature of the direct exchange within the chains – size of cation, M–M separation distance and occupancy of the t2g orbitals – is responsible for the change in magnetic order.11
Recently, attempts to functionalise some materials by creating mixed M2+/M3+ oxidation states have been reported via substitution of Pb2+ for Sb3+ for M = Mn, Fe and Co.11–13 Although Sb3+ was found to be preferentially oxidised to Sb5+ for M = Mn13 and Co,11 Whitaker et al.12 showed that mixed Fe2+/Fe3+ states exist in FeSb2−xPbxO4.
Little attention has been given to phases containing a mixture of transition metal ions, although a magnetic study of Mn1−xVxSb2O4 revealed weak ferromagnetism,14 which is likely to result from a canted antiferromagnetic ground state. The change in magnetic order from A-type (M = Mn, Fe) to C-type (M = Co, Ni) suggests that the size of M2+ ions – and/or their electron density – is important in determining the magnitude of magnetic exchange interactions. We have explored in more detail the nature of this transition between A-type and C-type by studying the structure and magnetic properties of two series of compounds containing mixed M2+ cations: FexCo1−xSb2O4 (x = 0.0, 0.25, 0.50, 0.75, 1.0) and MnxCo1−xSb2O4 (x = 0.0, 0.2, 0.4 0.5, 0.6, 0.8, 1.0); we report here the complex nature of an interesting, continuous magnetic transition that occurs between A-type and C-type order in both series.
2. Experimental
Polycrystalline samples of M′xCo1−xSb2O4 (M′ = Mn, Fe) were synthesised by heating homogenous mixtures of MnO (99%, Aldrich), CoO (>99%, Aldrich), Sb2O3 (99% Reagent Plus, Aldrich), Fe2O3 (≥99%, Sigma-Aldrich) and Sb (100 mesh, 99.5%, Sigma-Aldrich) in the appropriate stoichiometric amounts; reagents were all dried prior to use. Reaction mixtures were heated in evacuated sealed silica tubes containing alumina inserts to prevent reaction with the silica. The mixtures were heated for periods which varied from 6 hours to 36 hours at 700 °C with intermittent grinding.
X-Ray powder diffraction (XRPD) data were collected on a Bruker D8 diffractometer (PSD: Lynxeye, Cu-Kα1, Ge monochromator) in planar transmission mode; absorption corrections were applied where structure refinements were conducted. Neutron powder diffraction (NPD) data were obtained from ILL, Grenoble (D2B, λ = 1.59432 Å, ambient and 4 K for M′ = Mn [x ≤ 0.8] and M′ = Fe [x = 0.5]), PSI Zurich (SINQ, λ = 1.88518 Å, M′ = Fe, x = 0.25 and 0.75), and ISIS, RAL, UK (GEM for MnSb2O4). The wavelengths were calibrated based on XRPD refinements on the materials under investigation. The ILL data were deconvoluted into a high intensity, full detector (HI) and lower intensity, greater peak resolution (HR) data sets to reduce the low angle peak asymmetry, which was significant for some low angle magnetic reflections. The use of several NPD diffractometers resulted in low temperature data being collected at 2 K, 4 K, and 5 K. In this paper, these data will be referred to as low temperature (LT) datasets.
The Rietveld method15 was used to derive the nuclear and magnetic structures of each compound with the aid of the general structures analysis system (GSAS)16 and EXPGUI interface.17 Background intensity was modelled using a shifted Chebyschev polynomial with between 15 and 25 terms, while peak shapes were modelled using a pseudo-Voigt function. It was necessary to include preferred orientation for both XRPD and NPD data using the March–Dollase formulation incorporated within GSAS, constrained to be equal for both magnetic and nuclear phases. Due to the low total scattering from the Mn/Co site for x = 0.4 (b = 0.004 fm) it was necessary to fix the M site thermal displacement parameter to a value consistent with other Mn![[thin space (1/6-em)]](https://www.rsc.org/images/entities/char_2009.gif) :
:![[thin space (1/6-em)]](https://www.rsc.org/images/entities/char_2009.gif) Co ratios. The magnetic structure was modelled using a second unit cell (P1) containing only magnetic cations, with appropriate constraints between magnetic moments. This phase was constrained to comply with the nuclear unit cell dimensions.
Co ratios. The magnetic structure was modelled using a second unit cell (P1) containing only magnetic cations, with appropriate constraints between magnetic moments. This phase was constrained to comply with the nuclear unit cell dimensions.
Magnetic susceptibility data were acquired using a materials properties measurement system (MPMS, Quantum Design XL) under field cooled (FC) and zero field cooled (ZFC) conditions with applied fields of 100 Oe or 500 Oe. No corrections for diamagnetism were applied since they are too small to provide a significant effect. A cooling and heating rate of 10 K min−1 was used, with measurements taken in ‘Sweep’ mode. The polycrystalline sample (∼50 mg) was contained in a gelatin capsule, while sample movement was suppressed using PTFE tape.
3. Results and discussion
3.1 Crystallographic and magnetic structures
All XRPD patterns indicated single phase products consistent with P42/mbc symmetry. NPD structural refinements were based on the structure of CoSb2O411 as a starting model, with the Mn:Co and Fe:Co site occupancies constrained to the stoichiometry of the starting reagents weighed out. As expected, no evidence for cation order within the chains of MO6 octahedra was apparent. A small Fe3O4 impurity (∼1 wt%) was present in Fe0.75Co0.25Sb2O4 and nuclear and magnetic contributions for magnetite were therefore included in the refinements. This contamination is commonly observed for iron rich variants.1,12 In the refinement data below, O1 and O2 correspond to equatorial and apical oxygen ions, respectively, as shown in Fig. 1. All atoms were modelled using isotropic displacement parameters (IDPs) except for O2 in FexCo1−xSb2O4, where significant anisotropy was indicated for x = 0.25 and x = 0.50 and was therefore allowed in these refinements. In the case of x = 0.75 there was no significant difference to the anisotropic displacement parameters for O2 at 2 K, hence isotropic displacement parameters were reinstated. The anisotropic displacement parameters for O2 represent enhanced displacements in the ab plane as shown in Fig. S1 (ESI†). For Mn0.8Co0.2Sb2O4, NPD data showed additional weak peaks, corresponding to a very small (0.01 wt%) MnO impurity; this was included as a cubic Fm![[3 with combining macron]](https://www.rsc.org/images/entities/char_0033_0304.gif) m phase at 300 K (above the Néel temperature, 120 K), and as a single (nuclear and magnetic) monoclinic (C2/c) phase for the low temperature dataset.
m phase at 300 K (above the Néel temperature, 120 K), and as a single (nuclear and magnetic) monoclinic (C2/c) phase for the low temperature dataset.
The refined structural parameters at 300 K are given in Tables 1 and 2 for M′ = Fe and Mn, respectively. Typical diffraction profiles at 300 K (for the x = 0.50 member of both series) are shown in Fig. 3. The variation in the unit cell parameters with composition, determined from the 300 K and LT data, are shown in Fig. 4 and Fig. S2 (ESI†), respectively. For the Mn series, the unit cell size increases regularly with Mn content, in accordance with ionic radii considerations: 0.745 Å and 0.830 Å for high spin, 6-coordinate Co2+ and Mn2+, respectively.18 The a parameter for FexCo1−xSb2O4 increases less rapidly than the Mn series, which again reflects the smaller radius for Fe2+, 0.780 Å,18 compared with that for Mn2+. However, the c parameter for FexCo1−xSb2O4 surprisingly decreases slightly as x increases; this will be discussed later with respect to the magnetic properties.
Table 1 Refined parameters from NPD refinement for FexCo1−xSb2O4 in P42/mbc at 300 K
|
x
|
|
0.25 |
0.50 |
0.75 |
|
a/Å |
|
8.5265(1) |
8.5457(1) |
8.5728(2) |
|
c/Å |
|
5.92675(9) |
5.91843(9) |
5.9170(1) |
| Fe/Co (4d) |
U
iso × 100/Å2 |
1.08(5) |
1.24(4) |
1.19(3) |
| Sb (8h) |
x
|
0.1757(1) |
0.1748(2) |
0.1761(2) |
|
y
|
0.1650(1) |
0.1647(2) |
0.1651(2) |
|
U
iso × 100/Å2 |
1.37(3) |
1.38(3) |
1.38(3) |
| O1eq (8h) |
x
|
0.0995(1) |
0.0987(1) |
0.0996(1) |
|
y
|
0.6398(1) |
0.6399(1) |
0.6410(1) |
|
U
iso × 100/Å2 |
1.48(3) |
1.50(3) |
1.63(3) |
| O2ap (8g) |
x
|
0.67889(8) |
0.6792(1) |
0.67896(9) |
|
U
11/U22 × 100/Å2 |
2.31(5) |
2.57(5) |
2.53(5) |
|
U
33 × 100/Å2 |
1.59(9) |
1.02(7) |
1.42(8) |
|
χ
2, Rwp |
|
1.92, 0.040 |
5.05, 0.034 |
3.77, 0.041 |
Table 2 Refined parameters from NPD refinement for MnxCo1−xSb2O4 in P42/mbc at 300 K
|
x
|
|
0.2 |
0.4 |
0.5 |
0.6 |
0.8 |
1.0 |
|
Constrained equal to the average of other samples in the series.
|
|
a/Å |
|
8.5348(1) |
8.5775(2) |
8.5976(2) |
8.6187(1) |
8.6585(2) |
8.7107(2) |
|
c/Å |
|
5.93956(9) |
5.9534(1) |
5.9603(1) |
5.96720(8) |
5.9788(1) |
5.9967(2) |
| Mn/Co (4d) |
U
iso × 100/Å2 |
1.3(2) |
0.81a |
0.81a |
0.57(1) |
0.70(8) |
0.72(4) |
| Sb (8h) |
x
|
0.1758(2) |
0.1773(2) |
0.1779(2) |
0.1782(2) |
0.1790(2) |
0.1795(1) |
|
y
|
0.1649(2) |
0.1651(2) |
0.1656(2) |
0.1664(2) |
0.1664(2) |
0.1674(1) |
|
U
iso × 100/Å2 |
0.79(3) |
0.93(4) |
1.06(3) |
1.01(3) |
0.84(4) |
1.03(2) |
| O1eq (8h) |
x
|
0.0988(2) |
0.0984(2) |
0.0990(2) |
0.0995(2) |
0.0994(2) |
0.0997(1) |
|
y
|
0.6407(2) |
0.6425(2) |
0.6427(2) |
0.6430(2) |
0.6442(2) |
0.6448(1) |
|
U
iso × 100/Å2 |
0.93(3) |
1.04(4) |
1.18(3) |
1.11(3) |
1.03(4) |
1.16(3) |
| O2ap (8g) |
x
|
0.6794(1) |
0.6798(1) |
0.6796(1) |
0.6799(1) |
0.6800(1) |
0.68044(7) |
|
U
iso × 100/Å2 |
1.34(3) |
1.36(3) |
1.52(3) |
1.49(3) |
1.38(3) |
1.41(3) |
|
χ
2, Rwp |
|
1.98, 0.047 |
2.20, 0.042 |
4.17, 0.045 |
2.24, 0.049 |
1.71, 0.043 |
1.88, 0.025 |
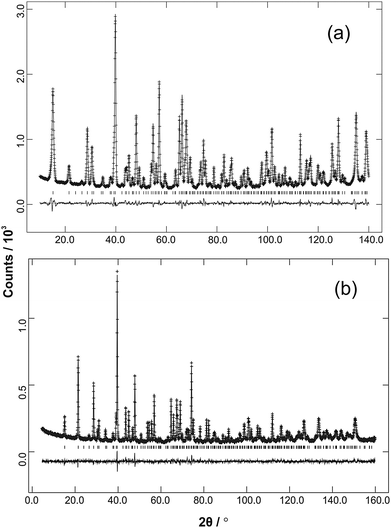 |
| | Fig. 3 Ambient temperature NPD data (observed, calculated and difference profiles) from (a) Fe0.50Co0.50Sb2O4 (λ = 1.594 Å) and (b) Mn0.5Co0.5Sb2O4 (λ = 1.593 Å). | |
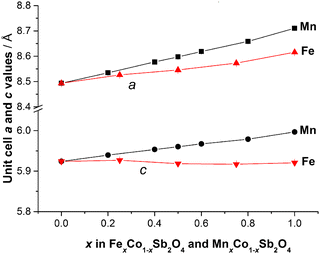 |
| | Fig. 4 Variation of unit cell edge lengths for MnxCo1−xSb2O4 and FexCo1−xSb2O4 at 300 K. Errors are hidden by the symbols. | |
The structural and magnetic parameters determined from low temperature refinements are collected in Tables 3 and 4. Diffraction profiles for the x = 0.50 member of both series are shown in Fig. 5. The small, broad peaks observed in Fig. 5(b) (at 2θ ∼ 40° and 47°) are from the cryostat used. For MnxCo1−xSb2O4, the IDPs for Sb and the Mn/Co site were typically small and sometimes slightly negative. At low temperatures, IDPs are inherently small and the low scattering from Co/Mn could explain this problem for the transition metal site. However, the IDP values for all ions in the M′ = Mn series are smaller than equivalent values for M′ = Fe and this may reflect neutron absorption effects. Where IDP values were negative, they were constrained to zero, the lowest physically allowed value. It is seen that for both series, the magnetic structure changes from C-type to A-type as x increases. The change is not sudden, and an intermediate region can be identified in which the magnetic structure can be represented as a mixture of both types: C-type with the moment along z (and −z), and A-type with moments along x (and −x) as seen in Tables 3 and 4. Summing the moment vectors provides an alternative description in which the moments rotate from the z-axis to the x-axis. Fig. 6 shows the rotations in adjacent chains of octahedra that convert C- to A-type order; Fig. 7 shows the change in orientation (rotation angle) as a function of composition for both series. The overall moment for all samples is plotted in Fig. 8 and includes data for CoSb2O411 and FeSb2O4.12 Given the change from A-type order to C-type as we cross the transition series from Mn2+ to Ni2+, we might expect that the substitution of Mn2+ for Co2+ in CoSb2O4 would stabilise the A-type order more than the corresponding substitution of Fe2+. Indeed, this is supported by Fig. 7, since the transition from A- to C-type order occurs at a lower substitution level for Mn2+. However, the difference is not large, and smaller than we would expect.
Table 3 Refined parameters from NPD refinement for FexCo1−xSb2O4 at low temperature (2 K for x = 0.25, 0.75; 4 K for x = 0.5)
|
x
|
|
0.25 |
0.50 |
0.75 |
|
U
iso.
|
|
a/Å |
|
8.5172(1) |
8.5382(1) |
8.5677(1) |
|
c/Å |
|
5.92236(8) |
5.90999(9) |
5.90455(9) |
| Fe/Co (4d) |
U
iso × 100/Å2 |
0.53(4) |
0.30(5) |
0.58(3) |
| Sb (8h) |
x
|
0.1753(1) |
0.1753(2) |
0.1753(2) |
|
y
|
0.1647(1) |
0.1649(2) |
0.1647(2) |
|
U
iso × 100/Å2 |
0.57(3) |
0.19(4) |
0.52(3) |
| O1eq (8h) |
x
|
0.0995(1) |
0.0990(2) |
0.0995(1) |
|
y
|
0.6404(1) |
0.6406(2) |
0.6416(1) |
|
U
iso × 100/Å2 |
0.82(3) |
0.39(4) |
0.81(3) |
| O2ap (8g) |
x
|
0.67834(7) |
0.6788(1) |
0.67837(9) |
|
U
11/U22 × 100/Å2 |
0.96(3)a |
0.77(6) |
1.20(5) |
|
U
33 × 100/Å2 |
— |
0.23(8) |
0.68(8) |
| Moment (μB) |
Cz |
3.03(1) |
1.86(2) |
1.27(1) |
| Ax |
0 |
1.02(5) |
2.51(2) |
| Total |
3.03(1) |
2.12(4) |
2.81(3) |
|
χ
2, Rwp |
|
4.24, 0.043 |
2.76, 0.055 |
4.44, 0.046 |
Table 4 Refined parameters from NPD refinement for MnxCo1−xSb2O4 at 5 K
|
x
|
|
0.2 |
0.4 |
0.5 |
0.6 |
0.8 |
1.0 |
|
Constrained to 0.0 because of slightly negative refined value.
|
|
a/Å |
|
8.5226(1) |
8.5656(2) |
8.5866(1) |
8.6082(1) |
8.6476(2) |
8.6982(2) |
|
c/Å |
|
5.9377(1) |
5.9490(1) |
5.9547(1) |
5.9600(1) |
5.9683(1) |
5.9814(2) |
| Mn/Co (4d) |
U
iso × 100/Å2 |
0.5(2) |
0.0a |
0.0a |
0.0a |
0.0a |
0.16(2) |
| Sb (8h) |
x
|
0.1757(2) |
0.1772(2) |
0.1775(2) |
0.1777(2) |
0.1790(2) |
0.17948(5) |
|
y
|
0.1648(2) |
0.1651(2) |
0.1660(2) |
0.1658(2) |
0.1666(2) |
0.16733(5) |
|
U
iso × 100/Å2 |
0.00(4) |
0.00a |
0.0a |
0.0a |
0.0a |
0.116(9) |
| O1eq (8h) |
x
|
0.0987(2) |
0.0979(2) |
0.0987(2) |
0.0987(2) |
0.0987(2) |
0.09955(5) |
|
y
|
0.6410(2) |
0.6428(2) |
0.6432(2) |
0.6442(2) |
0.6451(2) |
0.64609(5) |
|
U
iso × 100/Å2 |
0.22(4) |
0.26(4) |
0.30(3) |
0.24(3) |
0.22(4) |
0.33(1) |
| O2ap (8g) |
x
|
0.6785(1) |
0.6786(1) |
0.6790(1) |
0.6791(1) |
0.6796(1) |
0.67952(4) |
|
U
iso × 100/Å2 |
0.24(3) |
0.19(3) |
0.22(3) |
0.23(3) |
0.25(3) |
0.387(9) |
| Moment (μB) |
Cz |
3.32(2) |
2.31(3) |
1.65(3) |
0.57(5) |
0 |
0 |
| Ax |
0 |
1.44(4) |
1.99(4) |
2.27(6) |
3.17(4) |
4.32(1) |
| Total |
3.32(2) |
2.73(4) |
2.58(5) |
2.34(6) |
3.17(4) |
4.32(1) |
|
χ
2, Rwp |
|
4.60, 0.062 |
2.80, 0.055 |
2.67, 0.054 |
3.40, 0.062 |
2.49, 0.053 |
2.41, 0.023 |
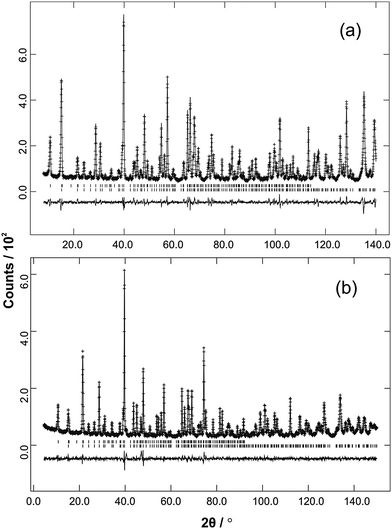 |
| | Fig. 5 Low temperature NPD data (observed, calculated and difference profiles) from (a) Fe0.5Co0.5Sb2O4 (λ = 1.594 Å) and (b) Mn0.5Co0.5Sb2O4 (λ = 1.593 Å). Reflection positions for the magnetic phase are above the nuclear reflections. These relate to the P1 magnetic unit cell used to allow simultaneous refinement of A- and C-type magnetic contributions. The positions therefore correspond to the crystallographic cell but with no absences. | |
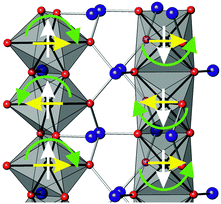 |
| | Fig. 6 Rotation of magnetic moments (green arrows) in two adjacent chains of octahedra that convert C-type order (white arrows) to A-type (yellow arrows). | |
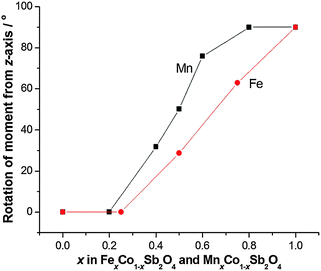 |
| | Fig. 7 Angle between magnetic moments and the z-axis as a function of x for MnxCo1−xSb2O4 and FexCo1−xSb2O4. | |
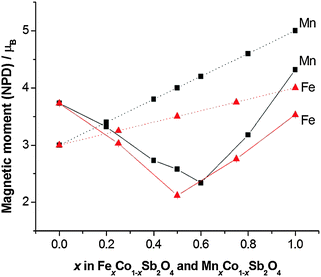 |
| | Fig. 8 Comparison of experimental magnetic moments from NPD data (solid lines) and 2S (dotted lines) for MnxCo1−xSb2O4 and FexCo1−xSb2O4. Errors are hidden by the symbols. | |
It is useful to consider the magnetic exchange interactions in order to discuss the change from C- to A-type behaviour as x increases for both series, Fig. 7. Direct exchange is important and relates to direct overlap of t2g orbitals of the transition metal ions within the edge-linked octahedra. This will decrease in the order Mn2+ > Fe2+ > Co2+ based solely on the number of unpaired t2g electrons, but will also depend on the extent of orbital overlap. The M–M distance within the chains is equal to c/2, and Fig. 4 and Fig. S2 (ESI†) show that despite the fact that Fe2+ is larger than Co2+, c decreases slightly as Co2+ is replaced by Fe2+. This would be expected to increase the antiferromagnetic intrachain interactions for FexCo1−xSb2O4 and oppose the effect of the decrease in number of t2g electrons on Fe2+ relative to Mn2+; it rationalises the similar compositions (x values) for the change in magnetic order in the two series. The elongated octahedral coordination for the transition metal ions is a consequence of the structure, and the reason for the decrease in c is unclear. It may, however, reflect an enhanced distortion that results from the small Jahn–Teller effect that can occur for high spin Fe2+ ions. The M–O–M (M = Co, Mn, Fe) superexchange (SE) interactions within the chains will favour ferromagnetic intrachain order (C-type order) but will be weaker than the direct exchange for Mn2+ and Fe2+ ions. For all compositions, the M–O–M angle is close to 90°, and the M–Oeq bond lengths show no behaviour in either series (Fig. 9) to suggest a large change to the strength of this exchange mechanism. Since the M–Oeq distance depends on both a and c parameters, it is seen that the unusual decrease in c, caused by the substitution of Fe2+ ions, is not reflected in the M–Oeq distances. The M–O–Sb–O–M super-superexchange (SSE) interaction will favour an anti-parallel alignment of spins in nearest-neighbour octahedral chains, acting within both [110] and [111] directions; this is the origin of A- and C-type ground states, as opposed to G- or F-type (Fig. 2). To a first approximation this interaction will depend on the lattice a-parameter, with a small contribution from c.
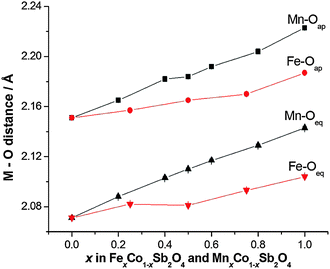 |
| | Fig. 9 Equatorial and apical M–O distances for MnxCo1−xSb2O4 and FexCo1−xSb2O4. Errors are hidden by the symbols. | |
The overall magnetic structure is a competition between these three magnetic interactions, dependent on both electronic t2g configuration, and lattice parameters. For CoSb2O4, the a/c ratio (1.432) is lower than for MnSb2O4 (1.453) or FeSb2O4 (1.455), therefore the inter-chain SSE and 90° SE interactions promote C-type order. For M = Mn and Fe, the direct exchange interaction is most significant, promoting an A-type ground state.
A remarkable feature of Fig. 8 is that the moment derived from NPD data (corresponding ideally to 2S for complete quenching of any orbital component) varies with x such that it passes through a minimum near the mid-point, x ∼ 0.5 for both series. The end member moments are as expected: the moment for Co2+ in CoSb2O4 is higher than 2S because of the high orbital contribution that exists for the 4T1g ground state; the moments of MnSb2O4 and FeSb2O4 are both reduced below 2S because of covalence and low temperature quantum effects. At the minima in the moments, the values are approximately 1.5 μB lower than the respective values of 2S, which is highly significant given the high values for Co2+ ions. We attribute these moments to incomplete magnetic order within these materials. These minima correspond to an a/c ratio of 1.444 in both materials, suggesting that at this ratio the competition between inter- and intra-chain ordering compensate each other. Given the small energy difference between A- and C-type order at these compositions, it is plausible that composition inhomogeneity may result in regions of disorder or short-range order. In addition, the natural statistical occurrence of sequences such as –Co–Co–Co– within the chains may also result in short-range order that is inconsistent with the overall long-range magnetic order. The observed magnetic model corresponds to a combination of Γ5 and Γ10 irreducible representations, indicating the presence of more than one second-order phase transition from Landau theory. Some supporting evidence for complex magnetic behaviour is found in magnetic susceptibility data (vide infra).
3.2 Magnetic susceptibility
Magnetic susceptibility data for samples FexCo1−xSb2O4 and MnxCo1−xSb2O4 are shown in Fig. 10 and 11, respectively. Susceptibility data for the end members (M = Co, Fe, Mn) have previously been reported, ref. 11, 19 and 20, respectively. The FexCo1−xSb2O4 samples show a transition to a canted antiferromagnetic ground state with a Néel temperature (TN) of approximately 55 K. The magnitude of the parasitic ferromagnetic component appears to reduce as the Fe2+ content of the system is reduced. Field sweep measurements (5 K) confirm the small FM component. For example, Fig. S3 (ESI†) for x = 0.5 shows a small hysteresis consistent with parasitic ferromagnetism, which is superimposed on a large field-dependent signal. Extrapolation of the high-field regions to H = 0 indicate a FM component of ca. 0.08 μB, too small to be detected in the NPD data. The high temperature paramagnetic region of Fe0.75Co0.25Sb2O4 is dominated by a sudden drop in magnetisation at ca. 125 K, which corresponds to the Verwey transition21 in the very small Fe3O4 impurity identified in the NPD data. In addition to the ferromagnetic upturn at TN, both Fe0.50Co0.50Sb2O4 and Fe0.25Co0.75Sb2O4 show a small deviation between FC and ZFC susceptibilities at temperatures higher than TN (e.g. Fe0.25Co0.75Sb2O4, 59 K < T < 77 K). Data for MnxCo1−xSb2O4 also revealed a canted antiferromagnetic structure with the parasitic ferromagnetism smaller than the M′ = Fe series and reducing as x increases; for example, sweep measurements at 5 K provide a saturated moment of ∼0.03 μB for x = 1.0. Samples for x = 0.2; 0.4; 0.5 show a magnetic transition between 70 K and 80 K but the main transition is observed at lower temperatures (22–60 K) for these samples, as well as for x = 0.6. This effect is clearly revealed in the inverse susceptibility data (Fig. 11). The low temperature magnetic features for both series suggest that samples may suffer from a degree of inhomogeneity which results in parts of the sample having higher Néel temperatures. This almost certainly would relate to the Fe/Co and Mn/Co distributions. In addition, the symmetry of the magnetic model, corresponding to Γ5 and Γ10 irreducible representations, is consistent with more than one second-order phase transition.
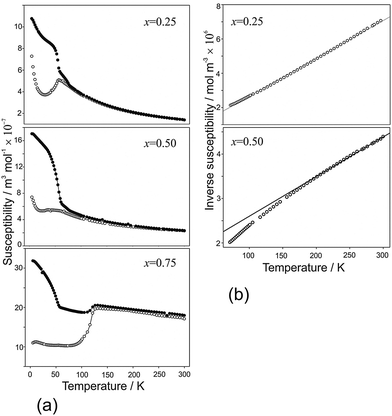 |
| | Fig. 10 (a) Magnetic susceptibility and (b) inverse susceptibility for FexCo1−xSb2O4 under FC (●) and ZFC (○) conditions, 100 Oe applied field. | |
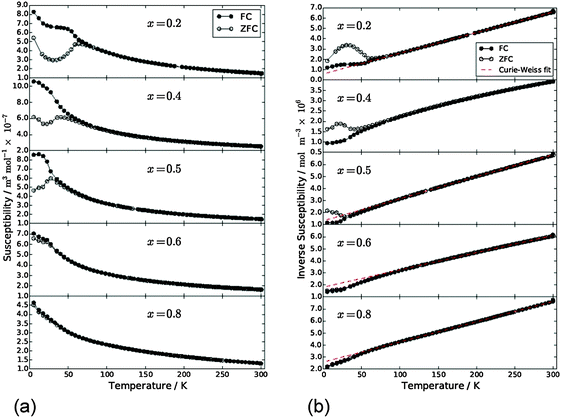 |
| | Fig. 11 (a) Magnetic susceptibility and (b) inverse susceptibility for MnxCo1−xSb2O4 under FC (●) and ZFC (○) conditions, 500 Oe applied field. | |
Apart from the magnetite-containing sample, Fe0.75Co0.25Sb2O4, the high temperature paramagnetic region obeyed the Curie–Weiss law reasonably well as indicated in the plots of inverse susceptibility against temperature (Fig. 10 and 11). However, magnetic deviations are clearly seen for Fe0.50Co0.50Sb2O4 below 150 K. The moments calculated using the linear regions are compared with spin-only values in Fig. 12 and additional details are found in Table 5. As expected, the Mn2+ moment in MnSb2O4 is in very good agreement with the spin-only value whereas the moment for Co2+ in CoSb2O4 is substantially higher than that from the electron spin because of the high orbital contributions for the orbitally degenerate 4T1g ground state for high spin octahedral Co2+. However, in the absence of additional magnetic interactions we would expect a linear variation of the magnetic moment with composition, i.e. x. This is not the case and moments towards the middle of the composition ranges are higher than expected. This is particularly pronounced for Fe0.50Co0.50Sb2O4 with a moment of 8.45 μB, (200–300 K, ZFC data). Despite the small divergence between ZFC and FC susceptibilities, the FC measurements returned a similar moment of 8.00 μB. Although this sample shows curvature of the plot of inverse susceptibility against temperature at lower temperatures, we believe that the deviations of the moments from those expected are real and are probably indicative of some ferromagnetic cluster formation extending to temperatures significantly above the Néel temperature. It is pertinent to note that this sample has the lowest moment determined by NPD, and overall there is a remarkable decrease in the ordered moment towards the centre of the composition ranges for both series (Fig. 8). It therefore seems likely that the magnetic anomalies have a common explanation. The low moments from NPD were attributed to incomplete magnetic order originating from possible short range Fe/Co and Mn/Co order within the chains of octahedra. A random cation distribution will obviously result in the existence of some chains of type –Co–Co–Co–. If such clusters display significant internal FM exchange (as for the C-type order in CoSb2O4) that extends above the Néel temperature or local dipole–dipole interactions along chains, a higher than expected paramagnetic moment would result. Similar effects have been observed for other systems, e.g. LaSr2CoMnO6μeff = 13.79 μB22 and La1.2Sr0.8MnO4.27μB = 8.46 μB.23 However, the negative Weiss constant, e.g. θ = −191(3) K for Fe0.5Co0.5Sb2O4 indicates that the overall exchange remains antiferromagnetic. Table 5 shows that for both series the Weiss constant (θ) becomes more negative as the substitution level (x) increases. Where the low temperature order is predominantly A-type, −θ > TN, which is normal for antiferromagnetic order when the mean field of each magnetic sublattice is not determined only by the other sublattice. However, for samples with high Co concentrations, we see that −θ < TN, which is unusual for antiferromagnetic materials; this may be attributed to dominant FM exchange between nearest-neighbour intrachain cations for the C-type ordered structure for T > TN, and the high orbital contribution to the Co2+ moment, which is not included in the basic Curie–Weiss law derivation. As expected, θ becomes more negative as x increases owing to the increasingly strong AFM intrachain interactions. TN, which marks 3-D order, does not simply follow this trend and is more dependent on the interchain exchange.
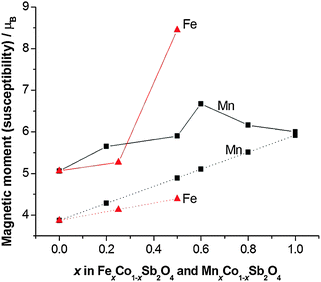 |
| | Fig. 12 Effective magnetic moment (μeff, solid lines) compared with the spin-only magnetic moment (μso, dotted lines) for MnxCo1−xSb2O4 and FexCo1−xSb2O4. | |
Table 5 Magnetic susceptibility data for MnxCo1−xSb2O4 and FexCo1−xSb2O4 (μso corresponds to the spin-only moment; θ is the Weiss constant)
| |
x
|
T
N
|
μ
eff/μBb |
μ
so/μB |
θ
|
|
No clear transition from susceptibility data.
Estimated error ±0.08 μB.
Estimated error ±4 K.
|
| MnxCo1−xSb2O4 |
0.0 |
79 (ref. 11) |
5.06 |
3.87 |
+3 |
| 0.2 |
60 |
5.65 |
4.28 |
−31 |
| 0.4 |
45 |
— |
4.69 |
— |
| 0.5 |
27 |
5.90 |
4.89 |
−73 |
| 0.6 |
22 |
6.67 |
5.10 |
−126 |
| 0.8 |
—a |
6.16 |
5.51 |
−154 |
| 1.0 |
55 (ref. 20) |
6.0 |
5.92 |
−190 |
|
|
| FexCo1−xSb2O4 |
0.0 |
79 (ref. 11) |
5.06 |
3.87 |
+3 |
| 0.25 |
57 |
5.27 |
4.13 |
−12 |
| 0.50 |
61 |
8.45 |
4.39 |
−191 |
| 0.75 |
55 |
— |
4.64 |
— |
| 1.0 |
45 (ref. 12) |
— |
4.90 |
— |
4. Conclusions
MnxCo1−xSb2O4 and FexCo1−xSb2O4 have been synthesised successfully for 0 ≤ x ≤ 1. The variation in unit cell size generally reflects the ionic radii of the cations (Mn2+ > Fe2+ > Co2+) but for FexCo1−xSb2O4 the c parameter surprisingly undergoes a small contraction as x increases. Magnetic susceptibility data show a canted AFM structure for all compounds, although the ferromagnetic component decreases with x in both series. Broad (or possibly two) transitions are observed for many of the samples, which may be attributed to slight sample inhomogeneity of the transition metal ion distribution. NPD data reveal the magnetic structure consists of a transposition of the end-member magnetic structures (Ax and Cz) which is highly tuneable with x. The transition from C-type (x = 0.00) to A-type (x = 1.00) occurs over a range of x values and occurs via a gradual rotation of the moments from ±[001] to ±[100]. The observed magnetic moments (from NPD) are significantly lower than expected except for the end-members of the series due to a fully ordered structure not being attained. This is attributed to composition inhomogeneity and the delicate energy balance that exists between the two ordered configurations.
Acknowledgements
We thank EPSRC for financial support of this research (EP/L014114/1 and EP/P505410/1) and EPSRC, EU and PSI for the provision of NPD facilities. We acknowledge the assistance of Dr Emma Suard, Dr Vladimir Pomjakushin and Dr Winfried Kockelmann in collecting the NPD data. The X-ray diffractometers used in this research were obtained through Birmingham Science City: Creating and Characterising Next Generation Advanced Materials (West Midlands Centre for Advanced Materials Project 1), with support from Advantage West Midlands (AWM) and part funded by the European Regional Development Fund (ERDF). Requests for additional information/data should be made to the corresponding author. Data associated with the results shown in this paper are accessible from the University of Birmingham archive: http://epapers.bham.ac.uk/2082/.
References
- J. A. Gonzalo, D. E. Cox and G. Shirane, Phys. Rev., 1966, 147, 415 CrossRef CAS.
- F. Varret, P. Imbert, A. Gerard and F. Hartmann-Boutron, Solid State Commun., 1968, 6, 889 CrossRef CAS.
- R. Chater, J. R. Gavarri and A. W. Hewat, J. Solid State Chem., 1985, 60, 78 CrossRef CAS.
- G. Tammann, Z. Anorg. Allg. Chem., 1925, 149, 21 CrossRef CAS.
- E. Koyama, I. Nakai and K. Nagashima, Nippon Kagaku Kaishi, 1979, 6, 793 CrossRef.
- J. R. Gavarri, G. Calvarin and B. Chardon, J. Solid State Chem., 1983, 47, 132 CrossRef CAS.
- H. T. Witteveen, Solid State Commun., 1971, 9, 1971 CrossRef.
- S. Ståhl, Ark. Kem. Min. Geol., 1943, 17B, 1 Search PubMed.
- M. T. Atanasova, A. M. Strydom, C. J. H. Schutte, L. C. Prinsloo and W. W. Focke, J. Mater. Sci., 2014, 49, 3497 CrossRef CAS.
- J. R. Gavarri and A. W. Hewat, J. Solid State Chem., 1983, 49, 14 CrossRef CAS.
- B. P. de Laune and C. Greaves, J. Solid State Chem., 2012, 187, 225 CrossRef CAS.
- M. J. Whitaker, R. D. Bayliss, F. J. Berry and C. Greaves, J. Mater. Chem., 2011, 21, 14523 RSC.
- A. M. Abakumov, M. G. Rozova, E. V. Antipov, J. Hadermann, G. Van Tendeloo, M. V. Lobanov, M. Greenblatt, M. Croft, E. V. Tsiper, A. Llobet, K. A. Lokshin and Y. S. Zhao, Chem. Mater., 2005, 17, 1123 CrossRef CAS.
- H. Abe, K. Yoshii and H. Kitazawa, Phys. Status Solidi A, 2002, 189, 429 CrossRef CAS.
- H. M. Rietveld, J. Appl. Crystallogr., 1969, 2, 65 CrossRef CAS.
-
A. C. Larson and R. B. Von Dreele, General Structure Analysis System (GSAS), Los Alamos National Laboratory Report LAUR 86-748, 2000 Search PubMed.
- B. H. Toby, J. Appl. Crystallogr., 2001, 34, 210 CrossRef CAS.
- R. D. Shannon, Acta Crystallogr., Sect. A: Cryst. Phys., Diffr., Theor. Gen. Crystallogr., 1976, 32, 751 CrossRef.
- G. Gorodetsky, M. Sayar and S. Shtrikman, Mater. Res. Bull., 1970, 5, 253 CrossRef CAS.
- H. Fjellvag and A. Kjekshus, Acta Chem. Scand., Ser. A, 1985, 39, 389 CrossRef.
- E. J. W. Verwey and P. W. Haayman, Physica, 1941, 8, 979 CrossRef CAS.
- H. El Shinawi, A. Bertha, J. Hadermann, B. Santos, J. F. Marco, F. J. Berry and C. Greaves, J. Solid State Chem., 2010, 183, 1347 CrossRef CAS.
- R. K. Li and C. Greaves, J. Solid State Chem., 2000, 153, 34 CrossRef CAS.
Footnotes |
| † Electronic supplementary information (ESI) available. See DOI: 10.1039/c5tc03333k |
| ‡ Current address: CSEC and School of Chemistry, University of Edinburgh, Edinburgh EH9 3FD, UK. |
| § Authors have made equal contributions to the paper. |
|
| This journal is © The Royal Society of Chemistry 2016 |
Click here to see how this site uses Cookies. View our privacy policy here.  Open Access Article

![[thin space (1/6-em)]](https://www.rsc.org/images/entities/char_2009.gif) :
:![[thin space (1/6-em)]](https://www.rsc.org/images/entities/char_2009.gif) Co ratios. The magnetic structure was modelled using a second unit cell (P1) containing only magnetic cations, with appropriate constraints between magnetic moments. This phase was constrained to comply with the nuclear unit cell dimensions.
Co ratios. The magnetic structure was modelled using a second unit cell (P1) containing only magnetic cations, with appropriate constraints between magnetic moments. This phase was constrained to comply with the nuclear unit cell dimensions.![[3 with combining macron]](https://www.rsc.org/images/entities/char_0033_0304.gif) m phase at 300 K (above the Néel temperature, 120 K), and as a single (nuclear and magnetic) monoclinic (C2/c) phase for the low temperature dataset.
m phase at 300 K (above the Néel temperature, 120 K), and as a single (nuclear and magnetic) monoclinic (C2/c) phase for the low temperature dataset.


