Upconversion nanoparticle as elemental tag for the determination of alpha-fetoprotein in human serum by inductively coupled plasma mass spectrometry†
Zhengru
Liu
,
Bin
Yang
,
Beibei
Chen
,
Man
He
and
Bin
Hu
*
Key Laboratory of Analytical Chemistry for Biology and Medicine (Ministry of Education), Department of Chemistry, Wuhan University, Wuhan 430072, P R China. E-mail: binhu@whu.edu.cn; Tel: +86-27-68752162
First published on 24th November 2016
Abstract
Upconversion nanoparticles (UCNPs) have received increasing attention due to their unique optical properties. Recognizing that UCNPs are lanthanide-doped nanoparticles, we incorporated UCNPs into an immunoassay with inductively coupled plasma mass spectrometry (ICP-MS) detection for the determination of specific proteins, e.g., alpha-fetoprotein (AFP). The sensitivity of the assay was enhanced because of the ICP-MS detection of UCNPs that contained large numbers of lanthanide elemental tags. Conjugates of UCNPs and antibodies were prepared and the morphology of the conjugates was characterized by transmission electron microscopy. After a sandwich immunoreaction, the AFP was determined by the ICP-MS analysis of UCNPs. Under the optimized conditions, a limit of detection (3σ) of 0.31 ng mL−1 based on 89Y signal and 0.22 ng mL−1 based on 174Yb signal was obtained for AFP, with a dynamic range of 0.5–35 ng mL−1 and a relative standard deviation of 4.8% (c = 5 ng mL−1, n = 9). The developed method was applied to the determination of AFP in human serum and the recovery for the spiked sample was in the range of 98.6–123%. The proposed method is simple, rapid, selective and sensitive, and has a good tolerance for the complex biological matrix, indicating great potential for the application of UCNP in biological research as an elemental tag.
1 Introduction
Cancer has become a serious threat to human health worldwide. To tackle this great challenge, the diagnosis of cancer at an early stage is of great significance. A variety of biomolecules such as proteins and nucleic acids play key roles in different cancers, which are identified as “cancer biomarkers”. The accurate determination of cancer biomarkers has been an important topic in the research of early diagnosis. However, the concentrations of biomarkers in the early stage of cancer are usually extremely low, requiring highly sensitive methods for accurate determination.A series of assays have been developed for the accurate determination of different cancer biomarkers. Up to now, the colorimetric assay is still the most widely used method in routine clinical diagnosis for its low cost and simple manipulation. However, the sensitivity of the colorimetric assay is relatively low. New assays based on fluorescence and chemiluminescence greatly improve the sensitivity, while the spectral overlap may limit their applications in the multiplex analysis. Meanwhile, all the assays may be affected by complex biological matrix. Therefore, developing sensitive and specific methods for the accurate determination of the cancer biomarkers is essential.
Inductively coupled plasma mass spectrometry (ICP-MS) has been introduced into the determination of biomarkers with elemental tags in recent years. ICP-MS has high sensitivity and accuracy for multi-element detection, and ionization process is practically independent of the compound and matrix due to the 7000 K plasma conditions.1 Zhang and co-workers2 first established an immunoassay based on elemental tags and ICP-MS detection in 2001. Since then, a series of elemental tags have been developed for ICP-MS determination of biomarkers, such as iodine tags,3,4 metal-chelates,5–11 metal-containing nanoparticles (NPs) and polymer-based elemental tags.12–15 Of all these elemental tags, metal-containing NPs are a series of tags which are widely applied in ICP-MS based immunoassays.16,17 Up to now, several metal-containing NPs have been developed, including Au NPs,18–22 Ag NPs,23,24 PbS NPs,25 HgS NPs,26 TiO2 NPs,27,28 CuO NPs,29 metal-doped silica NPs21,30–33 and quantum dots,34–37etc. Metal-containing NPs have high sensitivity by achieving signal amplification by thousands of metal atoms labeled on one target molecule,38 and have shown great potential in the determination of biomarkers in ultra-low concentrations.
Lanthanide-doped upconversion nanoparticles (UCNPs) are a promising new generation of luminescent probes for bioanalysis, especially for near-infrared (NIR) bioimaging. Differently from the traditional fluorescent tags, UCNPs can be excited by near-infrared light and emit at visible wavelengths, which eliminate the interference of autofluorescence efficiently. Meanwhile, less harm to organisms can be achieved during the excitation process due to the low energy of infrared light. In addition, the properties of UCNPs are closely relevant to those of the lanthanides, which have high responses in ICP-MS and low background signals in the biological matrix. It is expected that UCNPs may also be excellent elemental tags for the ICP-MS based immunoassay. Tong et al.39 synthesized a series of NaLnF4 nanoparticles, which may be used as elemental tags in mass cytometry. However, to the best of our knowledge, no application of UCNPs as the elemental tags in the determination of biomarkers based on ICP-MS detection has been reported so far.
Alpha-fetoprotein (AFP) is an important cancer biomarker of liver cancer. The concentration of AFP is directly relevant to liver diseases. Generally, the concentration of AFP in healthy adults is normally lower than 8 ng mL−1; a level higher than 20 ng mL−1 commonly indicates lesions of the liver.40 Therefore, the concentration of AFP is a significant standard of liver disease and has been a routine item for clinical diagnosis. Chen et al.41 achieved the determination of AFP in the near-infrared (NIR) region based on luminescence energy transfer (LET) from NaYF4:Yb,Tm/NaGdF4 core–shell UCNPs to gold nanorods. Several immunoassays have also been established for the determination of AFP based on ICP-MS. Baranov et al.17 achieved the determination of AFP firstly with ICP-MS detection of Eu/Ho using a Eu-labeled antibody as a tag. Hu et al.42 established a method for the determination of AFP on microarrays. The target proteins were identified with Sm3+-labeled antibodies and detected by laser ablation ICP-MS. By using gold nanoparticles as elemental tags, the same authors established another method for the detection of AFP by ICP-MS with the single particle mode.43 Terenghi et al.44 developed a liquid phase immunoassay for the simultaneous determination of AFP and four other biomarkers with ICP-MS detection based on the separation of immunocomplexes by size exclusion chromatography. Zhang et al.24 prepared 4-mercaptophenylboronic acid functionalized magnetic beads which had a high affinity for glycoproteins. AFP was selectively captured by the magnetic beads and determination was achieved with ICP-MS detection using Au NPs as elemental tags. Ko et al.33 synthesized Cs-doped multicore magnetic nanoparticles (MMNPs) and three different metal/dye-doped silica nanoparticles for the multiplex detection of AFP, a neuron specific enolase, and a c-reactive protein. The MMNPs were used not only for the magnetic extraction of targets but also for ratiometric measurement as an internal standard in ICP-MS.
To demonstrate the potential of UCNPs as elemental tags in an ICP-MS based immunoassay, we established an immunoassay based on ICP-MS using UCNPs as elemental tags for the determination of AFP. After a sandwich immunoassay, the AFP was determined by ICP-MS with monitoring of the 89Y and 174Yb signals in UCNPs. The morphology of the prepared UCNPs was characterized by transmission electron microscopy (TEM), and the factors influencing the immunoassay were investigated. The analytical performance was evaluated under the optimized conditions, and the developed method was applied to the determination of AFP in human serum for validation.
2 Experimental
2.1 Instrumentations
An Agilent 7500a quadrupole ICP-MS (Agilent, Tokyo, Japan) with a Babington nebulizer was used for the determination of 89Y and 174Yb in integral parameter mode. The optimized ICP-MS operating parameters are listed in Table 1.| ICP-MS operating parameter | |
|---|---|
| Rf power | 1250 W |
| Plasma gas (Ar) flow rate | 14 L min−1 |
| Auxiliary gas (Ar) flow rate | 0.88 L min−1 |
| Carrier gas (Ar) flow rate | 1.06 L min−1 |
| Sampling depth | 7.0 mm |
| Sampler/skimmer diameter orifice | Nickel 1.0 mm/0.4 mm |
| Time-resolved data acquisition | |
|---|---|
| Scanning mode | Peak hopping |
| Dwell time | 100 ms |
| Integration mode | Peak area |
| Points per spectral peak | 1 |
| Isotopes | 89Y, 174Yb |
The morphology of the UCNPs was characterized by a H-7000FA transmission electron microscope (TEM, HITACHI, Tokyo, Japan). An XS105 Dual Range microbalance (Mettler Toledo Instruments Co., Ltd., Shanghai, China) was used for the weighing of reagents. A 320-S pH meter (Mettler Toledo Instruments Co., Ltd., Shanghai, China) was used for pH adjustment. A LEGEND MICRO 21R centrifuge (Thermo Fisher, Germany) was used for the centrifugation of NPs.
2.2 Reagents and materials
Ethyl-3-(3-dimethylaminepropyl) carbodiimide hydrochloride (EDC·HCl), 2-(N-morpholino)-ethanesulfonic acid (MES) and formic acid were purchased from Aladdin (Shanghai, China), N-hydroxysulfosuccinimide (Sulfo-NHS) was purchased from Shanghai Gongjia Technology Co., Ltd. (Shanghai, China). Poly(acrylic acid) (PAA) (average MW = 1800) was purchased from Sigma-Aldrich (St Louis, MO, USA). Y2O3, Er2O3 and Yb2O3 were purchased from Shanghai Yuelong Chemical Factory (Shanghai, China). NaF was purchased from Sinopharm Chemistry Reagent Co., Ltd. (Shanghai, China). High purity deionized water (18.2 MΩ cm) obtained from Milli-Q Element system (Millipore, Molsheim, France) was used throughout this work.Human AFP antigen, monoclonal mouse anti-human AFP antibody (coating, L1C00301, Ab1) and monoclonal mouse anti-human AFP antibody (labeling, L1C00304, Ab2) were purchased from Shanghai Linc-Bio Science Co., Ltd. (Shanghai, China). Ab1 and Ab2 bind to the different epitopes of AFP. Polystyrene 96-well microtiter plates (High binding, JET BIOFIL, Canada) were used for the immunoassay. Bovine serum albumin (BSA) was purchased from Ameresco (Solon, OH, USA). Human serum albumin (HSA), horse radish peroxidase (HRP), ovalbumin and β-casein were purchased from Sigma-Aldrich (St Louis, MO, USA). Skimmed milk was purchased from BD Biosciences (NY, USA). All reagents used were specpure or at least of analytical reagent grade unless stated otherwise. Human serum samples were provided by Hanchuan People's Hospital of Wuhan University (Wuhan, China). The ethics committee of Hanchuan People's Hospital of Wuhan University reviewed and approved the informed consent forms provided by all participants according to ethical requirements.
2.3 Buffers
The conjugating buffer solutions were MES solution (0.025 M, pH = 5.5) and HEPES solution (0.01 M, pH = 8.0). The immunoassay buffer solution was phosphate buffer solution (0.01 M PBS, pH = 7.4, 3.62 g of Na2HPO4·12H2O and 0.24 g of KH2PO4 dissolved in 1 L high purity deionized water). Na2CO3–NaHCO3 buffer solution (0.02 M, pH = 9.6) was used for coating the plates. The blocking solution was PBS with 1% (w/v) milk powder (the solution was filtered to skim the suspension with a 0.45 μm membrane prior to use). The washing solution was PBS with 0.05% (v/v) Tween 20 (pH = 7.4). The eluent was diluted formic acid (1.5 M).2.4 Synthesis of upconversion nanoparticles
![[thin space (1/6-em)]](https://www.rsc.org/images/entities/char_2009.gif) :
:![[thin space (1/6-em)]](https://www.rsc.org/images/entities/char_2009.gif) 0.18
0.18![[thin space (1/6-em)]](https://www.rsc.org/images/entities/char_2009.gif) :
:![[thin space (1/6-em)]](https://www.rsc.org/images/entities/char_2009.gif) 0.02) were dissolved in the concentrated nitric acid at 65 °C. Subsequently, the solution was heated to 140 °C to vaporize the solvent, and the precipitation was redissolved in 100 mL high purity deionized water. The solution was stocked for further use.
0.02) were dissolved in the concentrated nitric acid at 65 °C. Subsequently, the solution was heated to 140 °C to vaporize the solvent, and the precipitation was redissolved in 100 mL high purity deionized water. The solution was stocked for further use.
2.5 Preparation of UCNP–antibody conjugates
The preparation of the conjugates was carried out according to the literature45 with some modifications. Firstly, 20 mg of EDC·HCl and 20 mg of Sulfo-NHS were dissolved in 200 μL of MES buffer. Then, 5 μL of the suspension of the PAA coated NaYF4:Yb,Er@NaYF4 NPs was added into the EDC/NHS solution. The mixture was incubated at room temperature with general shaking for 1 h to activate the carboxyl groups of PAA. After the incubation, the activated UCNPs were centrifuged at 10![[thin space (1/6-em)]](https://www.rsc.org/images/entities/char_2009.gif) 000 rpm for 5 min, and re-dispersed in 200 μL of HEPES buffer. Subsequently, 5 μg of Ab2 was added into the suspension and kept overnight with general shaking for the conjugation of antibodies and PAA. After conjugation, the resulting NPs were centrifuged at 10
000 rpm for 5 min, and re-dispersed in 200 μL of HEPES buffer. Subsequently, 5 μg of Ab2 was added into the suspension and kept overnight with general shaking for the conjugation of antibodies and PAA. After conjugation, the resulting NPs were centrifuged at 10![[thin space (1/6-em)]](https://www.rsc.org/images/entities/char_2009.gif) 000 rpm for 5 min to remove the supernatant, and washed three times with HEPES buffer. Finally, the NPs were centrifuged at 3000 rpm four times to remove the precipitate. The supernatant was collected for the subsequent immunoassay. The UCNP–antibody conjugates were stable at 4 °C for at least a week.
000 rpm for 5 min to remove the supernatant, and washed three times with HEPES buffer. Finally, the NPs were centrifuged at 3000 rpm four times to remove the precipitate. The supernatant was collected for the subsequent immunoassay. The UCNP–antibody conjugates were stable at 4 °C for at least a week.
2.6 Immunoassay procedure
Fig. 1 shows the scheme of the sandwich immunoassay. Firstly, the 96-well plate was rinsed three times with 200 μL of washing buffer. Then, 100 μL of 10 μg mL−1 of Ab1 in coating buffer was immobilized on the 96-well plate by adsorption at 4 °C overnight. After rinsing three times with washing buffer, 100 μL of PBS with 1% (w/v) milk powder was added into each well and incubated for 1 h to saturate the uncoated active sites. Afterwards, the plate was rinsed three times, and 100 μL of AFP at different concentrations in PBS buffer was added into each well and incubated for 1 h at room temperature. After rinsing three times with 200 μL of washing buffer, 6 μL of UCNP–Ab2 conjugates (diluted in 100 μL of PBS with 1% (w/v) milk powder) was added into each well and incubated for 1.5 h. After incubation, the excess conjugates were removed by rinsing four times with 200 μL of washing buffer, and 100 μL of formic acid (1.5 M) was added into each well and kept there for 10 min for elution. Finally, the eluent was introduced to ICP-MS for the subsequent determination. All of the analytical results are the average for triplicate analysis unless otherwise stated.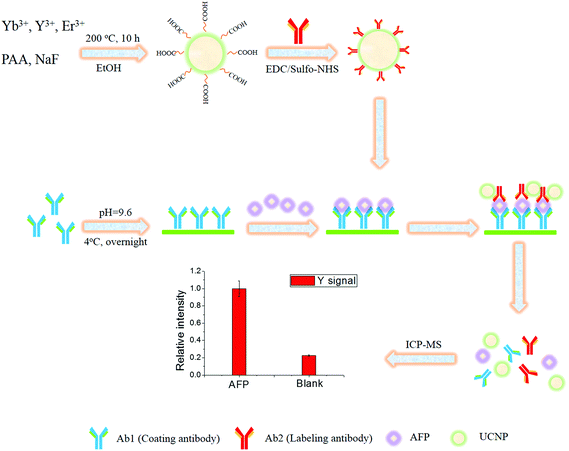 | ||
| Fig. 1 Scheme of the preparation of the UCNP–antibody conjugates and ICP-MS based sandwich immunoassay. | ||
3 Results and dissuasion
3.1 Preparation of the UCNP conjugates
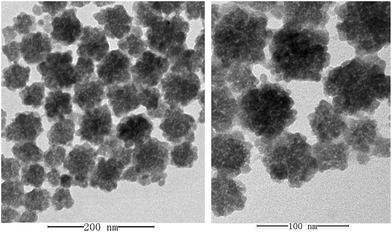
A one-pot process was employed for the synthesis of the UCNPs. To obtain a homogeneous dispersion, an excess of PAA was used for the modification of the UCNPs to improve the hydrophilicity, which also provided excess carboxyl groups for the bioconjugation of UCNPs and antibodies. TEM was employed for the characterization of the morphology of modified UCNPs and the images are shown in Fig. 2. The average diameter of the PAA modified UCNPs was about 40–55 nm, indicating that the PAA modified UCNPs were well dispersed in the solution.The concentration of UCNPs is an important factor in the preparation of UCNP conjugates. Although the signal amplification of UCNPs with higher concentration results in a higher sensitivity in ICP-MS to a certain extent, the increase of the background signal may also have a great influence on the limit of detection (LOD) of the method. In addition, the aggregation of UCNPs at high concentration may lead to the failure of preparation. In this experiment, 2, 5, 10 and 40 μL of UCNPs suspension have been tested by keeping the Ab2 amount at 5 μg, and 5 μL was selected as the optimal amount of UCNPs for the preparation of UCNP conjugates by taking into consideration both the sensitivity and the background signal. The centrifugation was also an important factor in the preparation of UCNP conjugates. After the excess antibodies and EDC/Sulfo-NHS were removed by centrifugation at 10![[thin space (1/6-em)]](https://www.rsc.org/images/entities/char_2009.gif) 000 rpm, a low speed centrifugation at 3000 rpm was adopted for the removal of UCNP–Ab2 conjugates of large size, which may lead to the high background signal due to the non-specific adsorption. To achieve effective removal, the low speed centrifugation step at 3000 rpm was repeated four times. In addition, to avoid the aggregation of nanoparticles, the ultrasonic-dispersion procedure was essential in each step.
000 rpm, a low speed centrifugation at 3000 rpm was adopted for the removal of UCNP–Ab2 conjugates of large size, which may lead to the high background signal due to the non-specific adsorption. To achieve effective removal, the low speed centrifugation step at 3000 rpm was repeated four times. In addition, to avoid the aggregation of nanoparticles, the ultrasonic-dispersion procedure was essential in each step.
It is known that the arrangement of atoms in NaYF4 is hexagonal close packed, which has an occupancy of 74.05%. Assuming that the diameter of an UCNP is 50 nm, the number of lanthanide atoms in one UCNP was estimated to be 5.54 × 10⁶, 1.48 × 10⁶ and 1.74 × 10⁵ for Y, Yb and Er, respectively. The detailed calculation is described in the ESI.†
3.2 Optimization of immunoassay parameters
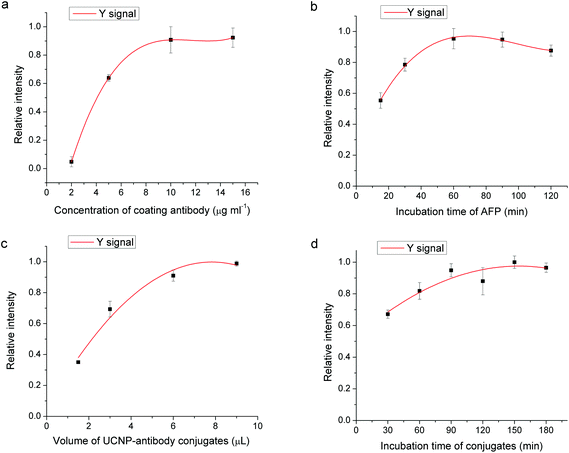
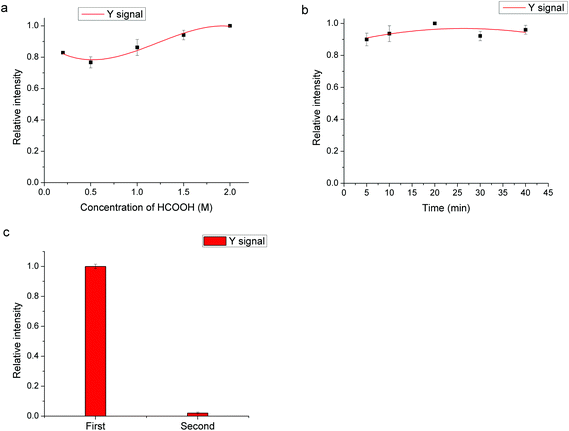
3.3 Specificity
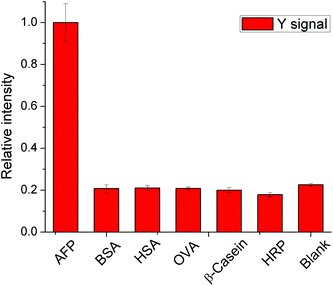
As a cancer biomarker which exists in the human serum, the determination of AFP may be affected by the numerous proteins in human serum samples. In this immunoassay, five proteins including BSA, HSA, HRP, ovalbumin and β-casein, which are abundant in biological samples, were chosen as representative interferents to investigate the specificity of the method. In this experiment, the concentration of AFP was chosen to be 20 ng mL−1 and the concentration of interferents was chosen to be 1 mg mL−1. As shown in Fig. 5, only the group with AFP had high response and the signal intensities in other groups were similar to the blank group, indicating good specificity of the method.3.4 Analytical performance
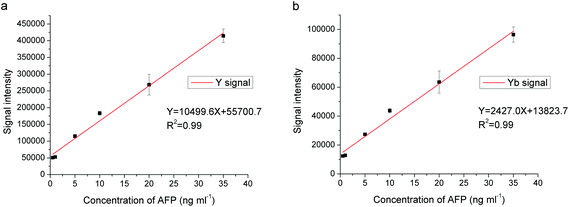
Under the optimized conditions, the analytical performance of the proposed method was evaluated. Fig. 6 shows the dependence of the Y and Yb signal intensity by ICP-MS on the concentration of AFP. Table 2 shows the analytical performance of the proposed method for the determination of AFP. As can be seen, the linear dynamic range for AFP ranged from 0.5 to 35 ng mL−1 with LOD (3σ) values of 0.31 ng mL−1 and 0.22 ng mL−1 based on 89Y and 174Yb, respectively. The reproducibility, expressed as the relative standard deviation (RSD) of the proposed method, was 4.8% based on both 89Y and 174Yb with nine replicate determinations of 5 ng mL−1 of AFP. A comparison of the analytical performance of the proposed method and other methods for the determination of AFP is given in Table 3. The LOD of the proposed method was comparable with other methods based on ICP-MS and chemiluminescence, but higher than the method based on ICP-MS with single particle mode.31 Compared with the luminescent assay based on UCNP labeling,29 the proposed method showed comparable sensitivity but with a wider linear dynamic range (0.18–11.44 ng mL−1 for the luminescent assay with UCNP tags). However, the LOD of the proposed method could be further improved by optimizing the synthesis of nanoparticles or adopting the single particle mode in the ICP-MS detection. Moreover, the UCNP–antibody conjugates have the potential for simultaneous detection by both ICP-MS (quantification) and fluorescence (imaging), and could therefore be considered as bifunctional probes. Generally, it can be concluded that UCNP is a competitive tag in ICP-MS based immunoassays compared with other metal tags, and its bifunctional capability may provide more insights in the immunoassay.| Element | LOD (ng mL−1) | Line range (ng mL−1) | RSD% (n = 9, c = 5 ng mL−1) | Equation | R 2 |
|---|---|---|---|---|---|
| Y | 0.31 | 0.5–35 | 4.8 |
Y = 10![[thin space (1/6-em)]](https://www.rsc.org/images/entities/char_2009.gif) 499.6X + 55 499.6X + 55![[thin space (1/6-em)]](https://www.rsc.org/images/entities/char_2009.gif) 700.7 700.7 |
0.99 |
| Yb | 0.22 | 0.5–35 | 4.8 |
Y = 2427.0X + 13![[thin space (1/6-em)]](https://www.rsc.org/images/entities/char_2009.gif) 823.7 823.7 |
0.99 |
| Tags | Detection | LOD (ng mL−1) | Ref. |
|---|---|---|---|
| a Eu-DTPA, diethylene-triamine-pentaacetic acid. b Pr-DOTA, Pr-Eu-1,4,7,10-tetraazacyclododecane-N,N′,N′′,N′′′-tetraacetic acid. c Cd/rhodamine B isothiocyanate-doped silica nanoparticles. | |||
| Eu/Ho | ICP-MS | 0.22 | 17 |
| Eu-DTPAa | ICP-MS | 1.2 | 6 |
| Sm | ICP-MS | 0.20 | 42 |
| Pr-DOTAb | ICP-MS | 8.2 | 44 |
| AuNPs | ICP-MS (single particle) | 0.016 | 43 |
| AuNPs | ICP-MS | 0.086 | 24 |
| Cd/RhBITC-doped SNPsc | ICP-MS | 0.37 | 33 |
| Luminol | Chemiluminescence | 0.16 | 46 |
| NaYF4:Yb,Tm/NaGdF4-gold nanorods (LET) | Luminescence | 0.16 | 41 |
| NaYF4:Yb,Er UCNPs | ICP-MS | 0.22 | This work |
3.5 Sample analysis
To demonstrate the potential for application of the proposed method in the clinical diagnosis, the proposed immunoassay was applied for the determination of AFP in human serum. Human serum was diluted five times with PBS buffer before it was subjected to the proposed immunoassay. To validate the accuracy, a spiking test was performed by adding different concentrations of AFP into the human serum and the spiked samples were also subjected to the proposed immunoassay. Considering the viscosity of the serum, each well was washed five times after the immunoreaction. Table 4 shows the analytical results of AFP in human serum. As can be seen, the recoveries at three spiking concentration levels ranged from 98.6 to 123%, indicating that the proposed method has excellent capability of tolerating the complex biological matrix. The proposed method was also applied for the determination of AFP in patients’ serum samples. As shown in Table 5, the analytical results obtained by the proposed method were in good agreement with the results obtained by chemiluminescence immunoassay, indicating a good accuracy of the proposed method.| Sample | Added (ng mL−1) | Found (ng mL−1) | Recovery (%) |
|---|---|---|---|
| Serum | 0 | 17.6 ± 0.7 | — |
| 3.5 | 21.1 ± 1.0 | 99.3 | |
| 7.0 | 24.5 ± 1.7 | 98.6 | |
| 14 | 34.8 ± 0.5 | 123 |
4 Conclusion
In this work, we established a simple, rapid, specific and sensitive immunoassay for the determination of AFP based on ICP-MS with UCNP as a new elemental tag. The conjugates of the UCNP and the antibody were prepared, and the determination of AFP was achieved by the ICP-MS detection of lanthanides contained in UCNP after the sandwich immunoreaction. The developed method has excellent matrix tolerance capability and a comparable LOD with other approaches, and its application potential in clinical diagnosis was demonstrated successfully by the determination of AFP in human serum. Furthermore, the bifunctional capability of UCNP may provide more feasibilities in the ICP-MS based methodology for biological research, e.g. cell counting by ICP-MS and cell imaging by near-infrared light simultaneously, which is under way in our laboratory.Acknowledgements
This work is financially supported by the National Nature Science Foundation of China (No. 21375097, 21205090, 21575107, 21575108), the National Basic Research Program of China (973 Program, 2013CB933900).References
- A. Prange and D. Proefrock, J. Anal. At. Spectrom., 2008, 23, 432–459 RSC.
- C. Zhang, F. B. Wu, Y. Y. Zhang, X. Wang and X. R. Zhang, J. Anal. At. Spectrom., 2001, 16, 1393–1396 RSC.
- N. Jakubowski, J. Messerschmidt, M. G. Anorbe, L. Waentig, H. Hayen and P. H. Roos, J. Anal. At. Spectrom., 2008, 23, 1487–1496 RSC.
- L. Waentig, N. Jakubowski, H. Hayen and P. H. Roos, J. Anal. At. Spectrom., 2011, 26, 1610–1618 RSC.
- Z. A. Quinn, V. I. Baranov, S. D. Tanner and J. L. Wrana, J. Anal. At. Spectrom., 2002, 17, 892–896 RSC.
- S. C. Zhang, C. Zhang, Z. Xing and X. R. Zhang, Clin. Chem., 2004, 50, 1214–1221 CAS.
- R. W. Hutchinson, R. L. Ma, C. W. McLeod, A. Milford-Ward and D. Lee, Can. J. Anal. Sci. Spectrosc., 2004, 49, 429–435 CAS.
- H. Y. Peng, B. B. Chen, M. He, Y. Zhang and B. Hu, J. Anal. At. Spectrom., 2011, 26, 1217–1223 RSC.
- X. W. Yan, Y. C. Luo, Z. B. Zhang, Z. X. Li, Q. Luo, L. M. Yang, B. Zhang, H. F. Chen, P. M. Bai and Q. Q. Wang, Angew. Chem., Int. Ed., 2012, 51, 3358–3363 CrossRef CAS PubMed.
- Z. Zhang, Q. Luo, X. Yan, Z. Li, Y. Luo, L. Yang, B. Zhang, H. Chen and Q. Wang, Anal. Chem., 2012, 84, 8946–8951 CrossRef CAS PubMed.
- Y. Liang, X. Yan, Z. Li, L. Yang, B. Zhang and Q. Wang, Anal. Chem., 2014, 86, 3688–3692 CrossRef CAS PubMed.
- X. D. Lou, G. H. Zhang, I. Herrera, R. Kinach, O. Ornatsky, V. Baranov, M. Nitz and M. A. Winnik, Angew. Chem., Int. Ed., 2007, 46, 6111–6114 CrossRef CAS PubMed.
- E. Razumienko, O. Ornatsky, R. Kinach, M. Milyavsky, E. Lechman, V. Baranov, M. A. Winnik and S. D. Tanner, J. Immunol. Methods, 2008, 336, 56–63 CrossRef CAS PubMed.
- D. R. Bandura, V. I. Baranov, O. I. Ornatsky, A. Antonov, R. Kinach, X. D. Lou, S. Pavlov, S. Vorobiev, J. E. Dick and S. D. Tanner, Anal. Chem., 2009, 81, 6813–6822 CrossRef CAS PubMed.
- S. C. Bendall, E. F. Simonds, P. Qiu, E. A. D. Amir, P. O. Krutzik, R. Finck, R. V. Bruggner, R. Melamed, A. Trejo, O. I. Ornatsky, R. S. Balderas, S. K. Plevritis, K. Sachs, D. Pe'er, S. D. Tanner and G. P. Nolan, Science, 2011, 332, 687–696 CrossRef CAS PubMed.
- C. Zhang, Z. Y. Zhang, B. B. Yu, J. J. Shi and X. R. Zhang, Anal. Chem., 2002, 74, 96–99 CrossRef CAS PubMed.
- V. I. Baranov, Z. Quinn, D. R. Bandura and S. D. Tanner, Anal. Chem., 2002, 74, 1629–1636 CrossRef CAS PubMed.
- O. Ornatsky, V. Baranov, D. R. Bandura, S. D. Tanner and J. Dick, J. Immunol. Methods, 2006, 308, 68–76 CrossRef CAS PubMed.
- Q. Zhao, X. Lu, C.-G. Yuan, X.-F. Li and X. C. Le, Anal. Chem., 2009, 81, 7484–7489 CrossRef CAS PubMed.
- R. Liu, X. Liu, Y. R. Tang, L. Wu, X. D. Hou and Y. Lv, Anal. Chem., 2011, 83, 2330–2336 CrossRef CAS PubMed.
- J. Ko and H. B. Lim, Anal. Chem., 2014, 86, 4140–4144 CrossRef CAS PubMed.
- W. J. Yang, Z. M. Xi, X. X. Zeng, L. Fang, W. J. Jiang, Y. N. Wu, L. J. Xu and F. F. Fu, J. Anal. At. Spectrom., 2016, 31, 679–685 RSC.
- J. M. Liu and X. P. Yan, J. Anal. At. Spectrom., 2011, 26, 1191–1197 RSC.
- X. Zhang, B. Chen, M. He, Y. Zhang, G. Xiao and B. Hu, Spectrochim. Acta, Part B, 2015, 106, 20–27 CrossRef CAS.
- B. B. Chen, B. Hu, P. Jiang, M. He, H. Y. Peng and X. Zhang, Analyst, 2011, 136, 3934–3942 RSC.
- X. Liu, R. Liu, Y. R. Tang, L. C. Zhang, X. D. Hou and Y. Lv, Analyst, 2012, 137, 1473–1480 RSC.
- H. K. Cho and H. B. Lim, J. Anal. At. Spectrom., 2013, 28, 468–472 RSC.
- H. K. Cho and H. B. Lim, Bull. Korean Chem. Soc., 2014, 35, 3195–3198 CrossRef CAS.
- Y. M. Xu, Y. Gao, X. Zhao, X. M. Xu, W. W. Zhou, Y. Liu, C. Y. Li and R. Liu, Microchem. J., 2016, 126, 1–6 CrossRef CAS.
- J. A. Ko and H. B. Lim, J. Anal. At. Spectrom., 2013, 28, 630–636 RSC.
- H. W. Choi, K. H. Lee, N. H. Hur and H. B. Lim, Anal. Chim. Acta, 2014, 847, 10–15 CrossRef CAS PubMed.
- H. Jang and H. B. Lim, Bull. Korean Chem. Soc., 2016, 37, 1433–1439 CrossRef CAS.
- J. A. Ko and H. B. Lim, Anal. Chim. Acta, 2016, 938, 1–6 CrossRef CAS PubMed.
- B. B. Chen, H. Y. Peng, F. Zheng, B. Hu, M. He, W. Zhao and D. W. Pang, J. Anal. At. Spectrom., 2010, 25, 1674–1681 RSC.
- Y. R. Tang, X. Jiao, R. Liu, L. Wu, X. D. Hou and Y. Lv, J. Anal. At. Spectrom., 2011, 26, 2493–2499 RSC.
- A. R. M. Bustos, L. Trapiella-Alfonso, J. R. Encinar, J. M. Costa-Fernandez, R. Pereiro and A. Sanz-Medel, Biosens. Bioelectron., 2012, 33, 165–171 CrossRef PubMed.
- A. R. Montoro Bustos, M. Garcia-Cortes, H. Gonzalez-Iglesias, J. Ruiz Encinar, J. M. Costa-Fernandez, M. Coca-Prados and A. Sanz-Medel, Anal. Chim. Acta, 2015, 879, 77–84 CrossRef CAS PubMed.
- F. Li, Q. Zhao, C. A. Wang, X. F. Lu, X. F. Li and X. C. Le, Anal. Chem., 2010, 82, 3399–3403 CrossRef CAS PubMed.
- L. Tong, E. Lu, J. Pichaandi, G. Y. Zhao and M. A. Winnik, J. Phys. Chem. C, 2016, 120, 6269–6280 CAS.
- S. Siripongsakun, S. H. Wei, S. Lin, J. Chen, S. S. Raman, J. Sayre, M. J. Tong and D. S. Lu, J. Gastroenterol. Hepatol., 2014, 29, 157–164 CrossRef CAS PubMed.
- H. Q. Chen, Y. Y. Guan, S. Z. Wang, Y. Ji, M. Q. Gong and L. Wang, Langmuir, 2014, 30, 13085–13091 CrossRef CAS PubMed.
- S. H. Hu, S. C. Zhang, Z. C. Hu, Z. Xing and X. R. Zhang, Anal. Chem., 2007, 79, 923–929 CrossRef CAS PubMed.
- S. Hu, R. Liu, S. Zhang, Z. Huang, Z. Xing and X. Zhang, J. Am. Soc. Mass Spectrom., 2009, 20, 1096–1103 CrossRef CAS PubMed.
- M. Terenghi, L. Elviri, M. Careri, A. Mangia and R. Lobinski, Anal. Chem., 2009, 81, 9440–9448 CrossRef CAS PubMed.
- Y. H. Li, Z. J. Wu and Z. H. Liu, Analyst, 2015, 140, 4083–4088 RSC.
- X. Pei, B. Chen, L. Li, F. Gao and Z. Jiang, Analyst, 2010, 135, 177–181 RSC.
Footnote |
| † Electronic supplementary information (ESI) available. See DOI: 10.1039/c6an01919f |
| This journal is © The Royal Society of Chemistry 2017 |

