 Open Access Article
Creative Commons Attribution 3.0 Unported Licence
Fluorescent benzimidazo[1,2-a]quinolines: synthesis, spectroscopic and computational studies of protonation equilibria and metal ion sensitivity†
Marijana
Hranjec
a,
Ema
Horak
b,
Darko
Babić
c,
Sanela
Plavljanin
a,
Zrinka
Srdović
a,
Ivana Murković
Steinberg
b,
Robert
Vianello
 *d and
Nataša
Perin
*a
aDepartment of Organic Chemistry, Faculty of Chemical Engineering and Technology, University of Zagreb, Marulićev trg 20, HR-10000 Zagreb, Croatia. E-mail: nperin@fkit.hr
bDepartment of General and Inorganic Chemistry, Faculty of Chemical Engineering and Technology, University of Zagreb, Marulićev trg 19, HR-10000 Zagreb, Croatia
cGroup for Computational Life Sciences, Ruđer Bošković Institute, Bijenička 54, HR-10000 Zagreb, Croatia
dComputational Organic Chemistry and Biochemistry Group, Ruđer Bošković Institute, Bijenička 54, HR-10000 Zagreb, Croatia. E-mail: robert.vianello@irb.hr
First published on 10th November 2016
Abstract
We describe the UV-Vis and fluorescence spectroscopic characterization of newly synthesised amino and diamino substituted benzimidazo[1,2-a]quinolines and their various 1![[thin space (1/6-em)]](https://www.rsc.org/images/entities/char_2009.gif) :
:![[thin space (1/6-em)]](https://www.rsc.org/images/entities/char_2009.gif) 1 metal complexes together with the related computational analysis of their acid/base properties and metal binding affinities. The work was performed in order to evaluate the photophysical features of these compounds and assess their potential chemosensor activity towards pH and metal ions in several polar and non-polar organic solvents. In addition, pH titrations and titration with metal chloride salts were carried out to determine the selectivity towards Co2+, Cu2+, Ni2+ and Zn2+ cations and explore their potential as chemosensors and pH probes. While all systems exhibit notable but impractical differences in sensitivities and spectral responses with the used metals, computational analysis aided in identifying benzimidazo[1,2-a]quinolines mono- and disubstituted with the piperazine fragment as very promising and efficient pH sensors in the acidic environment, particularly in the range of pH ≈ 3, which is extended to pH ≈ 6 upon the addition of metal cations. Their analytical features are significantly better than those involving the chain amino substituents, and their further development is strongly suggested.
1 metal complexes together with the related computational analysis of their acid/base properties and metal binding affinities. The work was performed in order to evaluate the photophysical features of these compounds and assess their potential chemosensor activity towards pH and metal ions in several polar and non-polar organic solvents. In addition, pH titrations and titration with metal chloride salts were carried out to determine the selectivity towards Co2+, Cu2+, Ni2+ and Zn2+ cations and explore their potential as chemosensors and pH probes. While all systems exhibit notable but impractical differences in sensitivities and spectral responses with the used metals, computational analysis aided in identifying benzimidazo[1,2-a]quinolines mono- and disubstituted with the piperazine fragment as very promising and efficient pH sensors in the acidic environment, particularly in the range of pH ≈ 3, which is extended to pH ≈ 6 upon the addition of metal cations. Their analytical features are significantly better than those involving the chain amino substituents, and their further development is strongly suggested.
Introduction
Optical sensors are widely used in biochemical and medicinal studies for the detection of biologically important molecules, and various cations and anions. Fluorescence spectroscopy in particular has long been viewed as a powerful tool for basic research in the biological sciences due to the notable progress made in instrumentation, and the synthesis and availability of novel fluorophores.1–4 The selective recognition and detection of transition metal cations are of great interest for many scientific studies due to their importance in chemical, biological, biomedical or environmental processes.5–7 Many of them are involved in the most important biological and biochemical processes, such as transmission of nerve impulses, muscle contraction and regulation of cell activity.8 For example, Zn2+ is an essential trace metal element responsible for the control of many cellular and enzymatic processes in living organisms, and it is also a contributory factor in neurological disorders, such as epilepsy and Alzheimer's disease.9,10 Also, Zn2+ has a specific structural function that allows the formation of peptides into multiple domains, or “zinc fingers”, by the coordination to amino acids like cysteine and histidine. Importantly, high levels of Zn can be cytotoxic and may cause serious problems such as skin disease, diabetes and some types of carcinoma. Co2+ is mainly retrieved in the corrin ring of vitamin B12, which is the original Co storage in biological systems, and is essential for the growth and metabolism of plants. Cu2+ is another necessary and important trace element, the third most abundant transition metal in the body and in the brain, responsible for the normal function of many tissues, like the immune system, the nervous system and the heart.11 Ni2+ is a nutritionally essential trace metal in several animal species, microorganisms and plants. On the other hand, fluorescent pH probes are widely used in analytical and biomedicinal chemistry,12 for measuring intercellular pH13,14 or monitoring pH in blood.15 Such probes are vital for the development of chemical sensors for biomedical diagnostics, cell biology and environmental monitoring.16,17 In summary, fluorescent sensors that provide high sensitivity, good selectivity, and rapid response are widely available and support multiple modes of detection.18 Their structure requires at least two functional sites: a recognition site where the host binds to the analyte, and a fluorophore which provides a spectroscopic signal dependent on the interaction with the analyte. Such response is mostly guided by the well-known photo-physical mechanisms of electron or charge transfer.19 The main challenge in the design and synthesis of novel fluorescent compounds for sensing applications is in providing both essential functions, recognition and signal transduction, in one molecule.One of the most extensively studied classes of organic fluorescent sensors is that based on heterocyclic compounds,20,21 which have excellent spectroscopic properties and selectively bind to essential cations and anions. Thus, they can be employed as sensitive and selective optical sensors in a wide range of biological, environmental, and chemical processes. Besides the fact that they are widely incorporated in the structure of numerous important natural and synthetic biochemical agents, benzimidazole and especially their benzannulated derivatives, due to the possession of a highly conjugated planar chromophore, offer promising applications in optoelectronics, optical lasers, fluorescence probes, organic luminophores or fluorescent dyes in traditional textile and polymer fields.22,23 A great variety of heterocyclic molecules have been employed for the development of optical sensors where the benzimidazole unit is one of the most important key building blocks.24–28 Additionally, the fluorescence of cyclic benzimidazole derivatives can be significantly altered by additional substituents placed on different positions of the planar chromophore or by condensation with other heterocycles, which leads to the extension of the conjugated aromatic surface.29 Recently, we explored the characteristics of 2-amino-5-phenylbenzimidazo[1,2-a]quinoline-6-carbonitrile as a selective chemosensor for detecting versatile metal cations. Importantly, the fluorescence intensity of this compound significantly increases upon the addition of Zn2+.30
Encouraged by the confirmed optical properties and application possibility of a biologically active amino substituted benzimidazo[1,2-a]quinoline skeleton for the detection of various cations in solution, we set out the spectroscopic and computational characterization of several 2-amino and 2,5-diamino substituted benzimidazo[1,2-a]quinolines by means of UV-Vis and fluorescence spectroscopy, density functional theory calculations, pH titrations and UV-Vis and fluorescence titrations with several metal cations in various polar and non-polar organic solvents.
Results and discussion
Synthesis
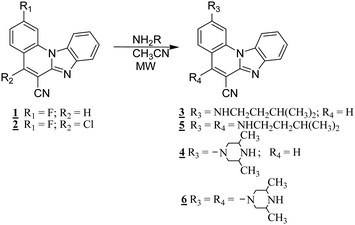
All newly prepared compounds were synthesized according to the previously published synthetic procedures. The main procedure is shown in Scheme 1. Based on the series of undertaken experiments in order to optimize the reaction times and yields, targeted amino and diamino substituted benzimidazo[1,2-a]quinolines 3–6 were finally prepared from the corresponding halogeno or dihalogeno substituted precursors 1–2 using uncatalyzed microwave assisted amination in low to moderate yields (28% to 33%). This reaction was performed in acetonitrile with an excess of five equivalents of the corresponding amine at 800 W power, 170 °C and 40 bar, while targeted compounds were purified by using column chromatography on silica gel.The structures of all prepared systems were determined by NMR analysis based on inspecting H–H coupling constants, chemical shifts and by mass spectroscopy. Generally, 1H NMR spectra of all amino substituted benzimidazo[1,2-a]quinolines showed a downfield shift of the aromatic protons in comparison to halogeno substituted precursors 1–2. Also, the appearance of protons related to amino substituents in the aliphatic region can be observed in both 1H and 13C NMR.
Spectroscopic characterization
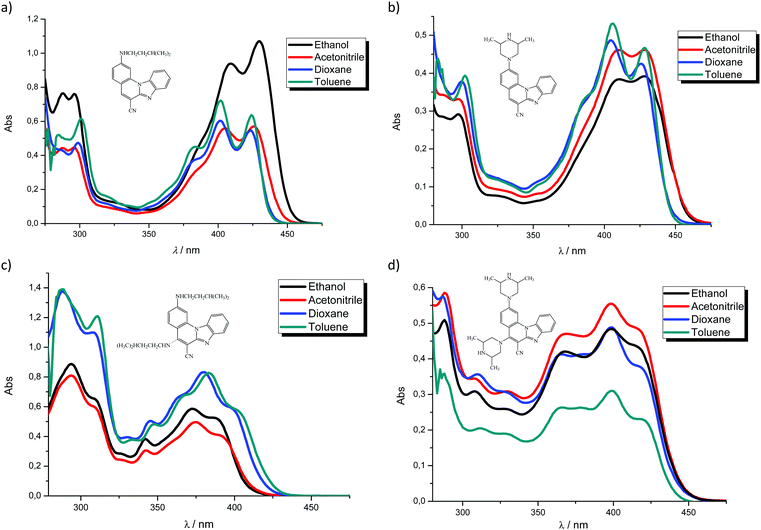
In order to study spectroscopic properties of 3–6, UV-Vis and fluorescence emission spectra were recorded in several organic solvents selected to ensure good solubility. To study the influence of the chosen solvents on the spectroscopic characteristics of the tested compounds, stock solutions were prepared in two polar solvents, namely ethanol and acetonitrile and two non-polar solvents toluene and dioxane.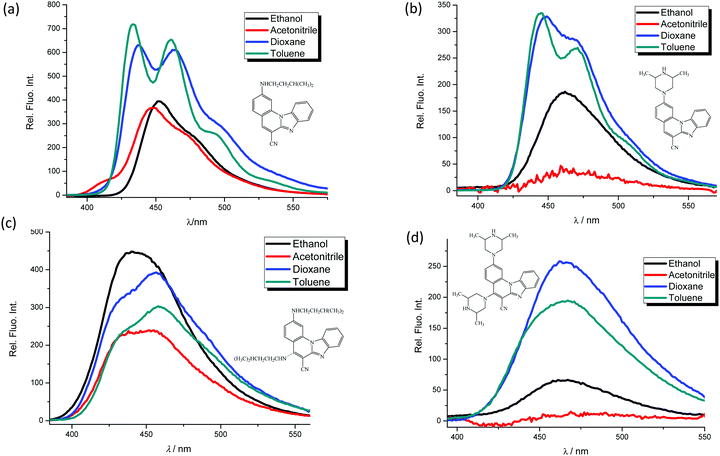 | ||
| Fig. 2 Fluorescence emission spectra in ethanol, acetonitrile, dioxane and toluene at the concentration of 1 × 10⁻⁷ mol dm−3 of 3 (a), 4 (b), 5 (c) and 6 (d), λexc. = 300 nm. | ||
| Compound | 3 | 5 | 4 | 6 | ||||||||||||
|---|---|---|---|---|---|---|---|---|---|---|---|---|---|---|---|---|
| Solvent | Eth | Acn | Dxn | Tol | Eth | Acn | Dxn | Tol | Eth | Acn | Dxn | Tol | Eth | Acn | Dxn | Tol |
| a Abbreviations Eth, Acn, Dxn and Tol correspond to ethanol, acetonitrile, dioxane and toluene, respectively. b The italicised wavelength values correspond to the most pronounced maximum in the visible region. | ||||||||||||||||
| λ max (nm) | 430 | 426 | 412 | 423 | 388 | 392 | 399 | 402 | 429 | 428 | 427 | 429 | 418 | 418 | 418 | 422 |
| 409 | 403 | 399 | 401 | 372 | 374 | 380 | 382 | 409 | 410 | 404 | 405 | 399 | 397 | 399 | 400 | |
| 296 | 295 | 299 | 381 | 342 | 341 | 345 | 348 | 296 | 298 | 299 | 301 | 367 | 366 | 363 | 365 | |
| 287 | 270 | 274 | 300 | 294 | 294 | 308 | 311 | 272 | 272 | 267 | 330 | 331 | 328 | |||
| 271 | 250 | 252 | 283 | 262 | 263 | 297 | 287 | 250 | 250 | 252 | 307 | 309 | 310 | |||
| 248 | 264 | 232 | 288 | 289 | 280 | |||||||||||
| ε × 103 (dm3 mol−1 cm−1) | 53.2 | 28.3 | 27.3 | 31.7 | 25.9 | 20.2 | 28.9 | 19.6 | 19.6 | 23.1 | 21.0 | 23.2 | 21.3 | 23.9 | 18.8 | 11.4 |
| 46.6 | 27.6 | 30.4 | 36.1 | 29.2 | 24.9 | 41.8 | 41.0 | 19.2 | 23.0 | 24.4 | 26.6 | 24.3 | 27.6 | 24.3 | 15.5 | |
| 37.8 | 22.2 | 23.3 | 22.4 | 19.4 | 14.9 | 24.7 | 24.0 | 14.5 | 16.5 | 18.8 | 19.5 | 21.2 | 23.6 | 20.7 | 13.1 | |
| 37.8 | 33.5 | 38.4 | 30.3 | 44.2 | 40.2 | 54.6 | 60.3 | 11.7 | 14.3 | 16.9 | 12.8 | 15.4 | 15.6 | |||
| 50.9 | 27.6 | 31.9 | 25.9 | 34.7 | 37.0 | 68.9 | 69.2 | 9.8 | 12.0 | 15.1 | 15.5 | 17.1 | 16.7 | |||
| 44.2 | 84.6 | 8.8 | 25.4 | 29.2 | 28.9 | |||||||||||
| λ emiss (nm) | 452 | 448 | 464 | 461 | 441 | 452 | 456 | 458 | 461 | 459 | 470 | 469 | 461 | 457 | 462 | 463 |
| 437 | 433 | 449 | 444 | |||||||||||||
| Rel. fluor. intensity | 396 | 366 | 607 | 652 | 446 | 238 | 392 | 301 | 185 | 42 | 282 | 269 | 65 | 10 | 256 | 193 |
| 624 | 719 | 328 | 333 | |||||||||||||
| Φ | 0.6760 | — | — | — | 0.1140 | — | — | — | 0.0482 | — | — | — | 0.0168 | — | — | — |
Effects of pH on spectral properties
Novel optical pH sensors and probes are usually characterized by their aqueous solution pKa values determined by spectrophotometry or spectrofluorometry.1–4 Optical evaluation of the concentrations of the acidic (HA) and basic forms (A−) is based on the Henderson–Hasselbach eqn (1):31 | (1) |
| Compound | λ abs (nm) | ε × 103 (dm3 mol−1 cm−1) | λ emiss (nm) | Stokes shift (cm−1) | pKac | ||||
|---|---|---|---|---|---|---|---|---|---|
| Acidica | Neutralb | Acidic | Neutral | Acidic | Neutral | Acidic | Neutral | ||
| (sh) = shoulder.a 0.1 M HCl.b MQ water.c ‘Apparent’ pKa value. | |||||||||
| 3 |
293
438 |
422
450 |
25.61
26.84 |
13.70
14.03 |
476 | 456 | 1822 | 292 | 2.91 |
| 5 |
238
305 343 379 |
294
344 375 392 |
21.38
18.20 10.32 9.42 |
21.32
11.22 14.77 14.57 |
461
503 |
460 | 4693 | 3513 | 3.31 |
| 4 |
290
425 |
267
284 397 416(sh) |
31.00
31.03 16.20 |
24.10
16.90 19.45 |
470 | 453 | 2143 | 2863 |
2.70
7.89 |
| 6 |
238
283 317 359 399 |
298
358 394 |
30.70
28.10 17.70 24.60 25.80 |
17.50
16.60 18.70 |
475 | 461 | 3885 | 3496 |
3.45
9.14 |
The potential use of 3–6 as pH sensing probes is based on the spectral changes caused by the protonation of the basic nitrogen atoms within the molecules. Protonation of 3 and 5 with 0.1 M HCl causes a hypsochromic (blue) shift (12 nm) of the absorption band in the visible spectrum. On the other hand, protonation of 4 and 6 results in a bathochromic (red) shift (5–9 nm) due to a greater resonance effect and enhanced molecule stability. Different behaviours of these two sets of systems are significant for their application and will be rationalized using computational analysis (see later).
In general, the effect of pH is more pronounced in the fluorescence spectra than in the absorption spectra. The binding of a proton alters and expands π-conjugation and changes the electron-accepting nature of the aromatic moieties. Therefore, protonation can cause changes in both emission intensity and colour. It is known that the spectral properties of aminated benzimidazo[1,2-a]quinolines are related to charge transfer interactions.32 As a result of protonation, the emission band of all compounds is bathochromically shifted (20–45 nm) whilst the fluorescence intensity considerably increases for 3, 4 and 6, while it decreases for 5. The spectral responses to pH for compound 6 are shown in Fig. 3. The Stokes shifts for 3 and 4 (Table 2) do not indicate large differences in energy upon excitation (6–45 nm), whilst the diamino substituted 5 and 6 had Stokes shift of up to 75 and 124 nm, which is significant for their potential application.
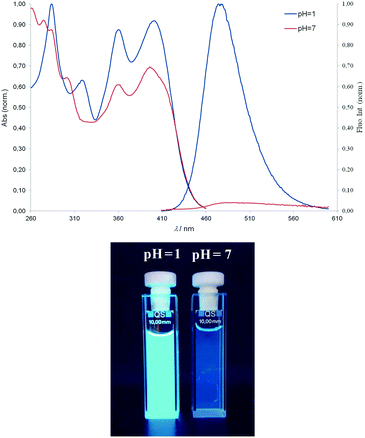 | ||
| Fig. 3 Typical absorption and fluorescence emission spectra of compound 6 (λexc. = 397 nm) in buffer at pH = 7 and pH = 1 (bottom). | ||
The typical UV-Vis spectral response of 6 at different pH values, and the corresponding titration curves are shown in Fig. 4. The relationship between the absorbance and pH is sigmoidal, so data points were fitted to the Boltzmann function eqn (2):
 | (2) |
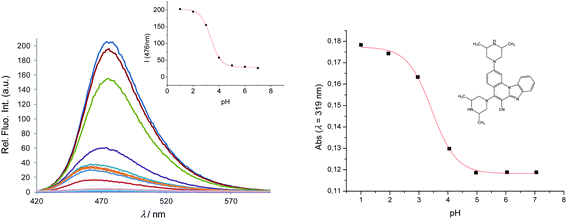 | ||
| Fig. 4 Fluorescence emission spectra of 6, 2 × 10⁻⁶ mol dm−3 at different pH values (left) and its calibration curve (right); absorbance versus pH at 319 nm. | ||
The acid–base properties are characterized by an 'apparent' pKa value (as opposed to a real thermodynamic pKa, since pH titrations were not performed under strictly controlled conditions of temperature and ionic strength), and are shown in Table 2. Unlike 3 and 5 which show pKa,app values of 2.91 and 2.7, respectively, both 4 and 6 show two values for pKa,app (2.7 and 7.9 for 4, and 3.45 and 9.14 for 6). This indicates that over the pH range examined, 4 and 6 exist in different pH sensitive forms which are spectrally detectable, from neutral molecules to dications, as demonstrated later by the computations.
Titrations with metal chloride salts
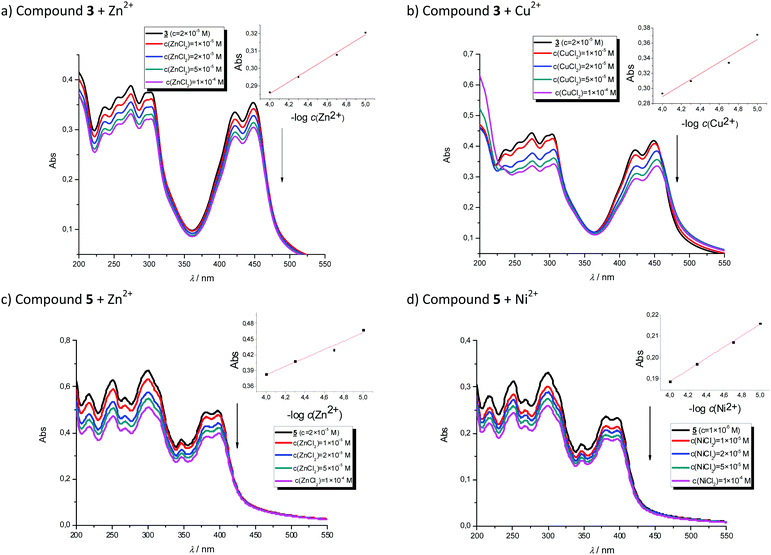
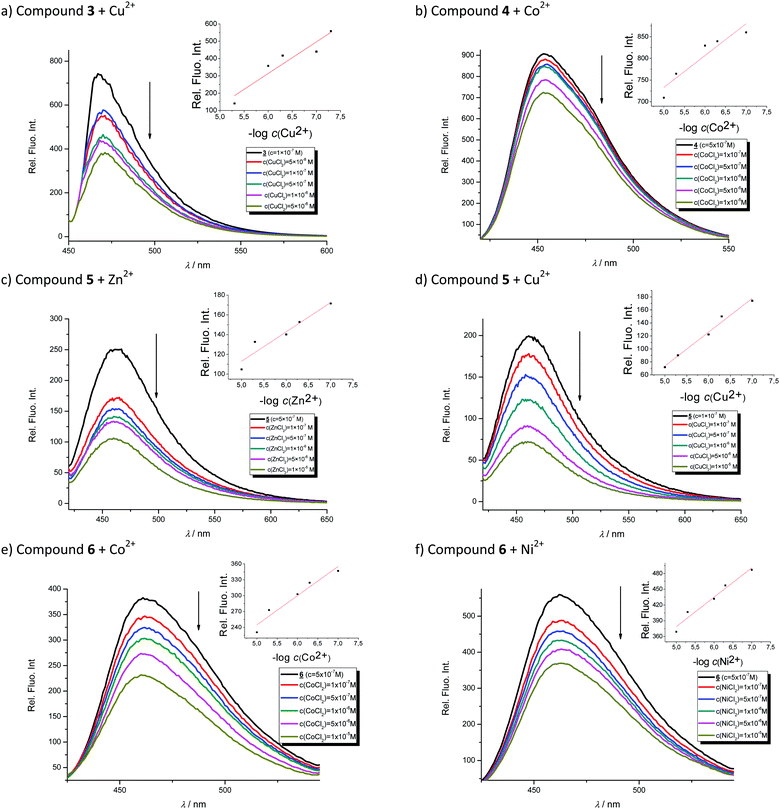
In order to evaluate the chemosensing ability of the studied amino and diamino substituted benzimidazo[1,2-a]quinolines 3–6 for the analytical detection of cations in aqueous solutions, their interaction with Co2+, Cu2+, Ni2+ and Zn2+ cations was evaluated through UV-Vis and fluorescence spectrophotometric titrations. Stock solutions of compounds were prepared in ethanol, while, during the titrations, small aliquots of stock solutions were added in MQ aqua at room temperature. Preliminary UV-Vis titrations were performed at the system concentration of 2 × 10⁻⁵ mol dm−3 and 1.5 × 10⁻⁵ mol dm−3, while metal chloride salts were added in increasing concentrations, from 1 × 10⁻⁵ mol dm−3, 2 × 10⁻⁵ mol dm−3, and 5 × 10⁻⁵ mol dm−3 up to 1 × 10⁻⁴ mol dm−3. Selected representatives are presented in Fig. 5.System 3 showed a decrease in absorbance intensity proportional to the concentration of Zn2+ (15% at both 422 and 449 nm) and Cu2+ cations (21% at 448 nm and 15% at 421 nm). We also noticed a slight (around 5 nm) bathochromic shift of both absorption maxima upon the addition of Ni2+. Moreover, 5 revealed a decrease in the absorbance intensity upon increasing the concentration of Zn2+ (21% at both 380 and 398 nm) and Ni2+ cations (20% at both 378 nm and 398 nm). Systems 4 and 6 showed very small or negligible changes in the absorbance intensity upon the addition of the cation. Our preliminary comparative fluorimetric titrations with the same metals were performed at the concentrations of 1 × 10⁻⁷ mol dm−3 for 3 and 5 × 10⁻⁷ mol dm−3 for 4, 5 and 6. Some selected results are presented in Fig. 6, which suggest that 3–6 display a consistent decrease in the fluorescence intensity with the addition of metal cations at concentrations from 1 × 10⁻⁷ to 1 × 10⁻⁵ mol dm−3. Interestingly, Cu2+ and Zn2+ induced the largest intensity quenching in 5, being 65% and 59%, respectively, while in 6 the effect of these two metals is significantly surpassed by the other two metals, namely Co2+ and Ni2+, assuming 34% and 39%, in the same order (Fig. 7), providing potential for different applications of these two systems.
In conclusion, we employed Job's continuous variation method33 to reveal the metal binding stoichiometry of 3–6. In doing so, we utilized the Cu2+ cation, which is selected as a representative example, to provide support for the computational analysis presented later. All four plots in Fig. S1 (ESI†) show a maximum intensity at the mole fraction of Cu2+ of 0.5 strongly implying 1![[thin space (1/6-em)]](https://www.rsc.org/images/entities/char_2009.gif) :
:![[thin space (1/6-em)]](https://www.rsc.org/images/entities/char_2009.gif) 1 complexation.
1 complexation.
Computational analysis
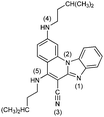
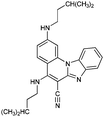
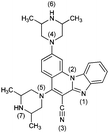
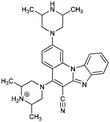
To rationalize the protonation states and the corresponding pKa values of the investigated systems, and to aid in interpreting how the latter are affected by metal cations, we performed a computational analysis using the B3LYP DFT functional and implicit SMD solvation corresponding to pure water. The calculated pKa values (Table 3) reveal that the selected computational methodology is very successful in predicting these parameters. In comparison with the six measured values, the average absolute deviation is only 0.4 pKa units with the largest difference of 0.7 pKa units for the first protonation of 6, which is remarkable. This lends credence to the rest of the computational data presented here.| System | Protonation state | pKa (calc)a | Protonation reaction | Structure at pH = 7 |
|---|---|---|---|---|
| a Experimental data measured in this work are given in square brackets. | ||||

|
3− | 23.7 | N4− → N4–H |

|
| 3 | 2.6 [2.91] | N1 → N1–H+ | ||
| 3+ | −6.0 | N4–H → N4–H2+ | ||
| 32+ | −22.3 | N3 → N3–H+ | ||
| 33+ | −38.1 | N1–H+ → N1–H22+ | ||
| 34+ | −42.9 | N2 → N2–H+ | ||
| 35+ | ||||

|
4− | 39.2 | N6− → N6–H |

|
| 4 | 8.1 [7.89] | N6–H → N6–H2+ | ||
| 4+ | 2.1 [2.70] | N1 → N1–H+ | ||
| 42+ | −6.5 | N4 → N4–H+ | ||
| 43+ | −23.1 | N3 → N3–H+ | ||
| 44+ | −39.8 | N1–H+ → N1–H22+ | ||
| 45+ | −69.8 | N2 → N2–H+ | ||
| 46+ | ||||
|
52− | 28.7 | N4− → N4–H |
|
| 5− | 21.1 | N5− → N5–H | ||
| 5 | 3.2 [3.3] | N1 → N1–H+ | ||
| 5+ | −1.1 | N4–H → N4–H2+ | ||
| 52+ | −13.4 | N5–H → N5–H2+ | ||
| 53+ | −26.9 | N3 → N3–H+ | ||
| 54+ | Unstable | |||
|
62− | 40.4 | N6− → N6–H |
|
| 6− | 38.8 | N7− → N7–H | ||
| 6 | 9.8 [9.14] | N7–H → N7–H2+ | ||
| 6+ | 3.9 [3.45] | N6–H → N6–H2+ | ||
| 62+ | 0.5 | N1 → N1–H+ | ||
| 63+ | −3.5 | N4 → N4–H+ | ||
| 64+ | −11.9 | N5 → N5–H+ | ||
| 65+ | −26.7 | N3 → N3–H+ | ||
| 66+ | −42.3 | N1–H+ → N1–H22+ | ||
| 67+ | −71.3 | N2 → N2–H+ | ||
| 68+ | ||||
Data in Table 3 suggest that the calculated acid/base properties could classify the investigated systems into two separate groups. Namely, 3 and 5 having chain amino substituents show differences in several distinct features from those of 4 and 6 bearing cyclic piperazine amino fragments. 3 and 5 are weakly acidic. Deprotonation of 3 to 3− is associated with pKa = 23.7, while 5 is slightly more acidic (pKa = 21.1) because deprotonation occurs on the amino group next to the cyano moiety which is known to exhibit a strong acidifying effect.34
Still, deprotonation of 4 and 6 is much more difficult and it would require very strong bases with a pKa of > 40 in water. More importantly, the first protonation of 3 and 5 occurs on the imidazole imino nitrogen with the pKa values of 2.6 and 3.2, respectively, with 5 being slightly more basic due to the electron donating effect of the additional neighbouring amino group that promotes basicity.35 The former is expected knowing that benzimidazole (pKa = 5.49) is more basic than, for example, N-methylaniline (pKa = 4.85) and N-ethylaniline (pKa = 5.12).36 One also observes that the basicity of both 3 and 5 is lower than that of benzimidazole, which we attribute to the unfavourable effect of the attached cyano group. The second protonation of 3 and 5 takes place on the substituent amino group further away from the cyano moiety; the pKa values were calculated as −6.0 and −1.1, respectively. This points to an important conclusion that, in water under normal conditions (pH = 7), both 3 and 5 are predominantly present as unionized neutral molecules, which will turn out to be the major and significant difference compared to 4 and 6 (see later).
The first protonation of 4 and 6 occurs on the unsubstituted piperazine nitrogen corresponding to the pKa values of 8.1 and 9.8, respectively, with the latter molecule already being appreciably basic and even surpassing the basicity of the isolated piperazine (pKa = 9.73).36 This leads to a conclusion that, unlike 3 and 5, in aqueous solution systems 4 and 6 are predominantly monocations, which is an important observation. Interestingly, the second protonation of 4 occurs on the imino nitrogen (pKa = 2.1), while in 6 it takes place on the other piperazine unit (pKa = 3.9), which is only then followed by the imino protonation (pKa = 0.5) to yield 63+.
The calculated differences in the acid/base features of 3 and 5 on one hand, and 4 and 6 on the other, help rationalize their different spectral properties, which is in excellent agreement with the observed spectral shifts induced by protonation with HCl (Table 2). Namely, introducing HCl into the solution of either 3 or 5 gives monoprotonated systems, which causes a hypsochromic (blue) shift of the absorption band. In contrast, for 4 and 6, it produces diprotonated 42+ and 62+, which increases the stability of systems through the enhanced electron redistribution and cationic resonance resulting in the bathochromic (red) shift. In this context, it is worth underlining the highest proton accepting abilities of 6, for which the data in Table 3 indicate a relative ease in forming even tri- and tetra-protonated systems 63+ and 64+, with the corresponding equivalents of even moderately strong acids. This would be evident in the absorption spectra, thus suggesting 6 as the most promising framework for the efficient pH sensor in the broad range of pH values.
In order to discuss the spectroscopic features of 3–6, energies of the excited states responsible for the experimental UV/Vis spectra in Fig. 1 were calculated using the TD-DFT method (Fig. S4, ESI†). The results reveal that the TD-DFT method quite well reproduced a trend within a very narrow range of the absorption maxima, which are for 6, taken as a representative example, calculated at 389, 388, 386 and 387 nm in toluene, dioxane, ethanol and acetonitrile, respectively (Fig. S4 and S8, ESI†), which is in reasonable agreement with the measured values of 400, 399, 399 and 397 (Table 1), in the same order. This is despite the fact that calculations show only a single band in the visible region in all solvents (Fig. S4, ESI†), while experiments display multiple bands in the same region (Fig. 1). In accounting this discrepancy, we note that the simulated spectra were obtained from pure vertical transitions without calculating vibronic contributions.37 Although vibronic transitions certainly affect the band shapes, we assume that the inaccuracies are more likely related to the recently reported problems with the low lying π–π* states of heteroaromatic molecules in TD-DFT calculations.38 As explained by Prlj et al.,38 the problem is in the unbalanced description of single and double excitations, which can, depending on the problem, result in both under- and overestimated energy differences between the first two π–π* transitions. Here, they are only overestimated with well-reproduced energies of the lowest transitions. We note in passing that variations in the DFT functional and basis sets had no significant impact on our results.
Nevertheless, the calculated λmax values show a reasonable correlation with the experimental values when all four systems 3–6 in all four organic solvents are considered (Fig. S8, ESI†). Differences between the lowest transition energies of 3–6 are in good correlation with the shifts of their lowest bands. Similarities between the experimental spectra of monosubstituted 3 and 4, and between disubstituted 5 and 6, are also present in the calculated spectra (Fig. S4, ESI†). On the other hand, the pronounced solvent effects of ethanol on 3 and of toluene on 6 were not found in the TD-DFT results. These effects must be due to some specific interactions with solvent molecules which are not involved at the present computational modeling level. It can be noted that similar solvents, like acetonitrile with 3, and dioxane with 6, did not produce a notable difference from other solvents. The spectral differences between mono- and diprotonated 6 (Fig. 3 and Fig. S5, ESI†) were also well reproduced in terms of the lowest transition energies, while agreement in relative intensities is modest.
We considered in more detail the excited states of 6, which is a representative example among the two piperazine derivatives with markedly better analytical features. The nature of the calculated excitations of 6 and its protonation forms was checked using the recently proposed ϕS descriptor.39 For all states with the oscillator strength ≥0.1 (termed active states), ϕS values were safely above 0.4 – the proposed threshold for states with significant charge transfer.39 Only a few other states (with negligible intensities) were close to this value. Although TD-DFT energies somewhat deviate from the exact values, the difference densities are very likely less affected and well outlined here. The difference densities (obtained by subtracting the ground state from the excited state density) of all active states are dominated by π-electron contributions from the central benzimadozole–quinoline part extended by the peripheral nitrogen atoms and the cyano group (Fig. S6, ESI†). The densities are approximately symmetric across the conjugation plane, which almost looks as a nodal plane, thus indicating that σ-electrons hardly participate in the lowest electronic transitions. Difference densities for the most intense transitions are not influenced much by the solvent; in almost all cases, their relative order is also the same (Fig. S6, ESI†). Beside the conjugated part, photoinduced density redistribution in 6 involves, to a lesser extent, a transfer to piperazine rings. The second transition involves charge transfer from quinoline to the proximal part of the 5-piperazine, which is also active in few higher transitions, in contrast to mostly inactive 2-piperazine (apart from the linking nitrogen atom). Rydberg states were not present among the active sites. The nature of the four lowest active states is also well preserved in the neutral and two protonated species of 6 (Fig. S7, ESI†), despite chemical perturbation by protonation.
The different acid/base properties of 3–6 are also reflected in their capabilities to bind metal cations, modelled here with the Cu2+ ions in a 1![[thin space (1/6-em)]](https://www.rsc.org/images/entities/char_2009.gif) :
:![[thin space (1/6-em)]](https://www.rsc.org/images/entities/char_2009.gif) 1 ratio, in accordance with the experiments presented earlier. The presence of Cu2+ significantly alters the pKa values of 3–6 (Fig. 8) as it favours their deprotonation so that, under normal conditions, all four systems are monoanions with Cu2+ bound to the most acidic site (Fig. 8). Since all 3–6 behave in the same way in this respect and assume the same monoanionic protonation state with CuCl2, this explains why their UV-Vis spectra show considerable similarities and no clear spectroscopic distinction among molecules is obvious.
1 ratio, in accordance with the experiments presented earlier. The presence of Cu2+ significantly alters the pKa values of 3–6 (Fig. 8) as it favours their deprotonation so that, under normal conditions, all four systems are monoanions with Cu2+ bound to the most acidic site (Fig. 8). Since all 3–6 behave in the same way in this respect and assume the same monoanionic protonation state with CuCl2, this explains why their UV-Vis spectra show considerable similarities and no clear spectroscopic distinction among molecules is obvious.
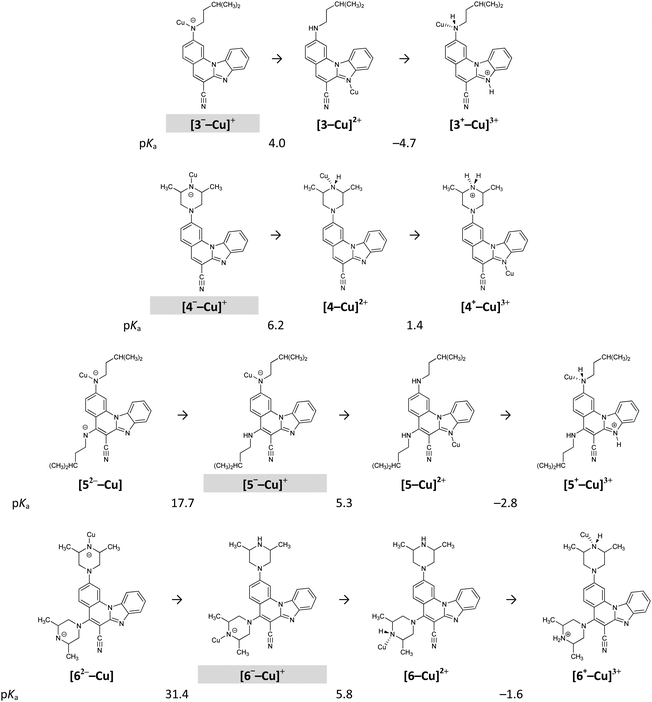 | ||
| Fig. 8 Calculated pKa values for the investigated systems in the presence of the Cu2+ ions. Shaded protonation states indicate the dominant form at neutral pH = 7.0. | ||
However, different behaviours are evident if one considers the strength of the interaction of the monoanionic 3−–6− with Cu2+. It turns out that deprotonated piperazine nitrogen in 4− and 6− forms significantly stronger interaction with Cu2+ than nitrogen of the chain amine fragment in 3− and 5−. This is demonstrated in the calculated interaction free energies with the Cu2+ ion, which in [M–Cu]+, where M = 3–6, are −46.4, −69.8, −44.5 and −70.5 kcal mol−1, respectively. The second deprotonation of [5−–Cu]+ and [6−–Cu]+ is associated with the pKa values of 17.7 and 31.4. This implies that it could occur under appreciably basic conditions, still much milder than without the Cu2+ ions, where it is associated with the pKa values of 28.7 and 40.4, respectively (Table 3). This is a general trend, in which the Cu2+ ions increase the acidity of a particular amino centre by around 10 orders of magnitude, in accordance with our previous observations for the glutathione tripeptide and the Cd2+ ions.40 Interestingly, only moderately strong acids are required (pKa between 4–6) to revert the monoanionic 3−–6− to their unionized forms (Fig. 8), which is worth further studies towards utilizing these systems as potential pH sensors in the presence of the metal cations and vice versa, since somewhat stronger acids (pKa between 2–4) are required to change the protonation state of 3–6 without the metal ions (Table 3).
Conclusions
In this work novel 2-amino and 2,5-diamino substituted benzimidazo[1,2-a]quinolines 3–6 were synthesized in order to study their optical properties. UV-Vis and fluorescence spectroscopic characterizations were performed in polar and non-polar solvents as well as pH- and different metal chloride titrations in water.The UV-Vis absorption spectra of 3–4 showed two main bands at 380–440 nm, while 5–6 displayed three main bands at 360–420 nm, which can be assigned to π–π* and n–π* electronic transitions, while bands at 250–325 nm correspond to the excitation of the conjugated π-system. 3 displayed the largest absorbance intensity in ethanol, while in other solvents significant hypsochromic effects were observed. 4 showed a hyperchromic effect in the absorbance intensity and a slight hypsochromic shift in non-polar solvents and ethanol, similarly to 5. 6 demonstrated the highest absorbance intensity in acetonitrile and a decreased intensity in toluene.
Emission spectra suggest that, in polar solvents, all systems exhibit fluorescence intensity quenching except 5, which showed the highest intensity in ethanol. In addition, the fluorescence quantum yield is strongly influenced by both the position and the type of the amino substituent on the tetracyclic framework. Thus, 2-N-isopentylamino substituted 3 revealed the highest quantum yield while 2,5-diamino derivatives showed very low yields (0.04 for 5 and 0.01 for 6).
The acid–base properties of 3–6 were examined and their pH sensing applicability was evaluated. All compounds exhibited spectral changes in the pH range 1–12 and a very strong pH sensitivity of fluorescence (in the range 450–500 nm), the latter making them promising candidates for efficient pH sensors. The bathochromic shift of the fluorescence emission band and a strong increase of the fluorescence intensity of 3, 4 and 6 occur on exposure to acidic solutions. It was found that 3–6 have potential for application in the acidic environment (pKapp in the range 2.70–3.45).
In order to determine the chemosensing ability of new systems, their interactions with Co2+, Cu2+, Ni2+ and Zn2+ cations were evaluated in 1![[thin space (1/6-em)]](https://www.rsc.org/images/entities/char_2009.gif) :
:![[thin space (1/6-em)]](https://www.rsc.org/images/entities/char_2009.gif) 1 complexes. All compounds recognize metal cations in solution, as evidenced by the quenching of fluorescence intensity and a decrease in the UV-Vis absorbance, still without a significant practical selectivity among cations. The exception is offered by 5 and 6, in which a much higher relative intensity decrease was observed with Cu2+ and Zn2+, and Co2+ and Ni2+ cations, respectively.
1 complexes. All compounds recognize metal cations in solution, as evidenced by the quenching of fluorescence intensity and a decrease in the UV-Vis absorbance, still without a significant practical selectivity among cations. The exception is offered by 5 and 6, in which a much higher relative intensity decrease was observed with Cu2+ and Zn2+, and Co2+ and Ni2+ cations, respectively.
Computational analysis aided in rationalizing the acid/base features of the investigated molecules and their abilities to bind metal cations. The study of the pKa values revealed that 3–6 could be divided into two distinct groups, which is experimentally evidenced in their different spectral properties, particularly in the shift of the absorption band in the visible spectrum. Namely, 3 and 5 having chain amino substituents are unionized under normal conditions, and upon the addition of HCl become monoprotonated at the corresponding imino centres to exhibit the hypsochromic (blue) shift of the absorption band. In contrast, 4 and 6 are significantly more basic and are predominantly monocations, which become diprotonated in the same acidic media resulting in the bathochromic (red) shift. Cu2+ addition favours monodeprotonation in all 3–6 under normal conditions, which diminishes their differences in spectral responses, however, it produces systems which become more sensitive to very mild changes in the solution pH values (around pH ≈ 4–6, as opposed to pH ≈ 2–4 without the metal ions) opening the door for utilizing these systems as potential pH sensors in the presence of metal cations and vice versa.
Experimental section
Synthesis
2-N-i-Pentylaminobenzimidazo[1,2-a]quinoline-6-carbonitrile 3. 3 was prepared from 1 (80 mg, 0.30 mmol) and isopentylamine (0.25 mL, 2.15 mmol) after 5 h of irradiation to yield 29 mg (29%) of yellow crystals; m.p. 200–205 °C. 1H NMR (300 MHz, DMSO-d6): δ 8.50 (d, J = 8.4 Hz, 1H, Harom.), 8.46 (s, 1H, Harom.), 7.94 (dd, J1 = 1.4 Hz, J2 = 7.8 Hz, 1H, Harom.), 7.80 (d, J = 8.9 Hz, 1H, Harom.), 7.74 (s, 1H, Harom.), 7.57 (dt, J1 = 1.0 Hz, J2 = 7.4 Hz, 1H, Harom.), 7.51 (dt, J1 = 1.3 Hz, J2 = 7.5 Hz, 1H, Harom.), 7.31 (t, J = 5.2 Hz, 1H, NH), 6.90 (dd, J1 = 1.7 Hz, J2 = 8.9 Hz, 1H, Harom.), 3.32 (q, J = 7.1 Hz, 2H, CH2), 1.80–1.75 (m, 1H, CH), 1.57 (q, J = 6.9 Hz, 2H, CH2), 0.98 (d, J = 6.5 Hz, 6H, CH3) ppm; 13C NMR (150 MHz, DMSO-d6,): δ 153.8, 145.9, 144.2, 140.1, 138.1, 132.8, 130.4, 124.3, 122.3, 119.5, 116.7, 114.3, 111.2, 92.0, 40.6, 37.3, 25.2, 22.4 (2C) ppm; elemental analysis: found C 76.93, H 5.99, N 17.08%; C21H20N4 requires C 76.80, H 6.14, N 17.06%; MS (ESI): m/z = 329.3 ([M + 1]+).
2-[N-(3,5-Dimethylpiperazinyl)]benzimidazo[1,2-a]quinoline-6-carbonitrile 4. Compound 4 was prepared from 1 (90 mg, 0.34 mmol) and 2,6-dimethylpiperazine (0.150 g, 1.30 mmol) after 6 h of irradiation to yield 39 mg (33%) of yellow powder; m.p. 263–268 °C. 1H NMR (300 MHz, DMSO-d6): δ 8.47 (s, 1H, Harom.), 8.43 (dd, J1 = 1.2 Hz, J2 = 7.1 Hz, 1H, Harom.), 7.94 (dd, J1 = 1.4 Hz, J2 = 7.6 Hz, 1H, Harom.), 7.84 (d, J = 9.1 Hz, 1H, Harom.), 7.68 (s, 1H, Harom.), 7.58 (dt, J1 = 1.2, J2 = 6.6 Hz, 1H, Harom.), 7.53 (dt, J1 = 1.3 Hz, J2 = 6.7 Hz, 1H, Harom.), 7.27 (dd, J1 = 1.7 Hz, J2 = 9.1 Hz, 1H, Harom.), 4.01 (d, J = 10.5 Hz, 2H, CH2), 2.95–2.90 (m, 2H, CH), 2.55 (d, J = 11.7 Hz, 2H, CH2), 1.13 (d, J = 6.2 Hz, 6H, CH3) ppm; 13C NMR (75 MHz, DMSO-d6): δ 154.2, 146.1, 144.5, 140.1, 138.5, 132.7, 130.7, 125.2, 123.3, 120.1, 116.9, 115.1, 112.9, 112.5, 97.8, 94.5, 53.6 (2C), 50.6 (2C), 19.5 (2C) ppm; elemental analysis: found C 74.40, H 6.08, N 19.52; C22H21N5 requires C 74.34, H 5.96, N 19.70%; MS (ESI): m/z = 356.3 ([M + 1]+).
2,5-Di-(N-i-pentylamino)benzimidazo[1,2-a]quinoline-6-carbonitrile 5. Compound 5 was prepared from 2 (200 mg, 0.72 mmol) and i-pentylamine (0.17 mL, 1.50 mmol) after 6 h of irradiation to yield 34 mg (28%) of white powder; m.p. 111–113 °C. 1H NMR (300 MHz, DMSO-d6): δ 8.27 (d, J = 8.2 Hz, 1H, Harom.), 8.13 (d, J = 9.3 Hz, 1H, Harom.), 7.68 (d, J = 7.5 Hz, 1H, Harom.), 7.62 (s, 1H, Harom.), 7.61 (t, J = 5.7 Hz, 1H, NH), 7.38 (t, J = 7.7Hz, 1H, Harom.), 7.28 (t, J = 7.8 Hz, 1H, Harom.), 6.93 (t, J = 4.6 Hz, 1H, NH), 6.78 (d, J = 9.3 Hz, 1H, Harom.), 3.85 (q, J = 6.9 Hz, 2H, CH2), 3.26 (q, J = 7.5 Hz, 2H, CH2), 1.81–1.69 (m, 2H, CH), 1.66 (q, J = 7.1 Hz, 2H, CH2), 1.55 (q, J = 6.8 Hz, 2H, CH2), 0.97 (d, J = 5.3 Hz, 6H, CH3), 0.94 (d, J = 5.3 Hz, 6H, CH3) ppm; 13C NMR (150 MHz, DMSO-d6): δ 157.7, 150.9, 150.1, 145.0, 136.9, 130.8, 130.5, 125.9, 123.5, 120.9, 118.3, 117.9, 113.1, 108.1, 104.8, 96.8, 40.6, 40.1, 38.4, 37.5, 25.3, 25.2, 22.4 (4C) ppm; elemental analysis: found C 75.37, H 7.54, N 17.09; C26H31N5 requires C 75.51, H 7.56, N 16.93%; MS (ESI): m/z = 414.3 ([M + 1]+).
2,5-Di-[N-(3,5-dimethylpiperazinyl)]benzimidazo[1,2-a]quinoline-6-carbonitrile 6. Compound 6 was prepared from 2 (100 mg, 0.36 mmol) and 2,6-dimethylpiperazine (0.100 g, 0.90 mmol) after 3 h of irradiation to yield 51 mg (32%) of yellow powder; m.p. 233–236 °C. 1H NMR (300 MHz, DMSO-d6): δ 8.27 (d, J = 7.9 Hz, 1H, Harom.), 7.86 (d, J = 9.4 Hz, 1H, Harom.), 7.81 (d, J = 7.6 Hz, 1H, Harom.), 7.61 (s, 1H, Harom.), 7.47 (t, J = 7.7 Hz, 1H, Harom.), 7.41 (t, J = 7.3 Hz, 1H, Harom.), 7.23 (dd, J1 = 1.4 Hz, J2 = 9.7 Hz, 1H, Harom.), 3.95 (d, J = 10.7 Hz, 2H, CH2), 3.54 (d, J = 11.0 Hz, 2H, CH2), 3.07 (m, 2H, CH), 3.00 (d, J = 11.3 Hz, 2H, CH2), 2.89 (m, 2H, CH), 2.46 (d, J = 9.5 Hz, 2H, CH2), 1.11 (d, J = 6.2 Hz, 6H, CH3), 1.05 (d, J = 6.18 Hz, 6H, CH3) ppm; 13C NMR (75 MHz, DMSO-d6): δ 157.7, 153.6, 148.7, 145.0, 138.7, 130.6, 129.3, 124.7, 122.4, 119.3, 117.2, 114.4, 112.0, 109.6, 101.5, 98.1, 59.3 (2C), 53.6 (2C), 51.4 (2C), 50.5 (2C), 19.6 (2C), 19.2 (2C) ppm; elemental analysis: found C 71.72, H 7.15, N 21.13; C28H33N7 requires C 71.92, H 7.11, N 20.97%; MS (ESI): m/z = 468.2 ([M + 1]+).
Spectroscopic characterization
UV-Vis absorption spectra were recorded, against the solvent, at (25 ± 0.1) °C, using a Varian Cary 50 spectrophotometer in double-beam mode. The wavelength range covered was 200–500 nm. Quartz cells of 1 cm path length were used throughout and the absorbance values were recorded at 0.1 nm. Fluorescence measurements were carried out on a Varian Cary Eclipse fluorescence spectrophotometer at 25 °C using 1 cm path quartz cells. Excitation maxima were determined from excitation spectra covering the range of 200–500 nm. Emission spectra were recorded from 400 to 600 nm and corrected for the effects of time- and wavelength-dependent light-source fluctuations using a standard of rhodamine 101, a diffuser provided with the fluorimeter and the instrument software. The measurements were done in ethanol, acetonitrile, toluene and dioxane (HPLC grade). Relative fluorescence quantum yields ϕ were determined according to Miller using eqn (3):| ϕx = ϕs × AsDxnx2/AxDsns2 | (3) |
pH titrations
In order to study the effect of pH on the spectroscopic properties of 3–6, UV-Vis and fluorescence emission spectra were recorded in universal buffer solutions covering the pH range 2–12. Solutions of 0.1 M hydrochloric acid and 0.1 M sodium hydroxide were used as terminal acidic and basic points in the titration experiments with 1 × 10⁻⁵ mol dm−3 solutions of 3–6 for the absorbance and 2 × 10⁻⁶ mol dm−3 for the fluorescence measurements. The excitation wavelengths were determined from the absorption spectra.Computational details
As a good compromise between accuracy and feasibility, computational analysis was performed using the B3LYP DFT functional employing the 6-31+G(d) basis set for the carbon, nitrogen and hydrogen atoms and the Stuttgart–Dresden (SDD) effective core potentials42 for the inner electrons of copper atoms and its associated double-ζ basis set for the outer ones. Thermal corrections were extracted from the corresponding un-scaled frequency calculations to obtain the free energies reported here. Gas-phase results were further refined with a single-point energy calculation employing a more flexible 6-311++G(2df,2pd) basis set. To account for the solvation effects, we included the SMD polarisable continuum model43 with all parameters for pure water, giving rise to the B3LYP/6-311++G(2df,2pd)/SDD//(SMD)/B3LYP/6-31+G(d)/SDD model. The choice of this computational setup was prompted by its success in reproducing the kinetic and thermodynamic parameters of various organic reactions,44 and predicting accurate pKa values for similar organic systems.35,45 pKa values were calculated in an absolute fashion employing a gas-phase proton free energy of G°(H+) = 6.28 kcal mol−1 and an experimentally determined value for the proton solvation free energy of ΔGSOLV(H+) = −265.9 kcal mol−1 in water,46 to be consistent with the value used by Truhlar and co-workers43 in parameterizing the SMD model. The latter value includes the free energy change associated with moving from a gas-phase pressure of 1 atm to a liquid-phase concentration of 1 M of −1.89 kcal mol−1.Excited state calculations were performed with the TD-DFT approach using the 6-31+G(d) basis set together with the M06 functional, which produced the best results among the four other DFT functionals tested here, namely B3LYP, CAM-B3LYP, PBE0 and ωB97X-D. 32 lowest singlet electronic excitations were determined employing the IEF-PCM implicit solvation model on geometries optimized at the (SMD)/B3LYP/6-31+G(d) level. Descriptors for difference densities39 were calculated using the program Nancy_EX 2.0,47 while all other calculations were performed using the Gaussian 09 software.48
Acknowledgements
Financial support by the Croatian Science Foundation (project IP-2014-09-3386 entitled Design and synthesis of novel nitrogen-containing heterocyclic fluorophores and fluorescent nanomaterials for pH and metal-ion sensing) is gratefully acknowledged. D. B. and R. V. wish to thank the Zagreb University Computing Centre (SRCE) for granting computational resources on the ISABELLA cluster and the CRO–NGI infrastructure.Notes and references
- B. Wang and E. V. Anslyn, Chemosensors: Principles, Strategies and Applications, Wiley-VCH, Weinheim, 2011 Search PubMed.
- B. Valeur, Molecular fluorescence-principles and applications, Wiley-VCH, Weinheim, 2002 Search PubMed.
- U. S. Spichiger-Keller, Chemical sensors and biosensors for medical and biological applications, Wiley-VCH, Weinheim, 1998 Search PubMed.
- P. A. Gale and C. Caltagirone, Anion Sensors, in Chemosensors: Principles, Strategies and Applications, ed. B. Wang and E. V. Anslyn, Wiley-VCH, Weinheim, 2011, pp. 395–427 Search PubMed.
- Y. Jeong and J. Yoon, Inorg. Chim. Acta, 2012, 381, 2–14 CrossRef CAS.
- (a) E. V. Anslyn, J. Org. Chem., 2007, 72, 687–699 CrossRef CAS PubMed; (b) B. T. Nguyen and E. V. Anslyn, Coord. Chem. Rev., 2006, 250, 3118–3127 CrossRef CAS.
- (a) T. Gunnlaugsson, M. Glynn, G. M. Tocci, P. E. Kruger and F. M. Pfeffer, Coord. Chem. Rev., 2006, 250, 3094–3117 CrossRef CAS; (b) C. Caltagirone and P. A. Gale, Chem. Soc. Rev., 2009, 38, 520–563 RSC.
- Y. Yang, Q. Zhao, W. Feng and F. Li, Chem. Rev., 2013, 113, 192–270 CrossRef CAS PubMed.
- (a) D. W. Choi and J. Y. Koh, Annu. Rev. Neurosci., 1998, 21, 347–375 CrossRef CAS PubMed; (b) Z. Xu, J. Yoon and D. R. Spring, Chem. Soc. Rev., 2010, 39, 1996–2006 RSC.
- (a) A. Ajayaghosh, P. Carol and S. Sreejith, J. Am. Chem. Soc., 2005, 127, 14962–14963 CrossRef CAS PubMed; (b) A. E. Lee, M. R. Grace, A. G. Meyer and K. L. Tuck, Tetrahedron Lett., 2010, 51, 1161–1165 CrossRef CAS.
- R. A. Lovstad, BioMetals, 2004, 17, 111–113 CrossRef CAS PubMed.
- D. Wencel, T. Abel and C. McDonagh, Anal. Chem., 2014, 86, 15–29 CrossRef CAS PubMed.
- J. Han and K. Burgess, Chem. Rev., 2009, 110, 2709–2728 CrossRef PubMed.
- R. Wang, C. Yu, F. Yu and L. Chen, TrAC, Trends Anal. Chem., 2010, 29, 1004–1013 CrossRef CAS.
- M. I. Stich, L. H. Fischer and O. S. Wolfbeis, Chem. Soc. Rev., 2010, 39, 3102–3114 RSC.
- W. Shi, X. Li and H. Ma, Methods Appl. Fluoresc., 2014, 2, 042001 CrossRef CAS.
- M. Schaferling, Angew. Chem., Int. Ed., 2012, 51, 3532–3554 CrossRef PubMed.
- B. Valeur and I. Leray, Coord. Chem. Rev., 2000, 205, 3–40 CrossRef CAS.
- A. P. de Silva, H. Q. N. Gunaratne, T. Gunnlaugsson, A. J. M. Huxley, C. P. McCoy, J. T. Rademacher and T. E. Rice, Chem. Rev., 1997, 97, 1515–1566 CrossRef CAS PubMed.
- N. Dash, A. Malakar, M. Kumar, B. B. Mandal and G. Krishnamoorthy, Sens. Actuators, B, 2014, 202, 1154–1163 CrossRef CAS.
- Y. Q. Ge, J. Jia, H. Yang, X. T. Tao and J. W. Wang, Dyes Pigm., 2011, 88, 344–349 CrossRef CAS.
- R. M. F. Batista, R. C. M. Ferreira, M. M. M. Raposo and S. P. G. Costa, Tetrahedron, 2012, 68, 7322–7330 CrossRef CAS.
- M. Hranjec, G. Pavlović, M. Marjanović, M. Kralj and G. Karminski-Zamola, Eur. J. Med. Chem., 2010, 45, 2405–2417 CrossRef CAS PubMed.
- D. Y. Kim and H. J. Kim, Sens. Actuators, B, 2015, 206, 508–515 CrossRef CAS.
- A. Kumar, M. Chhatwal and T. Gupta, Tetrahedron Lett., 2012, 53, 5691–5694 CrossRef CAS.
- S. H. Mashraqui, S. Sundaram and T. Khan, Chem. Lett., 2006, 35, 786–787 CrossRef CAS.
- A. Mishra, S. Chaterjee and G. Krishnamoorthy, J. Photochem. Photobiol., A, 2013, 260, 50–58 CrossRef CAS.
- (a) M. Yu, H. Lin, G. Zhao and H. Lin, J. Mol. Recognit., 2007, 20, 69–73 CrossRef CAS PubMed; (b) F. A. S. Chipem, S. K. Behera and G. Krishnamoorthy, Sens. Actuators, B, 2014, 191, 727–733 CrossRef CAS.
- N. Perin, M. Hranjec, G. Pavlović and G. Karminski-Zamola, Dyes Pigm., 2011, 91, 79–88 CrossRef CAS.
- M. Hranjec, E. Horak, M. Tireli, G. Pavlović and G. Karminski-Zamola, Dyes Pigm., 2012, 95, 644–656 CrossRef CAS.
- A. P. Demchenko, Anal. Bioanal. Chem., 2009, 395, 1195–1196 CrossRef.
- A. P. de Silva, H. Q. Nimal Gunaratne, T. Gunnlaugsson, A. J. M. Huxley, C. P. McCoy, J. T. Rademacher and T. E. Rice, Chem. Rev., 1997, 97, 1515–1566 CrossRef CAS PubMed.
- (a) P. Job, Ann. Chim., 1928, 9, 113–203 CAS; (b) J. S. Renny, L. L. Tomasevich, E. H. Tallmadge and D. B. Collum, Angew. Chem., Int. Ed., 2013, 52, 11998–12013 CrossRef CAS PubMed.
- (a) R. Vianello and Z. B. Maksić, J. Org. Chem., 2010, 75, 7670–7681 CrossRef CAS PubMed; (b) R. Vianello and Z. B. Maksić, New J. Chem., 2009, 33, 739–748 RSC; (c) R. Vianello and Z. B. Maksić, New J. Chem., 2008, 32, 413–427 RSC.
- I. Despotović and R. Vianello, Chem. Commun., 2014, 50, 10941–10944 RSC.
- D. D. Perrin, B. Dempsey and E. P. Serjeant, pKa Prediction for Organic Acids and Bases, Chapman and Hall, London, 1981 Search PubMed.
- F. Santoro and D. Jacquemin, Wiley Interdiscip. Rev.: Comput. Mol. Sci., 2016, 6, 460–486 CrossRef CAS.
- A. Prlj, M. E. Sandoval-Salinas, D. Casanova, D. Jacquemin and C. Corminboeuf, J. Chem. Theory Comput., 2016, 12, 2652–2660 CrossRef CAS PubMed.
- (a) T. Etienne, X. Assfeld and A. Monari, J. Chem. Theory Comput., 2014, 10, 3896–3905 CrossRef CAS PubMed; (b) T. Etienne, X. Assfeld and A. Monari, J. Chem. Theory Comput., 2014, 10, 3906–3914 CrossRef CAS PubMed; (c) T. Etienne, J. Chem. Theory Comput., 2015, 11, 1692–1699 CrossRef CAS PubMed.
- M. Glušič, J. Stare, J. Grdadolnik and R. Vianello, J. Inorg. Biochem., 2013, 119, 90–94 CrossRef PubMed.
- N. Perin, R. Nhili, K. Ester, W. Laine, G. Karminski-Zamola, M. Kralj, M. H. David-Cordonnier and M. Hranjec, Eur. J. Med. Chem., 2014, 80, 218–227 CrossRef CAS PubMed.
- D. Andrae, U. Häussermann, M. Dolg, H. Stoll and H. Preuss, Theor. Chim. Acta, 1990, 77, 123–141 CrossRef CAS.
- A. V. Marenich, C. J. Cramer and D. G. Truhlar, J. Phys. Chem. B, 2009, 113, 6378–6396 CrossRef CAS PubMed.
- (a) D. Saftić, R. Vianello and B. Žinić, Eur. J. Org. Chem., 2015, 7695–7704 CrossRef; (b) I. Picek, R. Vianello, P. Šket, J. Plavec and B. Foretić, J. Org. Chem., 2015, 80, 2165–2173 CrossRef CAS PubMed.
- (a) M. P. Coles, P. J. Aragón-Sáez, S. H. Oakley, P. B. Hitchcock, M. G. Davidson, Z. B. Maksić, R. Vianello, I. Leito, I. Kaljurand and D. C. Apperley, J. Am. Chem. Soc., 2009, 131, 16858–16868 CrossRef CAS PubMed; (b) R. J. Schwamm, R. Vianello, A. Maršavelski, M. Á. García, R. M. Claramunt, I. Alkorta, J. Saame, I. Leito, C. M. Fitchett, A. J. Edwards and M. P. Coles, J. Org. Chem., 2016, 81, 7612–7625 CrossRef CAS PubMed.
- M. D. Tissandier, K. A. Cowen, W. Y. Feng, E. Gundlach, M. H. Cohen, A. D. Earhart, J. V. Coe and T. R. Tuttle, J. Phys. Chem. A, 1998, 102, 7787–7794 CrossRef CAS.
- Nancy_EX-2.0 is a free post-processing tool for the analysis of the density and character of electronic excited states; http://https://sourceforge.net/projects/nancyex/, accessed Oct 15, 2016.
- M. J. Frisch, G. W. Trucks, H. B. Schlegel, G. E. Scuseria, M. A. Robb, J. R. Cheeseman, G. Scalmani, V. Barone, B. Mennucci, G. A. Petersson, H. Nakatsuji, M. Caricato, X. Li, H. P. Hratchian, A. F. Izmaylov, J. Bloino, G. Zheng, J. L. Sonnenberg, M. Hada, M. Ehara, K. Toyota, R. Fukuda, J. Hasegawa, M. Ishida, T. Nakajima, Y. Honda, O. Kitao, H. Nakai, T. Vreven, J. A. Montgomery, Jr., J. E. Peralta, F. Ogliaro, M. Bearpark, J. J. Heyd, E. Brothers, K. N. Kudin, V. N. Staroverov, R. Kobayashi, J. Normand, K. Raghavachari, A. Rendell, J. C. Burant, S. S. Iyengar, J. Tomasi, M. Cossi, N. Rega, J. M. Millam, M. Klene, J. E. Knox, J. B. Cross, V. Bakken, C. Adamo, J. Jaramillo, R. Gomperts, R. E. Stratmann, O. Yazyev, A. J. Austin, R. Cammi, C. Pomelli, J. W. Ochterski, R. L. Martin, K. Morokuma, V. G. Zakrzewski, G. A. Voth, P. Salvador, J. J. Dannenberg, S. Dapprich, A. D. Daniels, Ö. Farkas, J. B. Foresman, J. V. Ortiz, J. Cioslowski and D. J. Fox, Gaussian 09, Revision A.02, Gaussian, Inc., Wallingford, CT, 2009 Search PubMed.
Footnote |
| † Electronic supplementary information (ESI) available: Job's plots, spectroscopic data for precursors 1–2, calculated spectra and difference densities, correlation between computed and measured first excitation. See DOI: 10.1039/c6nj02268e |
| This journal is © The Royal Society of Chemistry and the Centre National de la Recherche Scientifique 2017 |

