Influence of phase transition from order to disorder and Philip's ionicity on the thermal expansion coefficient of pyrochlore type compositions with a multivalent environment†
Ushakumari A.
Renju
,
Padala
Prabhakar Rao
* and
Divakaran S.
Vaisakhan Thampi
Materials Science and Technology Division, CSIR-National Institute for Interdisciplinary Science and Technology, Trivandrum-695019, India. E-mail: padala_rao@yahoo.com; Fax: +91 471 2491712; Tel: +91 471 2515311
First published on 15th November 2016
Abstract
The present study involves a detailed investigation on interrelationships among Philip's ionicity, thermal expansion coefficient and ionic conductivity in a new series of pyrochlore type compositions, RE2Y2/3Zr2/3Nb2/3O7 (RE = La, Nd, Sm, Gd, Dy, Y) using high temperature X-ray diffraction studies, a transmission electron microscope, a Raman spectroscopic technique, electrical conductivity measurements and crystal chemistry principles. The system undergoes structural transition from an ordered pyrochlore structure to a disordered defect fluorite structure in the series with a phase boundary upon Gd substitution. The ionicity difference of M–O bonds follows the thermal expansion trend in the fluorite phase but opposes it in the pyrochlore phase. The ionicity of the A–O bond contributes more to the thermal expansion coefficient in the pyrochlore system unlike in perovskites where it is due to the cumulative effect of the A–O and B–O bonds. On the contrary, the ionic conductivity increases with the decrease in the ionicity difference associated with the charge carrier concentrations. The best conductivity obtained in the series is 7.9356 × 10⁻⁶ S cm−1 for Y2(Y1/3Zr1/3Nb1/3)2O7 at 1023 K. The minimum thermal expansion coefficient is obtained at the phase boundary for Gd2Y2/3Zr2/3Nb2/3O7 and the value is 5.2 × 10⁻⁶ K−1. Furthermore, the anomalous behaviour of Sm and Nd compounds is explained based on the ionicity of M–O bonds. These results demonstrate that the ionicity difference plays a great role in determining the thermal expansion and ionic conductivity of pyrochlore based materials.
1. Introduction
Pyrochlore oxides find innumerable applications in materials science, from highly insulating materials to metallic materials, dielectric, piezo/ferroelectric and magnetic materials, and fluorescence and phosphorescence host materials,1 ionic conductors, gas sensors and nuclear waste immobilization,2 due to their high chemical stability, high catalytic activity, high melting temperature, and excellent oxide ion conductivity. The pyrochlore structure can be viewed as consisting of octahedra of highly charged cations with an ionic radius of 0.6–0.7 Å (B at 16c) coordinated by oxygen ions (48f). These octahedra share corners to form (B2O6)∞. The larger A cations (16d) of the ionic radius 0.9–1.2 Å occupy the holes formed by the octahedral network of B cations. The remaining one extra anion at (8b) is placed in the structure, one to every B2O6 octahedra.18 Pyrochlore is also considered as a superstructure of a simple cubic fluorite structure,3 with the general formula A2B2O6O′, belonging to the space group Fd3m (a ≈ 10 Å (twice that of the fluorite), Z = 8).1 Mostly, A is a trivalent rare earth oxide, but can be mono- or divalent cations and B is a 3d, 4d or 5d transition metal ion with appropriate valence to maintain the stoichiometry of the composition VIIIA2VIB2IVO6IVO′4 (the Roman letters in superscript show the coordination number of each species). Pyrochlore oxides lend themselves to a wide variety of substitutions at the A, B and O sites and can tolerate vacancies at the A and O sites.4 Another significant factor which makes pyrochlore a prime candidate in the field of materials science is its inclination to show disordering effects, i.e. to randomise the distribution of two cations (16d and 16c to 4a) and the corresponding redistribution of two anion lattice sites (48f and 8b to 8c), to transform into a more disordered fluorite structure.5The additional ordering in pyrochlore oxides (compared to the fluorite structure) arises due to the ionic radius mismatch between the A and B cations.3 The stability of the pyrochlore oxides is defined using the tolerance factor defined by
Among various pyrochlore type oxides, lanthanide zirconates, Ln2Zr2O7, are extensively studied due to their complex crystal chemistry, low thermal conductivity, a high thermal expansion coefficient, and high chemical stability and find applications in the field of ionic conductors, superconductivity, catalysis, luminescence, dielectric, gas sensors, ferromagnetism, thermal barrier coating, and immobilization hosts of actinides in nuclear waste.8 The lanthanide zirconates garb the pyrochlore structure when ions lighter than Gd3+ ions occupy the A site and when heavier ions occupy the fluorite structure.1 Due to their immense applications and wide range of compositions, a huge number of investigations have been carried out to optimize their properties, which are required for their application. Similar to other pyrochlore oxides, lanthanide zirconates also exhibit phase transition from the pyrochlore to the fluorite structure with an increase in temperature and the transition temperature is found to decrease with a decrease in the ionic radius of Ln3+.9 The studies on the oxide ion conducting properties of the lanthanide zirconates show that the conductivity is maximum in the vicinity of the pyrochlore to fluorite transition.10 The dielectric studies of Soloman et al. showed that Ln2Zr2O7 (Ln = Ce, Pr, Nd, Sm, Gd, Dy, Er and Yb) prepared via auto-ignition methods exhibit an increasing impedance as the radius ratio decreases from 1.588 to 1.463 and then decreases upon further decreasing the ionic radius ratio. This indicates that at the phase boundary of pyrochlore to defect fluorite there is distortion in the structural symmetry.11 The molecular dynamics calculation of lanthanide zirconates for the thermal expansion coefficient shows that the thermal expansion coefficient increases as the lanthanide ion radius decreases.12 The experimental support for this fact is given by Kutty et al. and it has been reported that the thermal expansion coefficient of Ln2Zr2O7 lies in the range of 8–11 × 10−6 K−1.13 The studies show that lighter lanthanide zirconates are suitable for thermal barrier coating applications,14 and heavier zirconates are suitable for oxide ion conducting applications.10 The phase transformation from the pyrochlore to fluorite structure introduces disorder and new paths for oxide ion movement, thus increasing ionic conductivity and thermal conductivity.
In this work, the correlation of the structural properties and thermophysical properties of lanthanide zirconates with multivalent (trivalent and pentavalent) ions on the zirconium site will be investigated on the basis of crystal chemistry of the pyrochlore oxides. The study of Wuensch et al.15 on the oxide ion conductivity and structural changes of pyrochlore with composition and temperature shows that the disorder cannot be induced merely by reducing the ionic radius ratio of the A and B cations; but that bonding characteristics also play a major role in determining the structural stability, which in turn influences the thermal expansion coefficient and oxide ion conductivity. In pyrochlore oxides the selection of B-site cations is more important than that of A site cations due to the smaller size and higher ionic charge of the B cations, which results in a much stronger B–O bond than the A–O bond. Hence, the B–O bond energy greatly affects the properties of the pyrochlore lattice.12 The studies of Radhakrishnan et al. also showed that the B–O bond energy plays a great role in determining the ionic conductivity of the pyrochlore system.4 However, the effect of the multivalent ion at the B-site of pyrochlore oxides is yet to be explored. Here, in this work, the structural aspects of the simultaneous substitution of the Y3+ and Nb5+ ions at the Zr4+ site is studied. Irvine et al. assumed that the Nb5+ ions are oppositely charged when compared with Y3+ since it has a higher charge and a smaller ionic radius. Thus simultaneous substitution of Y3+ and Nb5+ to the Zr4+ site might reduce both the vacancy association and strain induced in the lattice and hence an increase in the oxide ion conductivity can be expected.16 The paper is focussed on the explanation for the thermal expansion coefficient, oxide ion conductivity and structural stability on the basis of the chemical bond point of view for the pyrochlore system. The pyrochlore system is yet to be explored on this basis. The fractional ionicity of individual bonds (fμi) is calculated theoretically for A–O and B–O bonds. It is found that in the case of perovskite systems the oxygen ionic conductivity and the thermal expansion coefficient decrease with the difference in ionicity Δfi between the A–O bond and the B–O bond.17 In this paper the influence of the simultaneous substitution of the trivalent and pentavalent ions on the B site ion on the thermal expansion coefficient and ionic conductivity will be discussed from a chemical point of view.
2. Experimental
Compositions, RE2Y2/3Zr2/3Nb2/3O7 (RE = La, Nd, Sm, Gd, Dy, Y), were prepared via the conventional ceramic route using La2O3 (Sigma-Aldrich, 99.99%), Nd2O3 (Alfa Aesar, 99.9%), Sm2O3 (Alfa Aesar, 99.9%), Gd2O3 (Alfa Aesar, 99.9%), Dy2O3 (Sigma-Aldrich, 99.9%), Y2O3 (Aldrich, 99.99%), ZrO2 (99%), and Nb2O5 (Aldrich) as starting materials. The precursor chemicals were dried in an air oven before being weighed. The stoichiometric raw materials were mixed in an agate mortar in wet medium using acetone. Then, the mixture was dried in an air oven at 100 °C for 1 h. This procedure of mixing and subsequent drying was repeated thrice to obtain a homogenous mixture. The powdered samples were then calcined at 1500 °C for 12 h. The calcined product was ground into a fine powder and pressed into cylindrical pellets of 10 mm diameter and 2–3 mm height using a hydraulic press. Pellets were sintered at 1600 °C for 6 h.Powder X-ray diffraction patterns were recorded to identify the crystalline phase of the sintered samples under Ni filtered CuKα radiation using a Philips X'pert Pro diffractometer operating at 45 kV and 30 mA. Scans were recorded over a 2θ range of 10–90° with a step size of 0.02 and a scan time of 30 s using X'pert software. The unit cell parameters were calculated using a least-squares method and Rietveld analysis using high score plus software. The lattice thermal expansion studies were carried out using Philip's X'pert Pro unit equipped with Anton Paar HTK attachment and taking the XRD pattern of the sample for 2θ = 10–90° in the temperature range of 298–1273 K at a regular interval of 200 K in static air. The Raman spectra of the prepared samples were recorded using a WITec alpha 300R confocal Raman microscope. The Raman confocal microscope was equipped with a 100× oil immersion objective and 300/600 grove grating. A 532 nm laser source was used for excitation and a CCD detector operating at room temperature was used for detection. The number of accumulations and the integration time used were 5 and 1 s respectively. The high resolution transmission electron microscopy and selected area electron diffraction (SAED) of the prepared samples were carried out using a TECNAI 30G2 S-TWIN transmission electron microscope (FEI, The Netherlands). The samples for the TEM analysis were prepared by drop casting the samples onto carbon coated copper grids, which were dispersed in acetone medium via ultrasonification. The copper grids were then dried. For impedance measurement, silver paste was applied on the flat faces of the pellets. The silver coated pellets were placed in an oven at 473 K for 6 h, and the measurements were carried out from room temperature to 1023 K in the frequency range from l Hz to 1 MHz by applying an ac voltage of 100 mV using a computer controlled impedance analyser (Solatron, SI 1260). The complex impedance plots were made using SMART software.
3. Results and discussion
The compositions RE2Y2/3Zr2/3Nb2/3O7 (RE = La, Nd, Sm, Gd, Dy, and Y) were prepared using conventional solid state reaction methods. In this system, it is expected that the A site of the pyrochlore type structure is occupied by the rare earth elements RE = La, Nd, Sm, Gd, Dy, and Y, and the B site is equally taken up by trivalent yttrium, tetravalent zirconium, and pentavalent niobium ions based on their ionic size and co-ordination requirements. These compositions maintain the metal to oxygen ratio for a pyrochlore type structure with a variation of lanthanides at the A site leading to a phase transition in the system.3.1. Structural analysis using X-ray diffraction methods
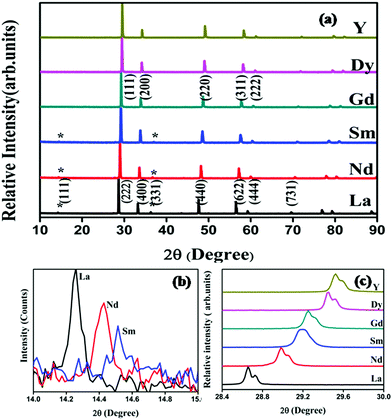
Powder X-ray diffraction patterns of the compositions RE2Y2/3Zr2/3Nb2/3O7 are shown in Fig. 1. The XRD patterns are indexed with the pyrochlore structure for compositions having RE = La, Nd, Sm, and the remaining ones are indexed to the fluorite structure. The pyrochlore structure is a fluorite type superstructure of the lattice. The strong reflections in the pyrochlore structure correspond to the fluorite array of atoms and the additional ordering in the pyrochlore structure is shown by the weak reflections which are indexed as (111), (331) and (731). The intensity of the weak reflection in the XRD provides information about oxygen scattering length, distribution of oxygen vacancies, and the x-parameter of the 48f oxygen.19 Dickson et al. showed that the (111) reflection is more sensitive to the oxygen x-parameter.20 From Fig. 1(b) it can be seen that the intensity of the superstructure peaks diminishes as the radius of the lanthanide ion at the A site decreases. This decreasing intensity of the superlattice peaks indicates a phase transition from a more ordered pyrochlore crystal structure to a more disordered fluorite structure. In Fig. 1(c) the shift of the main peak with the lanthanide ion is shown.The order–disorder phase transition occurs upon decreasing the tolerance factor defined using the radius ratio of the cations at the A site (eight coordinated) to that at the B site. The ordered pyrochlore structure is favoured within the range of the tolerance factor of 1.46–1.78.21 Here, for the current series of compounds, the radius ratio varies between 1.35 and 1.54. (The ionic radii of rare earth ions and the used transition metals are obtained from Shannon's table.22) The lattice parameter against the radius ratio is shown in Fig. 2. The lattice parameters of the fluorite structured compositions are doubled to compare with the pyrochlore structure. The lattice parameter varies linearly with the ionic radius ratio of the A and B cations in pyrochlore type compositions.23 An abrupt change in the lattice parameter occurs as the Sm3+ ion is replaced by the Gd3+ ion and this may be due to the transition from the ordered pyrochlore structure to the more disordered defect fluorite structure.
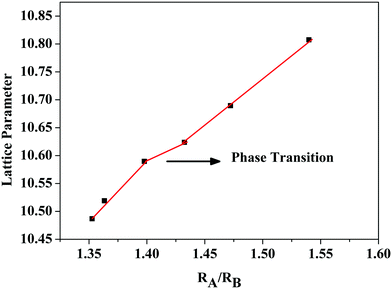 | ||
| Fig. 2 Variation of the lattice parameter of the compositions RE2Y2/3Zr2/3Nb2/3O7 with the radius ratio. | ||
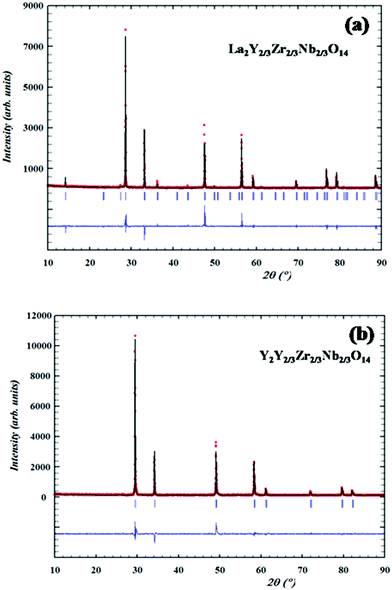
Structural analyses of the XRD patterns are carried out via Rietveld analysis using Fullprof Software. The initial crystal structure is modelled with that of the pyrochlore (space group Fd3m) and the occupancies are assigned as in the stoichiometric ratio. The A cation (A = La, Nd, Sm,) is at 16d (1/2, 1/2, 1/2) sites and the B cations (B = Y, Zr, Nb) are equally and simultaneously distributed at 16c (0, 0, 0); the anions are distributed at two distinct positions namely 48f (x, 1/8, 1/8) and 8b (3/8, 3/8, 3/8) and for the fluorite structure the occupancies of the cations sites are also assigned according to the stoichiometry. In the Rietveld process, the scale factor, flat background, specimen displacement and unit cell parameters are refined and the peak profile is fitted using the pseudo-Voigt profile function. The Caglioti parameters are also refined. The refined XRD pattern of the pyrochlore La2Y2/3Zr2/3Nb2/3O7 and fluorite Y2Y2/3Zr2/3Nb2/3O7 patterns are shown in Fig. 3a and b and the results of the refined parameters are shown in Table 1.
| Sample | La | Nd | Sm | Gd | Dy | Y | |
|---|---|---|---|---|---|---|---|
| Phase | Pyrochlore | Pyrochlore | Pyrochlore | Fluorite | Fluorite | Fluorite | |
| unit cell | Cubic | Cubic | Cubic | Cubic | Cubic | Cubic | |
| Space group | Fd3m | Fd3m | Fd3m | Fm3m | Fm3m | Fm3m | |
| Total number of independent reflections | 36 | 36 | 36 | 36 | 36 | 36 | |
| Lattice constant, Å | 10.80698 | 10.68908 | 10.62310 | 5.29740 | 5.25950 | 5.24329 | |
| Fwhm parameters | U | 0.00538 | 0.13101 | 0.16337 | 0.08600 | 0.04132 | 0.05322 |
| V | −0.00277 | −0.09092 | −0.10004 | −0.04589 | −0.01814 | −0.01815 | |
| W | 0.00071 | 0.01924 | 0.01623 | 0.01260 | 0.00619 | 0.00690 | |
| Zero | 0.0668 | 0.0694 | 0.0794 | 0.0612 | 0.0618 | 0.0409 | |
| Oxygen x-parameters | 0.31726 | 0.32217 | 0.33557 | ||||
| R-factors | R p | 11.0 | 9.75 | 8.82 | 5.47 | 5.63 | 8.19 |
| R wp | 15.2 | 13.0 | 11.9 | 7.02 | 7.19 | 11.1 | |
| R exp | 10.2 | 10.1 | 9.04 | 7.31 | 6.83 | 5.24 | |
| χ 2 | 2.23 | 1.602 | 1.73 | 0.922 | 1.11 | 2.16 | |
| GOF | 1.5 | 1.3 | 1.3 | 0.90 | 1.11 | 2.16 |
3.2. Raman spectral analysis
The distribution of the degrees of freedom around the cation equipoint is zero, which shows that the Raman spectrum of the pyrochlore type compounds is produced by the vibration of the anion sublattice. The A and B sites occupy equipoints with a centre of symmetry, so that the displacement co-ordinate is zero during vibration.24 Therefore Raman spectroscopy is more sensitive to O2−–Mn+ vibration and therefore can be used as an excellent tool to determine the order–disorder arising due to anions in these materials.25 Table S1 (ESI†) shows that there are six Raman active modes in the pyrochlore given by| Γ = A1g + Eg + 3T2g(1) + 1T2g(2) |
The factor group analysis itself shows that the Raman spectrum can be used as an assured tool to study the phase transition from the ordered pyrochlore to a more disordered fluorite. The Raman spectra of the current system RE2Y2/3Zr2/3Nb2/3O7 are shown in Fig. 4a and b. The peak positions and the corresponding modes of vibration values are shown in Table 2. The Eg mode of vibration at ≈330 cm−1 corresponds to the O–RE–O bending modes.26 The peaks at ≈350 cm−1, corresponding to the combination band of Eg and T2g, shift towards a higher wave number and the shift corresponds to the decrease of the lattice parameter of the compositions. The wave number shifts from 333 to 380 cm−1 corresponding to the decrease in the lattice parameter from 10.81 to 10.62 Å. A larger lattice parameter corresponds to softening of the forces in the crystal lattice, which in turn shifts the phonon band to a lower energy. Thus, the shift in Raman peaks and the lattice parameter are in good agreement27 for both the pyrochlore and fluorite structured compositions. The A1g vibration modes due to the O–B–O bending and A–O stretch occur at ≈500 cm−1. The A1g mode of vibration for the composition with RE = Nd is not clearly visible since the sample is coloured. For a perfect pyrochlore the four T2g modes occur at 400, 507, 585 and 765 cm−1.28 The T2g band corresponding to 765 cm−1 is shown in the spectrum with considerable intensity. Other T2g modes are too weak to be visible.
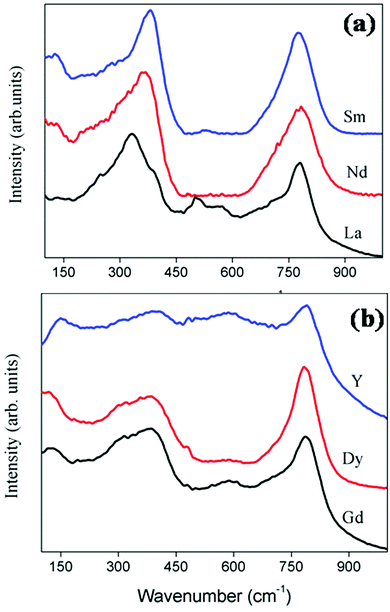 | ||
| Fig. 4 The Raman spectra of the series of compositions RE2Y2/3Zr2/3Nb2/3O14. For better clarity of the peaks the Raman spectra of the pyrochlore (a) and fluorite (b) are shown separately. | ||
| Compositions | Modes of vibration and peak position (cm−1) | ||
|---|---|---|---|
| Eg | A1g | T2g | |
| La | 333 | 503 | 782 |
| Nd | 363 | 508 | 781 |
| Sm | 380 | 527 | 779 |
| T2g | Due to seven coordinated cations | |
|---|---|---|
| Gd | 384 | 785 |
| Dy | 387 | 782 |
| Y | 399 | 788 |
The factor group analysis of the fluorite structure predicts only one Raman active vibration mode,29 which involves vibration of oxygen atoms, which are tetrahedrally caged by the cations.30
| Γ = T2g |
The Raman spectrum of fluorite structured oxides is shown in Fig. 4b. It shows a very broad peak around ≈400 cm−1 and an extra band at 780 cm−1. The broad peak at 400 cm−1 corresponds to the T2g mode. According to the literature30 the absence of the A1g mode around 500 cm−1 and the broadening of the peak between 300 and 400 cm−1 confirms the absence of additional ordering of the pyrochlore structure. The extra band around 780 cm−1 corresponds to the seven coordinated cations.31 Therefore the Raman spectrum can be used as the sublime rule for analysing the order disorder transitions.
3.3. Electron microscopic studies
Transmission electron microscopy has emerged as a convincing tool to study the structure of materials in the nano- and micro-scale because of its capability to reveal the morphological information, crystallographic details, and chemical composition of phases distributed on a very fine scale in a given microstructure.32Fig. 5 shows the high resolution image of the two representative samples La2Y2/3Zr2/3Nb2/3O7 and Dy2Y2/3Zr2/3Nb2/3O7. The La2Y2/3Zr2/3Nb2/3O7 sample shows a lattice spacing corresponding to the (111) plane as in the case of pyrochlore structure compositions and the second one shows the plane having the same miller indices but corresponding to the fluorite structure. The selected area electron diffraction patterns of the same compositions are also shown in the figure. The SAED patterns are indexed using the ratio method. The transmission electron microscopy studies also confirm the phase transition from the ordered pyrochlore to the disordered fluorite structure.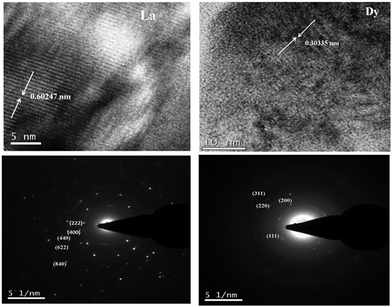 | ||
| Fig. 5 High resolution lattice image and SAED patterns of the compositions La2Y2/3Zr2/3Nb2/3O7 and Dy2Y2/3Zr2/3Nb2/3O7. d-spacing is measured and the SAED patterns are indexed using the ratio method. | ||
3.4. Fractional ionicity calculation based on theoretical methods
Most of the physical properties of the materials can be sensitively described on the basis of the chemical nature of the bond between the atoms. Pauling33 and Philips34 have made a lot of contributions to the theoretical concepts of the nature of chemical bonding. In the case of the complex crystal structure, each individual bond is characterised by an average energy gap (Eg) composed of the bonding (Eμh) and anti bonding (Cμ) of the hybridised molecular orbitals resulting in both the ionic and covalent character for each bond. Calculation of the fractional ionic and covalent behaviour can provide a lot of qualitative and quantitative information based on the coordination number, nearest neighbour distances, and the effective number of valence electrons on the cation and the anion.35The calculations of ionicity for the compositions RE2Y2/3Zr2/3Nb2/3O7 are done as follows. The chemical bonding in the multi-component material can be decomposed in the binary crystal as follows, for RE2Y2/3Zr2/3Nb2/3O7:
| RE2Y2/3Zr2/3Nb2/3O7 = RE1/2–O1(2) + RE3/2–O3(1) + Y2/3–O1(1) + Zr2/3–O1(1) + Nb2/3–O1(1) |
According to the generalized P–V–V theory,34 the bond ionicity fμi and bond covalency fμc of an individual bond μ can be defined as follows:
| (Eμg)2 = (Eμh)2 + (Cμ)2 |
The calculated results for the RE2Y2/3Zr2/3Nb2/3O7 system are shown in Table 3. The values show that ionicity of the A–O bond is always higher than that of the B–O bond which implies that the B–O bond has larger covalency caused by the overlap of orbitals resulting in the shorter bond length than that of the A–O bond.17 Furthermore, the ionicity of the A–O bond decreases with decreasing ionic radii except for the Nd composition. In the case of the Nd compound the ionicity of the A–O bond shows an anomalous trend showing a much lower value compared to the other pyrochlore structured compositions. That is, the A–O bond is more covalent in Nd2Y2/3Zr2/3Nb2/3O7. This may be due to the very high polarizability value of Nd3+ (14.519635) compared to other lanthanides in the series. Polarizability is the ease of deforming the valence electron cloud of a chemical species.36 The high polarizability value of Nd3+ provides a more covalent character to the Nd–O bond. At the same time the B–O bond shows a gradual increase in ionicity, which decreases the covalency and this decreases the bond strength. The difference in ionicity also exhibits the same trend as that in the ionicity of the A–O bond. For the defect fluorite structured compositions the ionicity of both the A–O and B–O bonds decreases gradually and therefore strengthens the bond. This can be explained as the effect of a shorter bond length with a decrease in the lattice parameter. The shorter bond length increases the bond strength, which can be attributed to the increased covalency. In addition, it is observed that the ionicity of the B–O bond has a bigger role in the phase transition, which reaches the maximum at the phase boundary, then decreases.
| Compositions | Ionicity of A–O bond | Ionicity of B–O bond | Ionicity difference |
|---|---|---|---|
| La | 0.9028 | 0.8237 | 0.0791 |
| Nd | 0.8779 | 0.8282 | 0.0497 |
| Sm | 0.9584 | 0.8303 | 0.1281 |
| Gd | 0.9385 | 0.8472 | 0.0913 |
| Dy | 0.9188 | 0.8469 | 0.0719 |
| Y | 0.8917 | 0.8467 | 0.0450 |
3.5. High temperature XRD studies
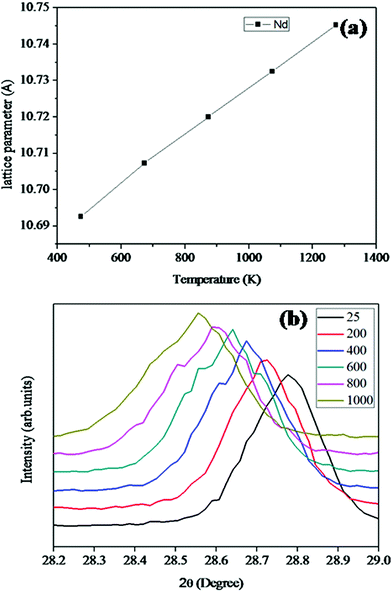
For the high temperature application of the pyrochlore oxides, the structure stability and variation of the crystallographic properties are to be studied. At the microscopic level, it can be done by using high temperature XRD. The lattice thermal expansion coefficient represented by the equationis a good nominee to represent the structural stability and the influence of bond strength on the oxide ion conductivity.4 The XRD patterns of each sample were measured in the temperature range of 298 K to 1273 K with an interval of 200 K. The obtained XRD patterns were analysed by the Le-Bail fitting method using the software X'pert High Score Plus. A plot of lattice parameter vs. absolute temperature was made for each sample and the slope of the sample
 divided by the lattice parameter at room temperature provided the value of the lattice thermal expansion coefficient. The variation in lattice parameter with temperature for Nd2Y2/3Zr2/3Nb2/3O7 is shown in Fig. 6a. And the shift in the d-spacing of the same is also shown in Fig. 6b.
The lattice thermal expansion coefficient of each sample is shown in Fig. 7. In the case of the pyrochlore structured compound the lattice thermal expansion coefficient shows an anomalous behaviour. The lattice thermal expansion coefficient of Sm2Y2/3Zr2/3Nb2/3O7 shows an abnormal increase. The thermal expansion coefficient for the fluorite structured compositions shows a steady increase.
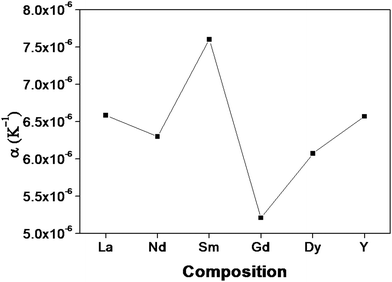 | ||
| Fig. 7 The variation of the lattice thermal expansion with different lanthanides in the composition: RE2Y2/3Zr2/3Nb2/3O7 (RE = La, Nd, Sm, Gd, Dy, Y). | ||
The studies on the relationship between the thermal expansion coefficient and ionic conduction in perovskite type oxides by Taniguchi et al. show that a small difference between the ionicities of the A–O and B–O bonds results in a larger value of the thermal expansion coefficient due to the instability in the position of the oxygen.17 But in the case of the pyrochlore oxides, the structure itself contains two crystallographically different oxide ions. The A cation is eight coordinated with six 48f oxygen ions and two 8a ions with different bond lengths; the B cation is six coordinated with 48f oxide ions only. The plot of ionicity of the A–O bond (fμi![[thin space (1/6-em)]](https://www.rsc.org/images/entities/char_2009.gif) A–O), the B–O bond (fμi
A–O), the B–O bond (fμi![[thin space (1/6-em)]](https://www.rsc.org/images/entities/char_2009.gif) B–O) and |fμi
B–O) and |fμi![[thin space (1/6-em)]](https://www.rsc.org/images/entities/char_2009.gif) A–O − fμi
A–O − fμi![[thin space (1/6-em)]](https://www.rsc.org/images/entities/char_2009.gif) B–O| with the thermal expansion coefficient is shown in Fig. 8. Here, for the case of the pyrochlore compounds, the A–O and B–O bonds have to be treated separately rather than the difference, unlike in the case of perovskites.17 The ionicity of the A–O and B–O bonds for the compositions with RE = Nd shows a better covalent character due to high polarizability (from the calculated values also). Higher covalency, in other words lower ionicity, results in strong bonds. The stronger bond results imply increasing rigidity of the system which in turn instigates smaller thermal expansion.4 In the case of the composition with RE = Sm, both the A–O and B–O bonds have a higher percentage of ionic character compared to other compositions. Therefore, the bonds are weaker and hence show a high value of the thermal expansion coefficient. From the studies, it is shown that at least in the case of the pyrochlore compounds the chemical characteristics of each bond show their own contribution. The studies of Wuensch et al. show that the A3+–O bond expands more rapidly than the B4+–O bonds.15 Hence higher contribution to the thermal expansion arises from the A–O bond. From this study it is also clear that the lattice thermal expansion coefficient is in line with the ionicity of the A–O bond.
B–O| with the thermal expansion coefficient is shown in Fig. 8. Here, for the case of the pyrochlore compounds, the A–O and B–O bonds have to be treated separately rather than the difference, unlike in the case of perovskites.17 The ionicity of the A–O and B–O bonds for the compositions with RE = Nd shows a better covalent character due to high polarizability (from the calculated values also). Higher covalency, in other words lower ionicity, results in strong bonds. The stronger bond results imply increasing rigidity of the system which in turn instigates smaller thermal expansion.4 In the case of the composition with RE = Sm, both the A–O and B–O bonds have a higher percentage of ionic character compared to other compositions. Therefore, the bonds are weaker and hence show a high value of the thermal expansion coefficient. From the studies, it is shown that at least in the case of the pyrochlore compounds the chemical characteristics of each bond show their own contribution. The studies of Wuensch et al. show that the A3+–O bond expands more rapidly than the B4+–O bonds.15 Hence higher contribution to the thermal expansion arises from the A–O bond. From this study it is also clear that the lattice thermal expansion coefficient is in line with the ionicity of the A–O bond.
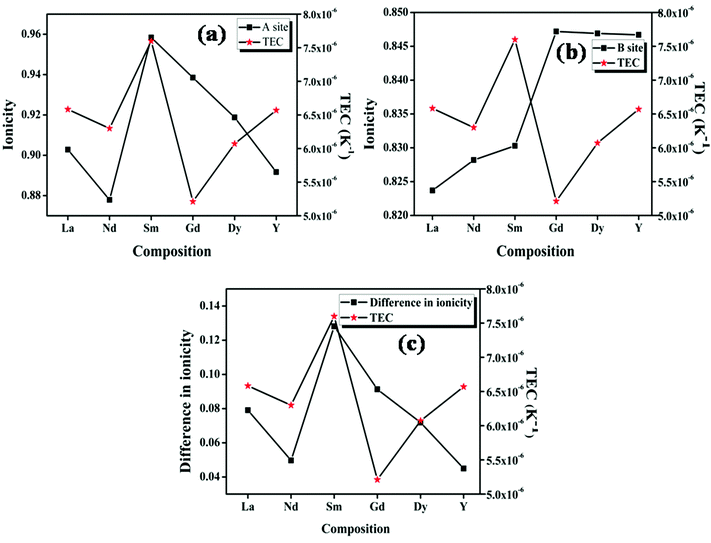 | ||
| Fig. 8 The variation of the lattice thermal expansion coefficient with ionicity of the (a) A–O bond and (b) B–O bond; (c) the difference in ionicity between the A–O and B–O bonds. | ||
In the case of fluorite oxide, the 48f and 8b oxide ions randomize to form the 4c oxygen positions. Here, just like the perovskite type oxides, the A and B cations are coordinated by only one type of oxide ion. Hence in this case the individual bonds do not play any important role in determining the thermal expansion coefficient. Here the thermal expansion coefficient increases with the decrease in the difference in the ionicity of the A–O and B–O bonds. Similar to the radius ratio, as the difference decreases, the disorder in the fluorite structure increases and hence results in a higher lattice thermal expansion coefficient. Hence, in the case of the fluorite related structure, the cumulative effects of the bonds help in determining the thermal expansion coefficient rather than the effects of individual bonds.
3.6. Impedance analysis
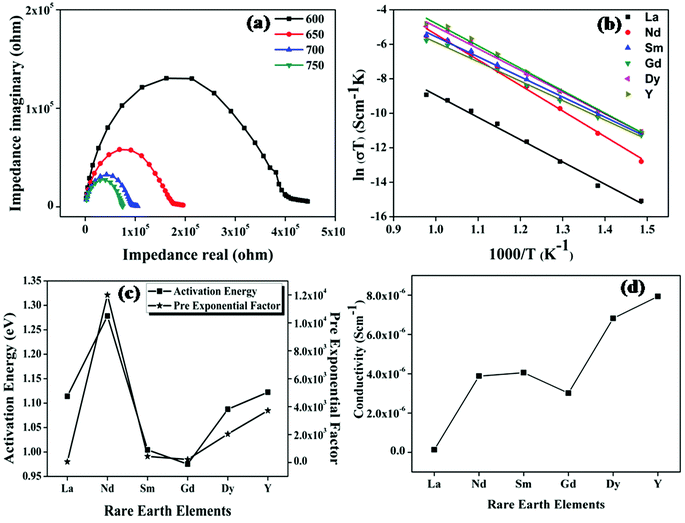
The ionic conductivity of the samples was measured using the two-probe ac-conductivity measurement method. Impedance spectroscopy is the study of sample resistivity over a wide range of frequencies. Each individual spectrum provides information about resistive, inductive or capacitive elements, which together constitute the electrical behaviour of the sample. The impedance spectrum taken over a wide range of frequencies is capable of resolving total impedance into three components, namely, impedance for the bulk (high frequency spectrum), grain boundary (middle of the spectrum) and the electrode process (low frequency arc). The conductivity measurements were done on a wide range of temperatures from room temperature to 1073 K at intervals of 50 K. The cole–cole plot of the representative sample Nd2Y2/3Zr2/3Nb2/3O7, the Arrhenius plot, activation energy and pre-exponential constant and the overall conductivity of all the compositions are shown in Fig. 9.Fig. 9a shows the cole–cole (Nyquist) plot of the sample Nd2Y2/3Zr2/3Nb2/3O7 at 873, 923, 973, and 1023 K. It is observed in the figure that the radius of the semicircle of the cole–cole plot decreases as the temperature increases, which implies that the conductivity of the samples increases as the temperature increases. Therefore, it is understood that the conduction mechanism is thermally activated. The Nyquist plot ends with a small spike in the low frequency region. This spike is either due to the diffusion of ions through the electrode or the electrode polarisation. The capacitance value corresponding to this spike is the same as that expected for the blocking of ionic charge carriers at the electrode sample interface.37 Hence this spike provides confirmation for the oxide ion conduction in the samples.
The temperature dependence of conductivity is shown in Fig. 9b and is found to follow the Arrhenius behaviour given by the following equation:
σ(T) = σ0![[thin space (1/6-em)]](https://www.rsc.org/images/entities/char_2009.gif) exp(−Ea|kBT) exp(−Ea|kBT) |
The trend in conductivity with the compositions can be viewed as a competeting effect of the trends of activation energy and the pre-exponential factor. The activation energy in the case of Nd2Y2/3Zr2/3Nb2/3O7 increases drastically compared with the other pyrochlore structured compositions. This is of the highly polarizable Nd ion due to which the covalency of the A-site composition increases and the bonds in the structure become rigid. This leads to a high activation energy requirement for the breaking of the metal–oxygen bond. The rigidity of the bonds in Nd2Y2/3Zr2/3Nb2/3O7 was proven by the thermal expansion coefficient, which is low compared to that of the other pyrochlore structured compositions. Hence the activation energy of the sample with Nd is very high. But the conductivity trend is in the opposite direction since the conductivity increases disregarding the influence of the activation energy. The explanation for this phenomenon can be provided using the concept of ionicity for this composition; the difference in the ionicity of the A–O and B–O bonds is very low. When the difference in ionicity is small the bonding nature in A–O and B–O becomes closer and the oxygen might bind to the A-site or the B-site ion and hence the position of the oxygen ion becomes unstable.38 This introduces more anion disordering in the lattice which in turn enhances the concentration of charge carriers, which is also shown in Fig. 9c where the pre-exponential, which is a measure of the concentration of charge carriers, increases rapidly for the sample with RE = Nd. Then the conductivity of the sample Sm2Y2/3Zr2/3Nb2/3O7 remains the same since the larger value of ionicity difference reduces the concentration of charge carriers even though the activation energy is very much reduced. In the case of compositions with the fluorite structure, the conductivity follows the same trend as the difference in ionicity. Hence the ionicity calculation in pyrochlore type oxides plays an important role in determining the ionic conductivity. It can also be concluded that a small difference in ionicity also introduces cation disorder in the lattice, which in turn increases the activation energy and the oxygen position becomes unstable and hence anion disorder occurs. Cation disorder increases the activation energy and anion disorder increases the concentration charge carriers in pyrochlore.39 The conductivity therefore increases as a result of these competing effects in these compositions.
4. Conclusions
A series of new compositions, RE2Y2/3Zr2/3Nb2/3O7, were successfully prepared via a solid state reaction route. The structural analysis using powder X-ray diffraction patterns, Raman analysis, and transmission electron microscopy studies showed a phase transition from an ordered pyrochlore to a defect fluorite type structure with a phase boundary upon Gd substitution. Analysis of the thermal expansion coefficient, ionicity and oxide ionic conductivity of the system indicates an interrelationship among these parameters with structural dependence. The decrease in the difference in ionicity in metal oxygen bonds increases the ionic conductivity in both phases. However, the influence of the ionicity difference of the M–O bond on thermal expansion is dependent on the phase as well as the ionicity of the A–O bond. The best conductivity obtained in the series is 7.9 × 10⁻⁶ S cm−1 for Y2(Y1/3Zr1/3Nb1/3)2O7 at 1023 K. The minimum thermal expansion coefficient is obtained at the phase boundary for Gd2Y2/3Zr2/3Nb2/3O7 and the value is 5.2 × 10⁻⁶ K−1. The present study demonstrates that the ionicity difference of metal oxygen bonds plays a key role in determining the thermal expansion coefficient and ionic conductivity, which may be helpful when designing oxide ionic conductors.Acknowledgements
The authors would like to acknowledge the International Centre for Diffraction Data, USA and one of the authors, UAR, would like to acknowledge the Kerala State Council for Science Technology and Environment (KSCSTE) for the research fellowship.References
- M. A. Subramanian, G. Aravamudan and G. V. Subba Rao, Prog. Solid State Chem., 1983, 15, 55–143 CrossRef CAS.
- L. Minervini, R. W. Grimes and K. E. Sickafus, J. Am. Ceram. Soc., 2000, 83, 1873–1878 CrossRef CAS.
- B. J. Wuensch and K. W. Eberman, Alloy Sci., 2000, 19–21 CAS.
- A. N. Radhakrishnan, P. P. Rao, S. K. Mahesh, D. S. Vaisakhan Thamp and P. Koshy, Inorg. Chem., 2012, 51, 2409–2419 CrossRef CAS PubMed.
- R. Ubic, I. Abrahams and Y. Hu, J. Am. Ceram. Soc., 2008, 91, 235–239 CrossRef CAS.
- F. N. Sayed, D. Jain, B. P. Mandal, C. G. S. Pillai and A. K. Tyagi, RSC Adv., 2012, 2, 8341–8351 RSC.
- A. N. Radhakrishnan, P. P. Rao, K. S. M. Linsa, M. Deepa and P. Koshy, Dalton Trans., 2011, 40, 3839–3848 RSC.
- J. Feng, B. Xiao, R. Zhou and W. Pan, J. Appl. Phys., 2012, 111, 103535-1 Search PubMed.
- D. Michel, M. P. Y. Jorba and R. Collongues, Mater. Res. Bull., 1974, 9, 1457–1468 CrossRef CAS.
- A. V. Shlyakhtina, I. V. Kolbanev, A. V. Knotko, M. V. Boguslavskii, S. Y. Stefanovich, O. K. Karyagina and L. G. Shcherbakova, Inorg. Mater., 2005, 41, 975–984 Search PubMed.
- S. Solomon, A. George, J. K. Thomas and A. John, J. Electron. Mater., 2015, 44, 28–37 CrossRef CAS.
- P. K. Schelling, S. R. Phillpot and R. W. Grimes, Philos. Mag. Lett., 2004, 84, 127–137 CrossRef CAS.
- G. K. Kutty, S. Rajagopalan and C. K. Mathews, Mater. Chem. Phys., 1994, 29, 759–766 CAS.
- M. Bolech, E. H. Cordfunke, A. C. van Genderen, R. van der Laan, F. J. J. Janssen and J. van Miltenburg, J. Phys. Chem. Solids, 1997, 58, 433–439 CrossRef CAS.
- B. J. Wuensch, K. W. Eberman, C. Heremans, E. M. Ku, P. Onnerud, E. M. E. Yeo, S. M. Haile, J. K. Stalick and J. D. Jorgensen, Solid State Ionics, 2000, 129, 111–133 CrossRef CAS.
- S. T. Norberg, I. Ahmed, S. Hull, D. Marrocchelli and P. A. Madden, J. Phys.: Condens. Matter, 2009, 21, 215401 CrossRef PubMed.
- S. Taniguchi and M. Aniya, J. Phys. Soc. Jpn., 2010, 53, 106–108 CrossRef.
- E. Aleshin and R. Roy, J. Am. Ceram. Soc., 1962, 45, 18–25 CrossRef CAS.
- C. Heremans, B. J. Wuensch, J. K. Stalick and E. Prince, J. Solid State Chem., 1995, 117, 108–121 CrossRef CAS.
- F. J. Dickson, K. D. Hawkins and T. J. White, J. Solid State Chem., 1989, 82, 146–150 CrossRef CAS.
- K. R. Whittle, L. M. D. Cranswick, S. A. T. Redfern, I. P. Swainson and G. R. Lumpkin, J. Solid State Chem., 2009, 182, 442–450 CrossRef CAS.
- R. D. Shannon, Acta Crystallogr., Sect. A: Cryst. Phys., Diffr., Theor. Gen. Crystallogr., 1976, A32, 751–767 CrossRef CAS.
- H. Yamamura, H. Nishino, K. Kakinuma and K. Nomura, Solid State Ionics, 2003, 158, 359–365 CrossRef CAS.
- B. E. Scheetz and W. B. White, J. Am. Ceram. Soc., 1979, 62, 468–470 CrossRef CAS.
- F. N. Sayed, B. P. Mandal, D. Jain, C. G. N. S. Pillai and A. K. Tyagi, J. Eur. Ceram. Soc., 2012, 32, 3221–3228 CrossRef CAS.
- B. D. Begg, N. J. Hess, D. E. McCready, S. Thevuthasan and W. J. Weber, J. Nucl. Mater., 2001, 289, 188–193 CrossRef CAS.
- R. A. Walker, An Investigation of Solid Oxide, University of Maryland, 2007 Search PubMed.
- B. P. Mandal, P. S. R. Krishna and A. K. Tyagi, J. Solid State Chem., 2010, 183, 41–45 CrossRef CAS.
- V. G. Keramidas and W. B. White, J. Chem. Phys., 1973, 59, 1561–1562 CrossRef.
- L. Zhou, Z. Huang, J. Qi, Z. Feng, D. Wu, W. Zhang, X. Yu, Y. Guan, X. Chen, L. Xie, K. Sun and T. Lu, Metall. Mater. Trans. A, 2016, 47, 623–630 CrossRef CAS.
- A. N. Radhakrishnan, P. Prabhakar Rao, K. S. Sibi, M. Deepa and P. Koshy, J. Solid State Chem., 2009, 182, 2312–2318 CrossRef CAS.
- S. Neogy, R. T. Savalia, R. Tewari, D. Srivastava and G. K. Dey, Indian J. Pure Appl. Phys., 2006, 2, 119–124 Search PubMed.
- L. Pauling, The Nature of the Chemical Bond, An Introduction to Modern Structural Chemistry, Cornell University Press, 1960 Search PubMed.
- J. C. Philips, Rev. Mod. Phys., 1970, 42, 317–356 CrossRef.
- V. K. Srivastava and V. E. Fermi, Phys. Lett., 1984, 102, 127–129 CrossRef.
- D. C. Ghosh and R. Biswas, Int. J. Mol. Sci., 2003, 4, 379–401 CrossRef CAS.
- E. J. Abram, D. C. Sinclair and A. R. West, J. Electroceram., 2001, 7, 179–188 CrossRef CAS.
- S. Taniguchi and M. Aniya, Adv. Sci. Technol., 2010, 72, 343–347 CrossRef CAS.
- M. Z. A. Munshi, Handbook of Solid State Batteries & Capacitors, World Scientific, 1995 Search PubMed.
Footnote |
| † Electronic supplementary information (ESI) available. See DOI: 10.1039/c6nj02482c |
| This journal is © The Royal Society of Chemistry and the Centre National de la Recherche Scientifique 2017 |


