 Open Access Article
Exploratory catalyst screening studies on the liquefaction of model humins from C6 sugars†
Y. Wang ,
S. Agarwal,
Z. Tang and
H. J. Heeres
 *
*
Chemical Engineering Department, ENTEG, University of Groningen, Nijenborg 4, 9747 AG Groningen, The Netherlands. E-mail: h.j.heeres@rug.nl
First published on 17th January 2017
Abstract
A catalyst screening study is reported on the liquefaction of humins, the solid byproducts from C6 sugar biorefineries for levulinic acid and 5-hydroxymethylfurfural production. Experiments were carried out in a batch reactor using an artificial model of humin derived from glucose with isopropanol (IPA) as the solvent at 400 °C for a 3 h batchtime. Initial studies using noble metal catalysts (Rh, Pt, Pd, Ru) on a carbon support revealed that Pt was the best catalyst in terms of humin conversion (77%) and amounts of alkylphenolics and aromatics in the product oil (GCxGC-FID). Subsequent support screening studies (TiO2, ZrO2, CeO2) were performed using Pt as the active metal and the results were compared with Pt/C. Detailed liquid product analysis (GPC, GC-MS, GCxGC) including blank reactions in the absence of humins revealed that the humins are mainly converted to monomeric alkylphenolics and aromatics oligomers (GPC) and (GC). IPA was shown not to be inert and is converted to acetone and hydrogen, and the latter is the hydrogen source for the various metal catalysed hydrogenolysis and hydro(deoxy)genation reactions. In addition, acetone is converted to aldolcondensation products (like methylisobutylketone, MIBK) and hydrogenation products derived thereof. The best results were obtained with Pt/C when considering humin conversion. However, Pt/CeO2 was shown to be more attractive when considering the amounts of alkylphenolics in the product oils (20.4 wt% based on humin intake).
1. Introduction
Ligno-cellulosic biomass is regarded as an important alternative for fossil resources for the production of biobased products.1–15 For instance, it has been shown that the cellulose and hemicellulose fraction may be transformed into platform chemicals using either biochemical or metal/Brönsted acid catalysed transformations.1–5,16–18 Well known examples of platform chemicals are levulinic acid (LA) and 5-hydroxymethylfurfural (HMF) and both have been shown to be attractive intermediates for a large range of interesting products with high application potential.19–24 Example are 2,5-furanedicarboxylic acid, a monomer for renewable polymers, and acetals from levulinic acid.12 However, the conventional synthetic methodology to produce LA and HMF in water using a mineral acid as the catalyst inevitably leads to the formation of solid byproducts known as humins. These not only cause blocking of pipes and other process equipment but also lower the carbon efficiency of the conversions considerably.1,25,26 In some cases, humin yields as high as 40% based on feed intake have been reported.27,28To reduce humin formation and/or to obtain value-added chemicals from humin, a good understanding of the molecular structure of humin is of high importance. Unfortunately detailed information was limited till several years ago because of its complex, highly condensed structure and its low solubility in conventional organic solvents, which hamper analysis by techniques such as NMR. However, the rapid developments in the field of hydrothermal carbonisation during the last decade has led to further insights. The molecular structure of the main product of this process, hydrothermal carbons (HTC), have been investigated in detail.29–32 HTC are typically obtained by heating various lignocellulosic biomass sources in water at elevated temperatures and pressures. In this respect, the structure may differ from typical humins obtained by a conventional LA and HMF synthesis as strong Bronsted acids are used here, which may have a major impact on the composition and molecular structure of the humins formed.
A limited number of characterisation studies have been reported for humins from monomeric sugars using acids as the catalysts. Zarubin et al. proposed a furan-rich structure with ether and (hemi) acetal linkages (elemental analyses, IR, NMR of acetone extracts).33 Lund et al. reported that humins from HMF are formed by aldol condensation reactions of the intermediate 2,5-dioxo-6-hydroxyhexanal (including reactions with HMF) giving a furan rich structure, with the exact amounts of furanic fragments depending on the level of HMF involved in the aldol condensation reactions.34
We have recently reported on the structure of so called artificial humins, which are humins made by the conversion of C6-sugars, particularly glucose, at elevated temperatures in water in the presence of a mineral acid at extended reaction times (6 h, 180 °C, 1 M sugar and 0.01 M H2SO4). The glucose humins were obtained in yields up to 39 wt% on C6 sugar intake.27 Based on extensive characterisation studies (elemental analysis, IR, solid state NMR and pyrolysis GC-MS) a structural model was proposed, which suggest that the humins consist of furanic fragments connected by various linkages (Fig. 1 left). A later study came up with a refined model, see Fig. 1 right.27,35
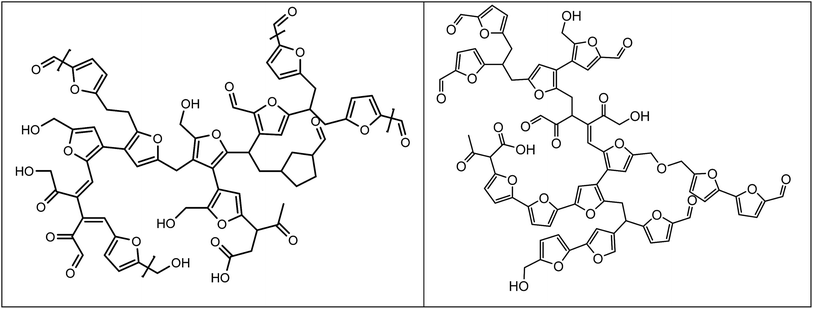 | ||
| Fig. 1 Proposed structures for humins from D-glucose (reproduced with permission).27,35 | ||
A number of investigations have been reported to convert the solid humins to higher added value products. For instance, Hoang et al. studied the valorisation of humins by steam reforming with alkali-metal-based catalysts (900–1200 °C).36,37 Highest activity was found when using Na2CO3 as the catalyst. The H2 to CO ratio of the produced syngas was about 2. However, substantial loss of carbon was observed during the heating up stage (up to 45 wt% on intake).
Liquefaction of humins has also been proposed as an attractive technology to obtain liquid energy carriers preferably enriched in interesting biobased building blocks like aromatics and alkylphenolics. Such liquefied humins have a higher energy density per volume, and are more easy to store and transport than the solid humins. Liquefaction using pyrolysis technology was investigated by Rasrendra et al.38 Pyrolysis GC-MS showed the presence of furanics and organic acids in the vapour phase, though the individual components were present in only minor amounts (<1 wt%). Micro-pyrolysis yielded 30 wt% gaseous and liquid products, the remainder being a solid char. Gas–liquid yields were lower than obtained for a typical lignin sample (Kraft lignin) under similar conditions. As such, pyrolysis seems to be cumbersome leading to relatively low liquid yields.
Recently, Trautmann et al. have reported studies on the conversion of HTC materials to biofuels using catalytic technology.39,40 Various HTC materials were tested using Ni on titania as the catalyst at temperatures between 200 and 250 °C, and reaction times between 3 and 20 h. Hydrogen is formed in situ which then serves as the reactant for hydrocracking reactions and the formation of liquid products. Although HTC materials derived from lignocellulosic biomass are likely more complex in nature than the artificial humins from C6-sugars, it implies that this methodology may also be very attractive for the liquefaction/upgrading of artificial humins.
The catalytic liquefaction of humin substances extracted from biodegraded lignocellulosic biomass has also been reported.41 The reaction was carried out using RANEY® Ni as the catalyst, at 380 °C using tetralin as the hydrogen donor. Although the structure of the humin (fractions) used in this study differs considerably from those used in our study (hydrothermal synthesis of glucose), its shows that catalytic hydrotreatments without external molecular hydrogen are possible.
We have recently reported that artificial humins derived from glucose can be depolymerised using a hydrotreatment with Ru/C in an isopropanol/formic acid mixture. The reaction was carried out at 400 °C and humin conversions up to 69% were achieved.42 The liquid products were shown to consist of both mono- and oligomeric compounds, and the major GC detectables compounds were alkylphenolics, aromatics (mono and with multiple fused rings) and cyclic alkanes, though their yields based on humin intake is relatively low (<10%). It was shown that molecular hydrogen is formed in situ by the catalytic conversion of formic acid and that this in situ produced hydrogen is used for hydrogenolysis and hydro(deoxygenation) reactions involving the humin structure. In addition IPA was also shown to be reactive under these conditions and was (partly) converted to acetone and hydrogen. The later finding indicates that formic acid is possibly not required for the liquefaction reaction and this would considerably simplify the process.
Herein, we report a systematic catalyst screening study on the liquefaction of humins in IPA only, without the use of formic acid and the addition of molecular hydrogen. A series of noble metals including Pd, Ru, Rh, Pt were selected and tested for the reaction with active carbon as the support. The metals were selected on the basis of their known activity for the dehydrogenation of IPA to hydrogen and acetone. On the basis of this study, the best noble metal was selected, followed by a support screening study (carbon, TiO2, ZrO2 and CeO2). The liquid product phases of the reactions were investigated in detail with various techniques (GPC, GCxGC, GC-MS-FID) to determine the molecular composition. This information was used to select the best catalyst with regards to humin conversion and amounts of low molecular weight products in the product oils.
2. Materials and methods
2.1 Chemicals
All chemicals used in this work were of analytical purity and used without further purification. The metal acetylacetonate precursor, Pt(acetylacetonate)2 was obtained from Sigma Aldrich with a purity of at least 99.5 wt%. The supports (anatase TiO2, Sigma No. 637254-50G, ZrO2, Sigma No. 230693-100G, and CeO2, Sigma No. 544841-25G) were obtained from Sigma Aldrich and all have an average particle size diameter of less than 50 nm. Supported metal catalysts on carbon (Ru, Sigma No. 206180-25G, Rh, Sigma No. 643149-10G, Pt, Sigma No. 205931-50G, Pd, Sigma No. 205680-50G, all in powder form) with a metal loading of 5 wt% were obtained from Sigma Aldrich and used as such. 2-Propanol (99.5%, Chromasolv plus) was purchased from Fluka, D-glucose (99% purity), di-n-butylether (DBE), tetrahydrofuran (THF) and sulfuric acid were obtained from Sigma Aldrich. Nitrogen gas (>99.8%) was obtained from Hoekloos.2.2 Humin synthesis
The humins used in this study were synthesised by the hydrothermal conversion of D-glucose in water in the presence of sulfuric acid according to a literature procedure.27A stainless steel autoclave (1 L) equipped with an overhead stirrer was filled with a solution of H2SO4 (0.01 M) and glucose (1 M) in water (500 mL). The content was heated to 180 °C (heating rate: 1.3 °C min−1) and subsequently maintained at this temperature for 6 h at a stirring rate of 120 rpm. The initial pressure was 10 bar, which increased slowly during the reaction to 13.5 bar due to the formation of some gasphase components. After reaction, the reactor was cooled to room temperature and the resulting suspension was filtered. The dark brown residue was washed with 3 L of deionised water. The powder was dried under vacuum (0.03 bar) for 24 h at 60 °C. After drying, the humins were grinded and purified by a Soxhlet extraction with water for 24 h. Finally, the purified humins were vacuum (0.03 bar) dried for 24 h at 70 °C and were further crushed into powder. The elemental composition of the humins was 64.64 wt% carbon, 4.38 wt% hydrogen and 30.9 wt% oxygen by difference (H/C: 0.81 and O/C: 0.36 mol mol−1), which agrees well with reported values.27
2.3 Catalyst preparation
All Pt catalysts on the inorganic supports (5 wt% metal) were prepared using a wet impregnation procedure with acetone as the solvent. The supports were dried overnight at 120 °C before use. A representative example for Pt on TiO2 is given as an example. Platinum acetylacetonate (0.1063 g, 0.0527 g Pt) was diluted in acetone (250 mL) and the appropriate amount of TiO2 (1.0235 g) was added. The acetone was slowly removed (about 8 h) while heating the suspension at 40 °C at atmospheric pressure. The resulting solid mixture was collected and calcined in a muffle furnace under air (heating profile: from room temperature to 300 °C with a heating rate of 5 °C min−1 for 2 h followed by heating to 600 °C with a rate of 5 °C min−1 for 1 h followed by cooling to 50 °C in 3 h). Subsequently, the catalyst was reduced (room temperature to 600 °C with a heating rate of 20 °C min−1, 6 h at 600 °C and then cooled to 50 °C in 2 h) using a Micrometrics AutoChem II 2920 system with a sweep gas consisting of 10 vol% hydrogen and 90 vol% nitrogen.2.4 Catalytic liquefaction of the humins
The catalytic hydrotreatment experiments were performed in a batch Parr reactor system (maximum operating conditions: 350 bar and 500 °C) consisting of a batch autoclave (100 mL) with electric heating, equipped with an overhead stirrer and temperature control. The stirring speed was set at 1400 rpm for all experiments. In a typical experiment, the reactor was charged with a humin sample (3.0 g), IPA (20.0 g), and metal on carbon catalyst (0.5 g, 17 wt% on humin intake). The reactor was closed and tested for leakage by pressurising with 80 bar of nitrogen. The pressure was released and the reactor was subsequently flushed twice with nitrogen gas. The reactor was weighted for mass balance calculations and subsequently heated to 400 °C at a rate of about 10 °C min−1 and the reaction was allowed to proceed for 3 h. During heating, the pressure in the reactor increased typically to 120–130 bar when the temperature approached 400 °C. After reaction, the reactor was cooled to room temperature. The pressure was released and the gas phase was collected in a 3 L plastic gas bag and was analysed with gas chromatography. The reactor was weighed and the difference in weight before and after reaction (after release of the gasphase) was taken as the amount of gasphase components formed. The suspension was removed from the reactor, weighed and placed in a centrifuge tube (50 mL). After 45 min of centrifugation at 4500 rpm, a clear liquid phase and a solid phase were obtained. The liquid phase was separated and weighed. The solid residue (unreacted humins and catalyst) was dried at 70 °C, 0.03 bar overnight and weighted for mass balance calculations. An overview of the catalytic liquefaction protocol is shown in Fig. 2.The conversion of humins was calculated as follows:
 | (1) |
The humin oil yield on humin intake (eqn (2)), humin oil on total feed intake (eqn (3)) are mass based and are calculated as follows:
 | (2) |
 | (3) |
2.5 Product analysis
![[thin space (1/6-em)]](https://www.rsc.org/images/entities/char_2009.gif) :
:![[thin space (1/6-em)]](https://www.rsc.org/images/entities/char_2009.gif) 1 ratio to the MSD and FID. The injector temperature was set at 250 °C. The oven temperature was kept at 40 °C for 5 min and then heated up to 250 °C at a rate of 3 °C min−1.
1 ratio to the MSD and FID. The injector temperature was set at 250 °C. The oven temperature was kept at 40 °C for 5 min and then heated up to 250 °C at a rate of 3 °C min−1.From the 2D-GC spectra, the yields of aromatics, phenolics, ketones, alkanes, naphthenes and acid were calculated based on the humin intake. The identification of main GCxGC component groups (e.g. alkanes, aromatics, alkylphenolics) in the lignin oils was done by spiking with representative model compounds for the component groups. Quantification was performed by using an average relative response factor (RRF) per component group with di-n-butyl ether (DBE) as the internal standard. Details of the procedure are given in ref. 43.
2.6 Catalyst characterisation
Transmission electronic microscopy (TEM) images were obtained using a Philips CM12 operated at an acceleration voltage of 120 kV. Samples for TEM measurements were ultrasonically dispersed in ethanol and subsequently deposited on a mica grid coated with carbon.ICP analyses were performed on a Perkin Elmer 4300 DV. Solid samples were calcined at 900 °C and subsequently dissolved in a 2% wt HNO3 solution. Liquid samples were only dissolved in a 2% wt HNO3 solution before analysis.
3. Results and discussion
3.1 Catalyst characterisation for the metal on carbon catalysts
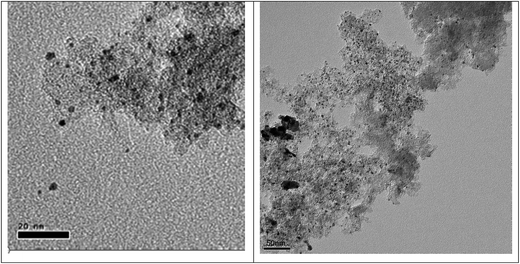
All noble metal (Pt, Pd, Rh, Ru) on carbon catalysts were obtained from a commercial supplier and contained 5 wt% of active metal. The average metal nanoparticle size was determined using TEM and two representative images are given in Fig. 3. The average metal particle size was below 5 nm for all samples 3.4 nm for Pd/C, 2.3 nm for Pt/C, 4.1 nm for Rh/C and 2.2 nm for Ru/C. The Pd and Rh sample showed also some evidence for agglomeration of metal nanoparticles, see Fig. 3 (right) and Fig. S1 (ESI†).3.2 Exploratory catalyst screening studies for noble metals on a carbon support
Exploratory catalyst screening studies on humin liquefaction were carried out in IPA using the carbon supported noble metal catalysts. All reactions were performed at 400 °C for a batch time of 3 h. These conditions were selected on the basis of earlier experiments with Ru/C and formic acid/IPA.42 An overview of the experiments is given in Table 1.| a All reactions were carried out with 13 wt% humins (from D-glucose) on total intake and 17 wt% catalyst on humin intake at 400 °C for 3 h.b Calculated by the difference of weight of the reactor (with liquid and solid material) before and after reaction (after purging the gas phase). | |||||
|---|---|---|---|---|---|
| Experiment | 1 | 2 | 3 | 4 | 5 (blank) |
| Catalyst | Ru/C | Rh/C | Pd/C | Pt/C | Pt/C |
| Humin intake (wt% on feed) | 13 | 13 | 13 | 13 | — |
| Product oil yield, wt% on total feed | 54 | 76 | 73 | 78 | 80 |
| Solids, wt% on total feed | 4.9 | 5.1 | 8.0 | 3.1 | 0 |
| Humin conversion, wt% | 63 | 61 | 39 | 77 | — |
| Gas phase, wt% on total feedb | 36b | 13 | 14 | 15 | 16 |
| Mass balance closure (%) | 95 | 94 | 95 | 96 | 96 |
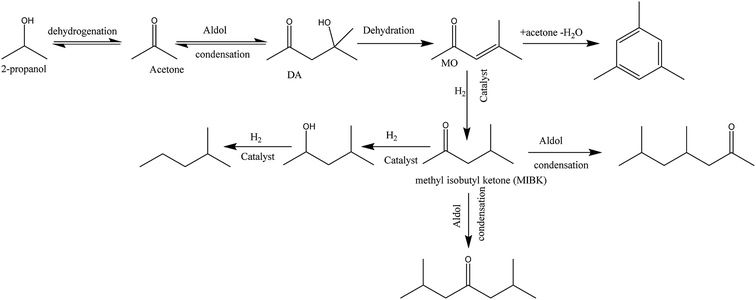
The gas to liquid phase ratio is about constant for Pt, Pd, Rh, whereas Ru/C is a clear exception and considerably more gas phase components are formed. The major gasphase component is hydrogen (qualitatively, not quantified in detail), likely formed by IPA dehydrogenation to acetone and hydrogen (Scheme 1), which is a well precedented equilibrium reaction.44,45
Based on the amount of gasphase components formed during reaction, Ru is more effective for this IPA dehydrogenation reaction than the other metals under the prevailing reaction conditions. These findings are in line with a kinetic study by Ukisu et al. on the dehydrogenation of IPA with carbon supported catalysts (Ru, Pd, Pt, Rh) at 82 °C and atmospheric pressure in a batch set-up where the amount of hydrogen formed was measured using a gas-burette.46 The order of catalyst activity for IPA dehydrogenation was Ru/C > Rh/C = Pt/C > Pd/C, with the TOF for Ru/C about 5 times higher than for the second best catalysts (Rh/C and Pt/C). Though the reaction temperature in this study is by far lower than in our system (82 versus 400 °C), our observation that Ru is more active for IPA dehydrogenation is in line with these literature data and explains the high amounts of gasphase components formed when using Ru/C.
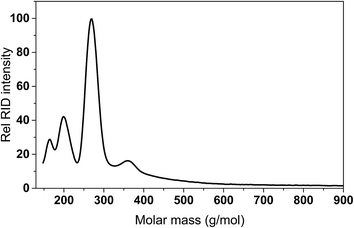
For Rh and Pd, the amounts of GC detectable species at the same GC magnification level was by far lower (Fig. S2 and S3 in the ESI†). This was also confirmed by GCxGC measurements (vide infra). As such, significant amounts of higher molecular weight, non GC-detectable species are expected to be present in the liquid product phase, particularly for Rh and Pd. This was indeed shown by GPC measurements of the product oils. A representative example for Pd/C is shown in Fig. 6 and shows the presence of a higher molecular weight tail, along with peaks corresponding to low molecular weight products (humin derived monomers and IPA and reaction products derived thereof).
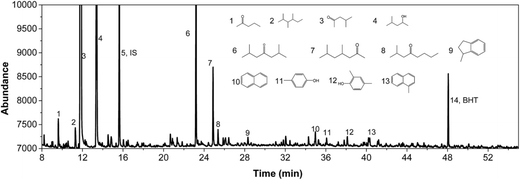
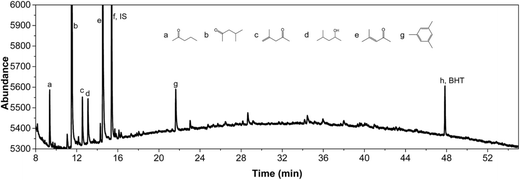
IPA was still present in all samples (not shown in Fig. 4 and 5, retention time is below 8 min), indicative that IPA conversion by dehydrogenation reactions is far from quantitative at the prevailing reaction conditions. For Pt/C major components are methyl-isobutylketone (MIBK, 3), its hydrogenated product (4), and two other 9 carbon aliphatic ketones (6, 7). All are likely formed from subsequent aldol condensation reactions of acetone (formed by IPA dehydrogenation to acetone, which was also detected at low retention times), see Scheme 2 for details.47 Compound 7 is a known reaction product when reacting MIBK with ethanol using Pd/C as the catalyst.48
In addition, some phenolics and aromatics/naphtalenes were present, which most likely arise from the depolymerisation/hydro(-deoxy)genation of humins. However, in the case of Ru/C, a clear peak was present at about 22 min (compound g, Fig. 5). This peak was assigned to as either 1-methyl-4-ethylbenzene or 1,3,5-trimethylbenzene by the MS library. Injection of both pure components show that component g is actually 1,3,5 trimethylbenzene based on retention times. As such, it is likely not derived from humins but a product from the cyclisation reaction of the aldolcondensation product mesityloxide with acetone.49 Thus, not all aromatics present in the reaction mixture are by definition derived from the humins. Further quantification of component classes was done by GCxGC and will be discussed in the following.
| a In wt% based on GC detectable in the liquid phase; product classes containing only minor amounts of products are not shown (e.g. organic acids).b Excluding acetone and IPA. | ||||
|---|---|---|---|---|
| Catalyst | Pt/C | Pd/C | Rh/C | Ru/C |
| Alkylphenolics | 6 | 15 | 31 | 12 |
| Aromatics | 9 | 9 | 8 | 6 |
| Linear/branched alkanes | <1 | <1 | <1 | <1 |
| Cyclic alkanes | 3 | 26 | 14 | 4 |
| Ketones/alcoholsb | 80 | 49 | 44 | 76 |
Further confirmation was obtained by comparing the GCxGC chromatograms (Fig. S5, ESI†) for the reactions with Pt/C in the presence and absence of humins (blank reaction). It is clearly evident that the blank reaction gives considerable amounts of ketones and alcohols arising from IPA, whereas particularly the alkylphenolics are absent. The latter component group is clearly visible when using humins, indeed a strong indication that the alkylphenolics are derived from the humins. The blank reactions show only one clear peak in the aromatics region, which was identified as 1,3,5-trimethyl-benzene, a known product from condensation reactions between mesityloxide and acetone (Scheme 2).50–53 As such, at least one of the aromatic components in the product mixture is derived from IPA/acetone and not solely from the humins.
The relative amounts of alkylphenolics in the GC detecables is the highest for Rh/C, whereas about similar amounts of aromatics were found for all catalysts (Table 2). The amounts of ketones/alcohols was highest for Pt/C and Ru/C, and by far lower for Pd/C, in line with a lower acetone dehydrogenation activity of the latter. However, of interest is also the amounts of GC detectables on humin intake. Though difficult to determine accurately by GCxGC due to the presence of the large amounts of individual components, a semi-quantitative assessment is possible when using average relative response factors for the various component classes.43 The results are given in Table 3.
| Catalyst | Pt/C | Pd/C | Rh/C | Ru/C |
|---|---|---|---|---|
| a In wt% based on humin intake in the liquid phase; experimental conditions: 400 °C, 3 h.b Includes also 1,3,5-trimethylbenzene, the product from the aldol condensation/cyclisation reactions involving acetone.c Excluding acetone and IPA. | ||||
| Humin derived products (wt% on humin intake) | ||||
| Alkylphenolics | 3.1 | 0.2 | 1.4 | 3.2 |
| Aromaticsb | 5.0 | 0.2 | 0.4 | 1.4 |
| (Cyclic) alkanes | 1.5 | 0.5 | 0.6 | 1.1 |
| Total humin derived (wt%) | 9.6 | 0.9 | 2.4 | 5.7 |
![[thin space (1/6-em)]](https://www.rsc.org/images/entities/char_2009.gif) |
||||
| IPA derived products (wt% on humin intake) | ||||
| Ketones/alcoholsc | 43 | 0.9 | 2 | 19 |
The amounts of GC detectables on humin intake is by far highest for Pt/C (about 53%), followed by Ru/C (25%), whereas the amounts are very low (<2%) for both Pd and Rh. These findings are in line with the peak intensities in the GC-MS chromatograms (Fig. 4, 5, S2 and S3 in the ESI†). It is also evident that the main GC detectables are derived from IPA, in amounts varying from 1–43 wt% on humin intake. The highest amounts were obtained for Pt/C, followed by Ru/C. When considering the dehydrogenation activity of IPA for the various catalyst, highest amounts of IPA/acetone derived products are expected for Ru/C, which shows higher dehydrogenation activity than Pt/C. However, this is not the case, implying that the subsequent aldolcondensation reactions of acetone are more promoted by Pt/C than by Ru/C.
Of interest is the amount of low molecular weight, volatile, GC detectable humin derived products (alkylphenolics and part of the aromatics). These are highest for Pt/C (9.6 wt% on humin intake), followed by Ru/C (5.7 wt% on humin intake). As such, when aiming for alkylphenolics, humin liquefaction is best performed using Pt/C. The presence of relatively low amounts of GC detectable compounds derived from the humins implies that product oils contain higher molecular weight, non-GC detectable compounds, in line with the higher molecular weight tail as observed by GPC (Fig. 6).
3.3 Reaction pathways
We have recently proposed a reaction network for the catalytic depolymerisation of humins using Ru/C in combination with formic acid and IPA.42 This network, excluding chemistry from formic acid, appears also valid for the metal catalysed reactions in IPA only (Fig. S6, ESI†). It consists of a number of parallel/consecutive reactions. The first step in the sequence is the depolymerisation of the humin structure to lower molecular weight fragments. This reaction may be thermally induced, as was shown recently by pyrolysis experiments with various humin sources.53 However, it is also likely that the metal catalysts play a role here, e.g. by hydrogenolysis reactions of linkages in the humin structure with molecular hydrogen produced from IPA dehydrogenation. At this stage, it is not clear whether the actual furanic structure of the humins is cleaved to lower molecular weight fragments or that the furanic humin structure is (partly) converted to a more aromatic structure and then depolymerised. This aromatisation of the humin structure has been observed both for gasification experiments with humins36,37,54 as well as for a base catalysed treatment of the humins at about 200–250 °C.55 Further catalytic breakdown of the structures will lead to the formation of alkylphenolics and/or furanics. Furanics were not observed in the reaction mixture and a possible reaction pathway involves aromatisation of furanics to aromatics, which is a well precedented reaction.56 These alkylphenolics may be hydrodeoxygenated to aromatics using supported metal catalysts. In addition, overhydrogenation may occur to give (cyclic) alkanes.It is of interest to compare the performance of the various catalysts. Evidently, Pd/C is by far the worse catalyst, showing the lowest humin conversion and the lowest amounts of GC-detectable components (Table 3). A likely explanation is the low IPA dehydrogenation activity of the Pd/C catalyst, in line with literature data,46 leading to low amounts of hydrogen in the gasphase. As such, the rate of hydrogenolysis and hydrodeoxygenation reactions is likely very low and humin liquefaction could be mainly due to thermal depolymerisation with the formation of relatively high molecular weight compounds that are not GC detectable. The most active catalyst is Pt/C, which gives the highest humin conversion and the highest amounts of GC detectable compounds. As such, both the dehydrogenation reaction and the subsequent hydrogenolysis/hydrodeoxygenation reactions are catalysed by Pt/C. On the basis of the known excellent IPA dehydrogenation activity of Ru/C, leading to considerable amounts of hydrogen which are necessary for the follow up reactions, best performance for this catalyst was anticipated. However, this is not the case and apparently the rate of the subsequent hydrogenolysis and hydrodeoxygenation reactions are slower in the case of Ru/C compared to Pt/C, leading to lower amounts of GC detectable species.
3.4 Systematic studies for Pt catalysts on various supports
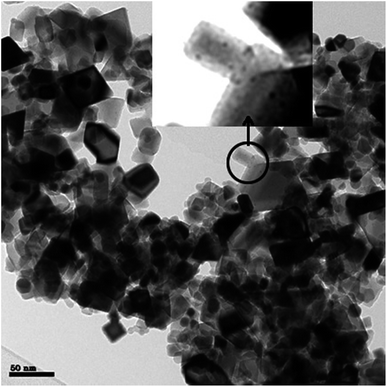
Best performance regarding humin conversion and the amounts of humin derived low molecular weight alkylphenolics and aromatics was obtained using Pt/C. As such, a subsequent study was performed on support effects for Pt based catalyst. For this purpose, three Pt catalysts on ZrO2, TiO2 and CeO2 were prepared using a wet impregnation procedure with platinum acetylacetonate as the precursor. After synthesis, the catalysts were calcined (300–600 °C) and reduced (600 °C, 10% hydrogen in nitrogen). For a proper comparison with the carbon based catalyst, the Pt loading on the catalysts was set at 5 wt%.TEM was used to determine the average Pt nanoparticle sizes and the results are given in Table 4. The average Pt nanoparticle size for the zirconia and titania supported catalysts are similar and between 8.1–8.5 nm. For the ceria based catalyst, both small and large Pt nanoparticles are observed, see Fig. 7 for details. The average size of the larger Pt particles is about 9 nm, which is close to those in Pt/ZrO2 and Pt/TiO2 (Fig. S7 in the ESI†). The average size of the Pt nanoparticles is relatively large when comparing literature data for supported Pt catalysts on inorganic supports.57–64 Possible explanations are the relatively high metal loading and the use of a rather high reduction temperature (up to 600 °C, see Experimental section), which may lead to sintering/agglomeration during reduction.
| a All reactions were carried out with 13 wt% humins (from D-glucose) on total intake, 17 wt% catalyst on humin intake and 400 °C for 3 h. | ||||
|---|---|---|---|---|
| Experiment | 4 | 6 | 7 | 8 |
| Catalyst | Pt/C | Pt/TiO2 | Pt/CeO2 | Pt/ZrO2 |
| Oil yield, (wt% on total feed) | 78 | 62 | 76 | 68 |
| Solids, (wt% on total feed) | 3.1 | 6.5 | 4.2 | 5.1 |
| Humin conversion, wt% | 77 | 51 | 68 | 62 |
| Gas phase (wt% on total feed) | 16 | 28 | 15 | 19 |
| Mass balance closure (wt% on total feed) | 96 | 96 | 95 | 93 |
Mass balance closure for all experiments was good and above 93%. The main product was again a single liquid phase, in yields between 62 and 78 wt% yield. Humin conversion was between 51 and 77%. Highest humin conversion was obtained with Pt/C, whereas Pt/TiO2 gave the worse results (51 wt%). For the latter catalyst, the amount of gas phase components formed is by far the highest and actually about twice as high as for the other catalysts.
3.5 Analysis of the liquid product phase
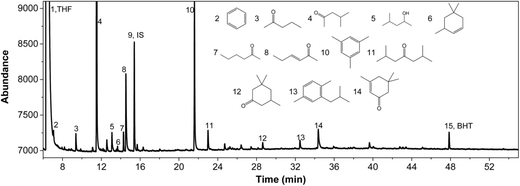
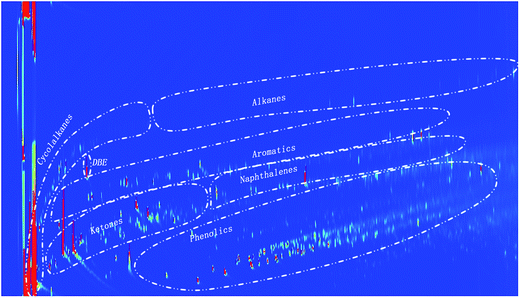
A representative example of a GC-MS chromatogram of the liquid product phase is given in Fig. 8 for Pt/TiO2, the others are provided in the ESI (Fig. S8 and S9†). As for Pt/C, the main reaction products for Pt/TiO2 are derived from IPA/acetone and include MIBK (4), aldol products with 9 carbon atoms and isophoron (14), hydrogenation products derived thereof (6, 13) and 1,3,5-trimethylbenzene (10). Isophoron is only observed in reaction mixtures from Pt/TiO2, and actually not detected for Pt/C (Fig. 4). It is a known condensation product of acetone, which may be formed in the presence of inorganic bases.65–67 The observation that isophoron is solely detected when using titania as the support, implies that the support, and likely the acid/basic properties, plays a role in the formation pathways to isophoron. In addition, peaks particularly from alkylphenolics and aromatics were observed, of which the former certainly arise from the depolymerisation/hydrodeoxygenation of the humin structure and these were further quantified using GCxGC-FID.The GCxGC-FID spectra for the reaction products for Pt/CeO2 is given in Fig. 9, those of the others in the ESI (Fig. S10 and S11†). Of interest is the relatively high intensity of the peaks in the alkylphenolics region when using the Pt/CeO2 catalyst.
The distribution of the various component classes based on GC detectables is given in Table 6 (including Pt/C as the bench mark).
| a Based on GC detectables in the liquid phase by GCxGC-FID; experimental conditions: 400 °C, 3 h. Minor component belonging to other product classes are not provided (e.g. organic acids).b Excluding acetone and IPA. | ||||
|---|---|---|---|---|
| Catalyst | Pt/C | Pt/TiO2 | Pt/CeO2 | Pt/ZrO2 |
| Alkylphenolics | 6 | 16 | 30 | 6 |
| Aromatics | 9 | 11 | 1 | 1 |
| Linear/branched alkanes | <0.1 | <0.1 | <0.1 | <0.1 |
| Cyclic alkanes | 3 | 4 | 7 | 35 |
| Ketones/alcoholsb | 80 | 66 | 55 | 58 |
The product distribution for the 4 catalysts differs considerably. Highest amounts of alkylphenolics, products definitely derived from humins and not from IPA/acetone (as proven by blank reactions, vide supra), were found for Pt/CeO2 (see also Fig. 9). This either suggest that Pt/CeO2 is a good catalyst for humin depolymerisation/hydro(deoxy)genation reactions to lower molecular weight components or a poor catalyst for the aldolcondensation reactions involving acetone. As such, it is better to compare the amounts of component classes based on humin intake (Table 7).
| Catalyst | Pt/C | Pt/TiO2 | Pt/CeO2 | Pt/ZrO2 |
|---|---|---|---|---|
| a In wt% based on humin intake. Conditions: 400 °C, 3 h.b Excluding acetone and IPA. | ||||
| Humin derived products (wt% on hunin intake) | ||||
| Alkylphenolics | 3.1 | 10.8 | 20.4 | 1.5 |
| Aromatics | 5.0 | 7.5 | 0.9 | 0.2 |
| (Cyclic) alkanes | 1.5 | 3.0 | 4.6 | 8.9 |
| Total | 9.6 | 21.3 | 25.9 | 10.6 |
![[thin space (1/6-em)]](https://www.rsc.org/images/entities/char_2009.gif) |
||||
| IPA derived products (wt% on humin intake) | ||||
| Ketones/alcoholsb | 43 | 43 | 37 | 15 |
The highest amounts of GC detectables from humins was indeed obtained when using Pt/CeO2, the majority of the compounds being alkylphenolics. These findings are also in line with the high humin conversion level (68 wt%, Table 5). Thus we can conclude that particularly Pt/CeO2 is a good catalyst for the conversion of humins to low molecular weight components and particularly alkylphenolics. When compared to Pt/C, the humin conversion slightly lower (68 wt% versus 77 for Pt/C), though the depolymerisation activity is higher for Pt/CeO2, as is evident from the about 3 times higher amount of low molecular weight products derived from humins (Table 7). Whether this good performance is related to the average Pt nanoparticle size (very small particles observed for Pt/CeO2 besides larger particles, see Fig. 7) or specifically related to the support structure (amongst others redox activity) needs to be investigated, e.g. by using humin model compounds. These studies are in progress and will be reported in due course.
4. Conclusions
In this paper, we have shown that it is possible to catalytically liquefy humins by a treatment in IPA at elevated temperatures using noble metal catalysts (Pt, Rh, Pd, Ru) on various supports. An initial screening study using carbon supports showed that Pt is the most promising catalyst when considering the humin conversion and composition of the liquid phase. Hydrogen, formed in situ by IPA dehydrogenation to acetone, is expected to play a key role and is an important reactant for subsequent hydrogenolysis and hydro(-deoxy)genation reactions of humins to low molecular weight humin derived compounds. The Pt/C based catalyst performs best and shows a good balance between dehydrogenation activity (to form hydrogen) combined with hydrogenolysis/hydrodeoxygenation activity required to depolymerise the humin structure.Analysis of the product mixture is hampered by the formation of significant amounts of aldol condensation products from acetone. However, using GCxGC and in combination with blank reactions in the absence of humins, it proved possible to identify that particularly low molecular weight alkylphenolics are formed from the humins, besides some aromatics. In addition, higher molecular weight species are present in the liquid product phase (GPC), likely humin oligomers.
Subsequent screening studies with Pt based catalyst on various inorganic supports show a clear support effect on humin conversion and the composition of the liquid phase. Particularly the ceria support shows promising results and good humin conversion is coupled with the formation of considerable amounts of alkylphenolics (up to 20% on humin intake).
Though a complex reaction mixture is obtained with product both from humins and the solvent, the development of efficient separation technology may allow the separation of the aldolcondensation products (like MIBK) and alkylphenolics from the mixture. Both component groups are existing, commercially available bulk chemicals with a high application range. For instance MIBK is used as a solvent whereas mixtures of alkylphenolics may be used as replacement of phenol in phenol based adhesive formulations.68 In addition, mixtures of alkylphenolics may also be used as biofuel blending agents to improve diesel engine performance.69,70
Acknowledgements
This research has been performed within the framework of the CatchBio program, project 053.70.732. The authors gratefully acknowledge the financial support of the Smart Mix program of the Ministry of Economic Affairs and the Netherlands Ministry of Education, Culture and Science.References
- D. J. Hayes, S. Fitzpatrick, M. H. B. Hayes and J. R. H. Ross, The Biofine Process – Production of Levulinic Acid, Furfural, and Formic Acid from Lignocellulosic Feedstocks, Wiley-VCH Verlag GmbH, 2008, ch. 7, pp. 139–164 Search PubMed.
- S. W. Fitzpatrick, Lignocellulose degradation to furfural and levulinic acid, US4897497A, 1990.
- K. D. Baugh and P. L. McCarty, Biotechnol. Bioeng., 1988, 31, 50–61 CrossRef CAS PubMed.
- C. Zhou, X. Xia, C. Lin, D. Tong and J. Beltramini, Chem. Soc. Rev., 2011, 40, 5588–5617 RSC.
- J. P. Lange, E. van der Heide, J. van Buijtenen and R. Price, ChemSusChem, 2012, 5, 150–166 CrossRef CAS PubMed.
- S. Ummartyotin and C. Pechyen, Renewable Sustainable Energy Rev., 2016, 62, 654–664 CrossRef CAS.
- K. J. Wu, Y. L. Wu, Y. Chen, H. Chen, J. L. Wang and M. D. Yang, ChemSusChem, 2016, 9, 1355–1385 CrossRef CAS PubMed.
- Z. Knez, E. Markocic, M. K. Hrncic, M. Ravber and M. Skerget, J. Supercrit. Fluids, 2015, 96, 46–52 CrossRef CAS.
- E. C. van der Pol, R. R. Bakker, P. Baets and G. Eggink, Appl. Microbiol. Biotechnol., 2014, 98, 9579–9593 CrossRef CAS PubMed.
- H. Rasmussen, H. R. Sorensen and A. S. Meyer, Carbohydr. Res., 2014, 385, 45–57 CrossRef CAS PubMed.
- R. A. Sheldon, Green Chem., 2014, 16, 950–963 RSC.
- R. J. van Putten, J. C. van der Waal, E. de Jong, C. B. Rasrendra, H. J. Heeres and J. G. de Vries, Chem. Rev., 2013, 113, 1499–1597 CrossRef CAS PubMed.
- M. J. Biddy, C. Scarlata and C. Kinchin, Chemicals from Biomass: A Market Assessment of Bioproducts with Near-Term Potential, Energy Laboratory of The U.S. Department of Energy, 2016 Search PubMed.
- J. C. Serrano-Ruiz, R. M. West and J. A. Durnesic, Annu. Rev. Chem. Biomol. Eng., 2010, 1, 79–100 CrossRef CAS PubMed.
- P. Gallezot, Chem. Soc. Rev., 2012, 41, 1538–1558 RSC.
- Z. Hu, S. Liu, Z. Yue, L. Yan, M. Yang and H. Yu, Environ. Sci. Technol., 2008, 42, 276–281 CrossRef CAS PubMed.
- S. K. Maity, Renewable Sustainable Energy Rev., 2015, 43, 1427–1445 CrossRef CAS.
- T. Werpy and G. Petersen, Top Value Added Chemicals form Biomass Volume I – Results of Screening for Potential Candidates from Sugars and Synthesis Gas, National Renewable Energy Laboratory (NREL), 2004 Search PubMed.
- B. Girisuta, L. P. B. M. Janssen and H. J. Heeres, Ind. Eng. Chem. Res., 2007, 46, 1696–1708 CrossRef CAS.
- B. Girisuta, L. P. B. M. Janssen and H. J. Heeres, Chem. Eng. Res. Des., 2006, 84, 339–349 CrossRef CAS.
- B. Girisuta, L. P. B. M. Janssen and H. J. Heeres, Green Chem., 2006, 8, 701–709 RSC.
- B. D. Mullen, E. J. Molitor and A. K. Schrock, Oxidation of solids bio-char from levulinic acid processes, WO2015134349 A1, 2015.
- E. J. Molitor and B. D. Mullen, Method of manufacturing dicarboxylic acids and derivatives from compositions comprising ketocarboxylic acids, EP2970078 A1, 2016.
- K. Yan, C. Jarvis, J. Gu and Y. Yan, Renewable Sustainable Energy Rev., 2015, 51, 986–997 CrossRef CAS.
- J. J. Bozell, L. Moens, D. C. Elliott, Y. Wang, G. G. Neuenscwander, S. W. Fitzpatrick, R. J. Bilski and J. L. Jarnefeld, Resour., Conserv. Recycl., 2000, 28, 227–239 CrossRef.
- B. Girisuta, L. P. B. M. Janssen and H. J. Heeres, Chem. Eng. Res. Des., 2006, 84, 339–349 CrossRef CAS.
- I. van Zandvoort, Y. Wang, C. B. Rasrendra, E. R. H. van Eck, P. C. A. Bruijnincx, H. J. Heeres and B. M. Weckhuysen, ChemSusChem, 2013, 6, 1745–1758 CrossRef CAS PubMed.
- A. Funke and F. Ziegler, Biofuels, Bioprod. Biorefin., 2010, 4, 160–177 CrossRef CAS.
- M. Sevilla and A. B. Fuertes, Chem.–Eur. J., 2009, 15, 4195–4203 CrossRef CAS PubMed.
- M. Sevilla, J. A. Macia-Agullo and A. B. Fuertes, Biomass Bioenergy, 2011, 35, 3152–3159 CrossRef CAS.
- M. Sevilla and A. B. Fuertes, Carbon, 2009, 47, 2281–2289 CrossRef CAS.
- N. Baccile, G. Laurent, F. Babonneau, F. Fayon, M. M. Titirici and M. Antonietti, J. Phys. Chem. C, 2009, 113, 9644–9654 CAS.
- I. Sumerskii, S. Krutov and M. Zarubin, Russ. J. Appl. Chem., 2010, 83, 320–327 CrossRef CAS.
- S. K. R. Patil and C. R. F. Lund, Energy Fuels, 2011, 25, 4745–4755 CrossRef CAS.
- I. van Zandvoort, E. J. Koers, M. Weingarth, P. C. A. Bruijnincx, M. Baldus and B. M. Weckhuysen, Green Chem., 2015, 17, 4383–4392 RSC.
- T. M. C. Hoang, L. Lefferts and K. Seshan, ChemSusChem, 2013, 6, 1651–1658 CrossRef CAS PubMed.
- T. M. C. Hoang, E. R. H. van Eck, W. P. Bula, J. G. E. Gardeniers, L. Lefferts and K. Seshan, Green Chem., 2015, 17, 959–972 RSC.
- C. B. Rasrendra, M. Windt, Y. Wang, S. Adisasmito, I. G. B. N. Makertihartha, E. R. H. van Eck, D. Meier and H. J. Heeres, J. Anal. Appl. Pyrolysis, 2013, 104, 299–307 CrossRef CAS.
- M. Trautmann, A. Lowe and Y. Traa, Green Chem., 2014, 16, 3710–3714 RSC.
- M. Trautmann, S. Lang and Y. Traa, Fuel, 2015, 151, 102–109 CrossRef CAS.
- L. Lemee, L. Pinard, R. Beauchet and D. Kpogbemabou, Bioresour. Technol., 2013, 149, 465–469 CrossRef CAS PubMed.
- Y. Wang, S. Agarwal, A. Kloekhorst and H. J. Heeres, ChemSusChem, 2016, 9, 951 CrossRef CAS PubMed.
- A. Kloekhorst, J. Wildschut and H. J. Heeres, Catal. Sci. Technol., 2014, 4, 2367–2377 CAS.
- Y. Ando, M. Yamashita and Y. Saito, Bull. Chem. Soc. Jpn., 2003, 76, 2045–2049 CrossRef CAS.
- Y. A. M. T. Ukisu, React. Kinet. Catal. Lett., 2004, 81, 305–311 CrossRef CAS.
- Y. Ukisu and T. Miyadera, React. Kinet. Catal. Lett., 2004, 81, 305–311 CrossRef CAS.
- M. Sakurai, H. Honda and H. Kameyama, Int. J. Hydrogen Energy, 2007, 32, 1303–1308 CrossRef CAS.
- A. Hinnen and J. Dreux, Bull. Soc. Chim. Fr., 1964, 1492–1498 CAS.
- E. Sucharda and H. Kuczynski, Rocz. Chem., 1934, 14, 1182 CAS.
- S. C. Luo and J. L. Falconer, J. Catal., 1999, 185, 393–407 CrossRef CAS.
- P. M. Reis, J. Silva, J. Da Silva and A. Pombeiro, J. Mol. Catal. A: Chem., 2004, 224, 189–195 CrossRef CAS.
- S. Smeds, T. Salmi and D. Y. Murzin, Appl. Catal., A, 1999, 185, 131–136 CrossRef CAS.
- C. B. Rasrendra, M. Windt, Y. Wang, S. Adisasmito, I. G. B. N. Makertihartha, E. R. H. van Eck, D. Meier and H. J. Heeres, J. Anal. Appl. Pyrolysis, 2013, 104, 299–307 CrossRef CAS.
- T. M. C. Hoang, PhD thesis, University of Twente, The Netherlands, 2015.
- I. van Zandvoort, PhD thesis, Utrecht University, The Netherlands, 2015.
- Y. T. Cheng and G. W. Huber, ACS Catal., 2011, 1, 611–628 CrossRef CAS.
- H. Iida and A. Igarashi, Appl. Catal., A, 2006, 298, 152–160 CrossRef CAS.
- I. Rekkab-Hammoumraoui, A. Choukchou-Braham, L. Pirault-Roy and C. Kappenstein, Bull. Mater. Sci., 2011, 34, 1127–1135 CrossRef.
- T. Mitsui, K. Tsutsui, T. Matsui, R. Kikuchi and K. Eguchi, Appl. Catal., B, 2008, 78, 158–165 CrossRef CAS.
- K. A. S. K. Nagaoka, Catal. Lett., 2005, 99, 97–100 CrossRef CAS.
- Y. Chen, Z. Wang, Y. Zhang, J. Zhou and K. Cen, Int. J. Hydrogen Energy, 2010, 35, 445–451 CrossRef CAS.
- S. K. Meher, M. Cargnello, H. Troiani, T. Montini, G. R. Rao and P. Fornasiero, Appl. Catal., B, 2013, 130–131, 121–131 CrossRef CAS.
- M. Abid, G. Ehret and R. Touroude, Appl. Catal., A, 2001, 217, 219–229 CrossRef CAS.
- S. A. Singh and G. Madras, Appl. Catal., A, 2016, 518, 102–114 CrossRef CAS.
- A. A. A. K. Maerle, Russ. J. Phys. Chem. A, 2016, 90, 1212–1216 CrossRef CAS.
- I. Krivtsov, L. Faba, E. Díaz, S. Ordóñez, V. Avdin, S. Khainakov and J. R. Garcia, Appl. Catal., A, 2014, 477, 26–33 CrossRef CAS.
- J. J. Nitz, Hydrolysis of the residues obtained in the production of isophorone to recover isophorone and acetone, US9035102 B2, 2015.
- A. Effendi, H. Gerhauser and A. V. Bridgwater, Renewable Sustainable Energy Rev., 2008, 12, 2092–2116 CrossRef CAS.
- M. Boot, in Biofuels from Lignocellulosic Biomass: Innovations beyond Bioethanol, Wiley-VCH, 2016 Search PubMed.
- R. W. G. Van Haaren, PhD thesis, Technische Universiteit Eindhoven, The Netherlands 2014.
Footnote |
| † Electronic supplementary information (ESI) available. See DOI: 10.1039/c6ra24218a |
| This journal is © The Royal Society of Chemistry 2017 |


