 Open Access Article
Creative Commons Attribution 3.0 Unported Licence
The positive role of (NH4)3AlF6 coating on Li[Li0.2Ni0.2Mn0.6]O2 oxide as the cathode material for lithium-ion batteries
Feng Wuab,
Qing Xuea,
Li Liab,
Xiaoxiao Zhanga,
Yongxin Huanga,
Ersha Fana and
Renjie Chen *ab
*ab
aBeijing Key Laboratory of Environmental Science and Engineering, Beijing Institute of Technology, Beijing 100081, P. R. China. E-mail: chenrj@bit.edu.cn
bCollaborative Innovation Center of Electric Vehicles in Beijing, Beijing 100081, P. R. China
First published on 5th January 2017
Abstract
Different amounts of (NH4)3AlF6 (1, 3, and 6 wt%) are successfully coated on the surface of the layered lithium-rich cathode Li[Li0.2Ni0.2Mn0.6]O2 using a wet coating method. The morphology and structure of the as-prepared materials are characterized by X-ray diffraction (XRD), scanning electron microscopy (SEM), transmission electron microscopy (TEM), and energy dispersive X-ray spectroscopy (EDX). It is confirmed that the (NH4)3AlF6 was uniformly coated onto the surface of the Li[Li0.2Ni0.2Mn0.6]O2. The electrochemical performance of the coated materials at room temperature and 50 °C is investigated systematically. The material coated with 3 wt% (NH4)3AlF6 exhibits the highest reversible capacity of 220.3 mA h g−1 (0.2C, 50 cycles) as well as the best cycling performance with a capacity retention of 83.4% (0.2C, 50 cycles), attributed to the suppression of unexpected surface side reactions by the protective layer of (NH4)3AlF6. Electrochemical impedance spectroscopy (EIS) analysis reveals that the lower charge transfer resistance of the coated sample may contribute to its excellent rate capability. Furthermore, the coated sample also shows enhanced cycling performance at elevated temperature owing to an improved thermal stability, confirmed by differential scanning calorimetry (DSC).
Introduction
Although environmental problems and the energy crisis have stimulated a boom in new energy vehicles, their use is still constrained by their power sources. Lithium-ion batteries (LIBs) are being extensively developed to power hybrid electric vehicles (HEVs) and electric vehicles (EVs) owing to their high capacity, high voltage, and environmental friendliness.1–6 It is widely believed that the cathode material has been the restriction in the development of high performance LIBs because of the limited capacity of conventional commercial cathodes such as LiCoO2, LiFePO4, and LiMn1/3Ni1/3Co1/3O2, etc. Consequently, the majority of LIB researchers are devoted to developing high performance cathode materials.In the past decade, lithium-rich Mn-based layered oxides have been widely investigated due to their extremely high capacity (>250 mA h g−1).7–9 Among these Li-rich cathode materials, xLi2MnO3·(1 − x)LiNi1/2Mn1/2O2 (also described as Li[Li1/3−2x/3NixMn2/3−x/3]O2) has been considered to be an inspirational cathode candidate for LIBs.10–12 In a general sense, Li[Li1/3−2x/3NixMn2/3−x/3]O2 is believed to be an integrated structure of Li2MnO3 and LiNi1/2Mn1/2O2 with a layered α-NaFeO2-type structure.10,13,14 Its charge–discharge mechanism is widely considered to be follows: (i) when operated below 4.5 V, the Li+ will intercalate/deintercalate from the layered LiNi1/2Mn1/2O2. (ii) More Li+ can then be extracted from the Li2MnO3 component accompanying the loss of oxygen and structural rearrangement, at further charging to 4.8 V or higher potential.15–19 The second step may contribute more capacity. However, only partial Li+ reinsert into the cathode occurs during the first discharge process because of the loss of Li2O at the end of the first charge.18 Consequently, a large irreversible capacity loss will occur during the first charge–discharge cycle. In addition, lithium-rich cathode materials also exhibit poor rate performance and gradual voltage drop during cycling. These major drawbacks of Li-rich cathode materials have hindered their practical application.
Numerous strategies have been investigated to overcome these drawbacks of lithium-rich materials. Doping with cations or anions such as Al3+,20 Mg2+,21 K+,22 and F− (ref. 23) have been reported to alleviate the phase transition from the layered structure to the spinel variant or increase electronic conductivity, which can improve the electrochemical performance of lithium-rich materials to some extent. Preconditioning with HNO3,24 HF25 or (NH4)2SO4 (ref. 26) has been conducted to enhance the initial coulombic efficiency or rate capability of the material. Furthermore, surface coating is considered to be the simplest and cost effective method of improving electrochemical performance. Various coating materials have been explored, such as metal oxides (Al2O3, ZnO, MgO, Sm2O3, MoO3, etc.),27–31 metal phosphates (AlPO4, FePO4, LiNiPO4),32–34 metal fluorides (AlF3, CeF3),35,36 MoS2 (ref. 37) and Li4Ti5O12.38 These coating materials have been proved to either protect the interface between the cathode and electrolyte or reduce the charge transfer resistance, thus enhancing the cycling stability, rate capability, or other electrochemical performance factors.
As a representative of Li[Li1/3−2x/3NixMn2/3−x/3]O2, Li[Li0.2Ni0.2Mn0.6]O2 has hitherto generated particular attention.15,39–42 It has been modified with MnOx,40 LiAlO2 (ref. 43) and Li3VO4 (ref. 44) to obtain better cycling stability and rate capacity, or to lower its initial capacity loss, as mentioned above. Recently, a novel material, (NH4)3AlF6, has been developed as an effective surface coating material for LIBs. It was first used in the form of a mildly acidic and fluorinated solution to precondition Li2MnO3-stabilized LiMO2 electrodes by Thackeray's group.25 The pretreatment was considered to be a washing step that etched and passivated the whole electrode surface to lower the cell impedance and enhance its rate capability. Sun et al. modified LiNi1/3Co1/3Mn1/3O2 with (NH4)3AlF6 using a ball milling-dry coating process. The coated ternary material showed enhanced lithium-ion intercalation stability and thermal stability at 55 °C and a high cutoff voltage of 4.5 V.45 Xu et al. reported a novel wet coating method to coat 0.5Li2MnO3·0.5LiNi1/3Co1/3Mn1/3O2 with (NH4)3AlF6, and obtained enhanced electrochemical performance.46 It stands to reason, therefore, that it may be possible to combine the benignity of Li[Li0.2Ni0.2Mn0.6]O2 and the advantages of (NH4)3AlF6 coating to obtain a higher performance cathode material for LIBs.
Herein, we developed a (NH4)3AlF6-coated Li[Li0.2Ni0.2Mn0.6]O2 high-performance cathode material using a wet coating method. Wet (NH4)3AlF6 coating has the same effect as acid pretreatment that can mimic the charge process by removing Li2O from the Li2MnO3 component,24,25 thereby minimizing the irreversible capacity loss during the initial-cycle. Additionally, as a mildly acidic solution it can minimize the damage to the electrode particle surface during the acid treatment process.25 Furthermore, (NH4)3AlF6 maintains the surface-stabilizing merits of Al and F elements,46 enhancing the cycling stability and rate capability of the cathode material. In the present work, the Li[Li0.2Ni0.2Mn0.6]O2 (named LLNMO) was successfully synthesized using a fast co-precipitation method. Different amounts of (NH4)3AlF6 (hereafter using NAF for simplicity) were coated on the surface of LLNMO using a wet coating process with methanol as the solvent. The structure and morphology of the materials were characterized and the electrochemical performance of the coated materials at room temperature and elevated temperature (50 °C) were studied in detail.
Experimental
Material synthesis
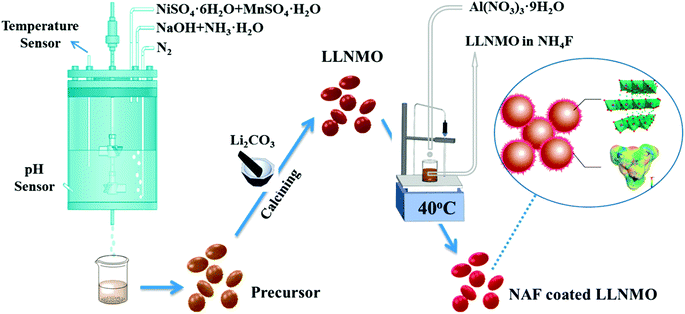
The active material Li[Li0.2Ni0.2Mn0.6]O2 (LLNMO) was synthesized by a fast co-precipitation method using sulfate sources. All the chemicals were of analytical grade and used as-received without further purification. Raw reagents to prepare the precursor Ni0.25Mn0.75(OH)2 were manganese sulfate monohydrate (MnSO4·H2O), nickel sulfate hexahydrate (NiSO4·6H2O), sodium hydroxide (NaOH), and ammonium hydroxide (NH3·H2O). A 2 M solution with a Ni/Mn atomic ratio of 1/3 was pumped into a continuous stirring tank reactor (CSTR) at a speed of 0.5 L h−1. Simultaneously, a 2 M NaOH solution and a required amount of NH3·H2O solution were infused into the CSTR to adjust the pH to 11. The agitation speed of the mixture was cautiously controlled at 1000 rpm and the reaction temperature was kept at 60 °C during the whole reaction process. N2 was bubbled into the CSTR to alleviate the oxidation of the Mn2+ and Ni2+. After washed with deionized water several times to eliminate residual sulfuric and sodium species, the obtained materials were then filtered and dried in a vacuum oven at 80 °C for 24 h to obtain Ni0.25Mn0.75(OH)2 powders. The as-synthesized precursor powder was ground thoroughly with Li2CO3 and calcined using a step procedure in a muffle furnace at 600 °C for 5 h and then at 900 °C for 15 h to obtain LLNMO.The wet coating process was performed as follows: a desired amount of as-prepared LLNMO powder was dispersed in NH4F methanol solution under stirring to obtain slurry. Next, a methanol solution of Al(NO3)3·9H2O was dropped into the slurry accompanying continuous stirring for 3 h at 40 °C (the mole ratio of NH4F to Al(NO3)3·9H2O was 6![[thin space (1/6-em)]](https://www.rsc.org/images/entities/char_2009.gif) :
:![[thin space (1/6-em)]](https://www.rsc.org/images/entities/char_2009.gif) 1). Finally, after filtered and washed with ethanol, the resulting precipitate was subsequently dried in vacuum oven for 12 h at 80 °C to gain the NAF-coated LLNMO. Scheme 1 depicts a schematic diagram of the synthetic process. 1 wt% (mass percentage of NAF in the coated sample of about 1%), 3 wt%, and 6 wt% NAF coated samples were prepared and labeled NC-1, NC-3 and NC-6, respectively.
1). Finally, after filtered and washed with ethanol, the resulting precipitate was subsequently dried in vacuum oven for 12 h at 80 °C to gain the NAF-coated LLNMO. Scheme 1 depicts a schematic diagram of the synthetic process. 1 wt% (mass percentage of NAF in the coated sample of about 1%), 3 wt%, and 6 wt% NAF coated samples were prepared and labeled NC-1, NC-3 and NC-6, respectively.
Material characterization
Structural analysis of the prepared materials was performed using X-ray diffraction (XRD; Rigaku Ultima IV-185, Japan) with a Cu Kα radiation source. Data were acquired over a 2θ range of 10–90° at a scan rate of 8° min−1. The morphology of the materials was characterized using scanning electron microscopy (SEM; Hitachi S-4800, Japan) and transmission electron microscopy (TEM; JEM-2100f, Japan). Elemental mapping of the prepared materials was performed with energy-dispersive X-ray (EDX) detector equipped on the SEM and TEM instrument mentioned above. Quantitative analysis of LLNMO and NAF-coated samples were conducted by inductively coupled plasma atomic emission spectroscopy (ICP-AES). X-ray photoelectron spectroscopy (XPS) analysis was implemented on a PHI QUANTERA-II SXM system (Uivac-PHI, Japan) with a monochromatized Al Kα radiation source.Electrochemical measurements
The electrochemical performances were measured in coin-type cells (CR 2025) with two electrodes on the Land battery testers (Land CT2001A, Wuhan, China). The cathodes were prepared by milling a mixture of as-prepared active material, acetylene black, and polyvinylidene fluoride (PVDF) with mass ratio of 8![[thin space (1/6-em)]](https://www.rsc.org/images/entities/char_2009.gif) :
:![[thin space (1/6-em)]](https://www.rsc.org/images/entities/char_2009.gif) 1
1![[thin space (1/6-em)]](https://www.rsc.org/images/entities/char_2009.gif) :
:![[thin space (1/6-em)]](https://www.rsc.org/images/entities/char_2009.gif) 1 in N-methyl-2-pyrrolidone (NMP) solvent to form uniform slurry. Then the obtained slurry was cast on circular aluminum foil after which the as-prepared electrodes were dried at 80 °C for 12 h under vacuum. The dried electrodes were cut into thin discs and roll-pressed subsequently to promote the adhesion of cathode to the current collector. The weight of the electrode was controlled between 6 and 7 mg, corresponding to a thickness of about 20 μm. The coin-type cells were assembled in an argon-filled glove box using metallic lithium foil as the negative electrode and a Celgard 2400 separator soaked with the electrolyte of 1 M LiPF6 dissolved in a mixture of ethyl carbonate (EC) and dimethyl carbonate (DMC) (1
1 in N-methyl-2-pyrrolidone (NMP) solvent to form uniform slurry. Then the obtained slurry was cast on circular aluminum foil after which the as-prepared electrodes were dried at 80 °C for 12 h under vacuum. The dried electrodes were cut into thin discs and roll-pressed subsequently to promote the adhesion of cathode to the current collector. The weight of the electrode was controlled between 6 and 7 mg, corresponding to a thickness of about 20 μm. The coin-type cells were assembled in an argon-filled glove box using metallic lithium foil as the negative electrode and a Celgard 2400 separator soaked with the electrolyte of 1 M LiPF6 dissolved in a mixture of ethyl carbonate (EC) and dimethyl carbonate (DMC) (1![[thin space (1/6-em)]](https://www.rsc.org/images/entities/char_2009.gif) :
:![[thin space (1/6-em)]](https://www.rsc.org/images/entities/char_2009.gif) 1 by volume). The as prepared coin cells were analyzed at current densities of 40 mA g−1 (0.2C, 200 mA g−1 was defined as 1C rate in this paper) for 50 cycles to investigated the cycling performance and tested at various coulombic rates (0.1, 0.2, 0.5, 1.0, 2.0, and 5C) to evaluate the rate capability of the cathode materials. Electrochemical impedance spectroscopy (EIS) was also conducted on the cells before electrochemical cycling using the CHI660 electrochemical workstation at frequencies of 100 kHz to 10 mHz with an amplitude of 5 mV. The EIS results were analyzed using ZSimp Win software. All potentials given in this paper are referenced to the Li/Li+ couple.
1 by volume). The as prepared coin cells were analyzed at current densities of 40 mA g−1 (0.2C, 200 mA g−1 was defined as 1C rate in this paper) for 50 cycles to investigated the cycling performance and tested at various coulombic rates (0.1, 0.2, 0.5, 1.0, 2.0, and 5C) to evaluate the rate capability of the cathode materials. Electrochemical impedance spectroscopy (EIS) was also conducted on the cells before electrochemical cycling using the CHI660 electrochemical workstation at frequencies of 100 kHz to 10 mHz with an amplitude of 5 mV. The EIS results were analyzed using ZSimp Win software. All potentials given in this paper are referenced to the Li/Li+ couple.
Thermal properties
The thermal performance of the charged electrodes was investigated using a differential scanning calorimeter (DSC; METTLER 1/700/2038, Switzerland) from 50 °C to 350 °C at a heating rate of 5 °C min−1. For the measurement, the cells were firstly charged to 4.8 V and then disassembled in an argon-filled glove box to obtain charged cathode powder.Results and discussion
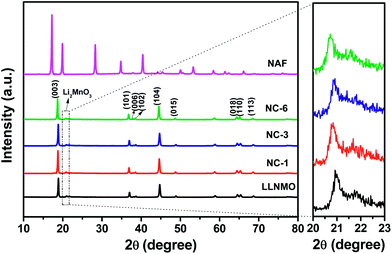
Fig. 1 exhibits the XRD patterns and corresponding Miller indices of the LLNMO, different NAF-coated samples, and NAF powder prepared by the same method without active material. The fairly narrow and sharp diffraction peaks indicate a high crystallinity of all of the tested samples. As shown in the top pattern of Fig. 1, the precipitation reaction of Al(NO3)3·9H2O and NH4F (mole ratio is 1![[thin space (1/6-em)]](https://www.rsc.org/images/entities/char_2009.gif) :
:![[thin space (1/6-em)]](https://www.rsc.org/images/entities/char_2009.gif) 6) methanol solution produced phase pure and highly crystalline (NH4)3AlF6, which matched well with PDF card no. 76-0117. This result confirms that NAF was successfully generated by the present coating process. The characteristic peaks of the LLNMO and NAF-coated samples can be identified as a layered α-NaFeO2 rock-salt structure with R
6) methanol solution produced phase pure and highly crystalline (NH4)3AlF6, which matched well with PDF card no. 76-0117. This result confirms that NAF was successfully generated by the present coating process. The characteristic peaks of the LLNMO and NAF-coated samples can be identified as a layered α-NaFeO2 rock-salt structure with R![[3 with combining macron]](https://www.rsc.org/images/entities/char_0033_0304.gif) m space group. The weak peak near 2θ = 20–22° (enlarged in the right region of the figure for clarity) correspond to the super lattice ordering of Li and Mn in the transition-metal layer, indicating a Li2MnO3-likely composition with monoclinic unit cell and C/2m space group.13,17 The sharp diffraction peaks and the clear splits of (006)/(102) and (018)/(110) for all the materials indicated the well-formed layered structure.47 No Al- or F-related impurity peaks were observed in the coated samples indicating the wet coating process did not introduce impurity into the LLNMO. The calculated lattice parameters and I(003)/I(104) ratio of all of the samples are presented in Table 1. Parameters “a” and “c” varied slightly after coating, especially parameter “c”. The slight decrease in “c” is probably attributable to the H+–Li+ exchange reaction during the coating process shortening the distance between oxygen layers.48 It is well documented that the value of c/a corresponds to the stability of a layered structure, and the I(003)/I(104) ratio is considered as an evaluation of the cation mixing degree.49,50 The coated samples had a c/a higher ratio than the pristine sample, indicating a better layered structure after coating. Furthermore, the I(003)/I(104) intensity ratio greatly increased after NAF coating, indicating a decrease in cation mixing between Li+ and Ni2+ in the coated samples.32 These factors are beneficial to enhance the crystallinity and electrochemical performance of the cathode material.
m space group. The weak peak near 2θ = 20–22° (enlarged in the right region of the figure for clarity) correspond to the super lattice ordering of Li and Mn in the transition-metal layer, indicating a Li2MnO3-likely composition with monoclinic unit cell and C/2m space group.13,17 The sharp diffraction peaks and the clear splits of (006)/(102) and (018)/(110) for all the materials indicated the well-formed layered structure.47 No Al- or F-related impurity peaks were observed in the coated samples indicating the wet coating process did not introduce impurity into the LLNMO. The calculated lattice parameters and I(003)/I(104) ratio of all of the samples are presented in Table 1. Parameters “a” and “c” varied slightly after coating, especially parameter “c”. The slight decrease in “c” is probably attributable to the H+–Li+ exchange reaction during the coating process shortening the distance between oxygen layers.48 It is well documented that the value of c/a corresponds to the stability of a layered structure, and the I(003)/I(104) ratio is considered as an evaluation of the cation mixing degree.49,50 The coated samples had a c/a higher ratio than the pristine sample, indicating a better layered structure after coating. Furthermore, the I(003)/I(104) intensity ratio greatly increased after NAF coating, indicating a decrease in cation mixing between Li+ and Ni2+ in the coated samples.32 These factors are beneficial to enhance the crystallinity and electrochemical performance of the cathode material.
| Sample | a | c | c/a | I(003)/I(104) |
|---|---|---|---|---|
| LLNMO | 2.8596 | 14.2737 | 4.9915 | 1.45 |
| NC-1 | 2.8557 | 14.2572 | 4.9925 | 1.61 |
| NC-3 | 2.8553 | 14.2456 | 4.9892 | 1.71 |
| NC-6 | 2.8517 | 14.2505 | 4.9972 | 1.52 |
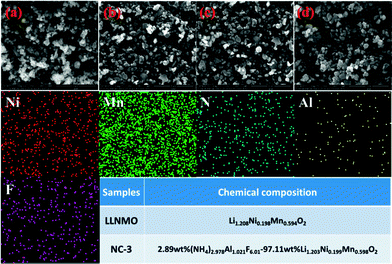
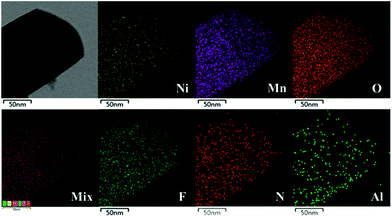
SEM images of LLNMO and diverse NAF-coated LLNMO samples are shown in Fig. 2. No obvious changes in morphology were observed after NAF coating, and all samples had a particle size of approximately 150–200 nm. EDX analysis was performed to investigate the homogeneity of the coating and the surface chemistry of all of the samples. The NC-3 sample was chosen as a representative sample for the following discussion. Ni, Mn, N, F, and Al elements were detected in the NC-3 sample. The uniform distribution of the N, F, and Al elements confirmed that the NAF was successfully coated onto the surface of Li1.2Ni0.2Mn0.6O2. The chemical composition of LLNMO and NC-3 samples calculated based on ICP and elemental analysis results were shown in the inset table in Fig. 2, indicating the good stoichiometry of the as-synthesized samples.
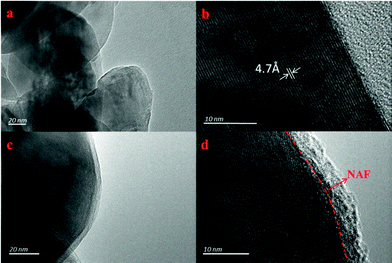
Fig. 3 shows TEM images of the LLNMO and NC-3 powders taken to further observe the NAF coating layer. It can be seen that the surface of LLNMO was smooth (Fig. 3a and b), while the NC-3 sample exhibited a coarse surface (Fig. 3c). A ∼5 nm coating layer can be seen in the high resolution image of the NC-3 cathode (Fig. 3d), further confirming the successful coating of the surface of the LLNMO.
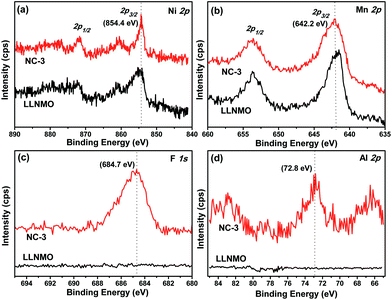
XPS analysis was carried out on LLNMO and NC-3 to determine the surface chemical composition and elemental oxidation states, as described in Fig. 4. The Ni 2p3/2 peak of the two samples appeared at a binding energy (BE) of 854.4 eV (Fig. 4a), in accordance with Ni2+ in Li[Li1/3−2x/3NixMn2/3−x/3]O2.51 The Mn 2p3/2 peak was centered at 642.2 eV (Fig. 4b), which is quite close to the BE reported for Mn4+ (642.4 eV) in Mn-based layered compounds.51 Thus, it can draw a conclusion that the oxidation state of Ni and Mn in the two samples was +2 and +4, respectively. As expected, F 1s and Al 2p peaks were only found for NC-3 and not for LLNMO. As observed in Fig. 4c, the F 1s peak at 684.7 eV could be assigned to F–M bonding, which was further confirmed by the BE of 72.8 eV for Al–F bond in the Al 2p spectra (Fig. 4d). These results indicate the presence of (NH4)3AlF6 on the surface of NC-3 sample.
Fig. 5 shows the initial charge/discharge profiles and corresponding differential capacity vs. voltage profiles of LLNMO and NAF-coated LLNMO samples (2.0–4.8 V, 0.1C). All the cells exhibited similar charge curves with a plateau around 4.5 V, which is distinguishing feature of lithium-rich materials.52,53 The slope below 4.5 V corresponded to the initial lithium migration from the layered component (LiNi0.5Mn0.5O2) with the oxidation of the transition metals, then the plateau around 4.5 V was ascribed to the oxygen loss accompanying with extraction of lithium from the rock salt Li2MnO3 lattice.15,17 However, the plateau did not appear in the following charge curves, demonstrating that the oxygen loss happened in the initial charge was an irreversible process. This irreversible process is believed to result in the large irreversible capacity loss (ICL) observed in the first cycling process.53
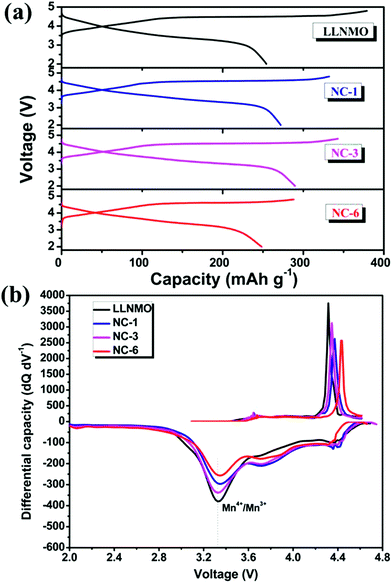 | ||
| Fig. 5 (a) Initial charge–discharge profiles at 0.1C between 2 and 4.8 V, and (b) corresponding differential capacity vs. voltage profiles of all samples. | ||
The initial charge and discharge capacity, ICL, and coulombic efficiency of all the materials are listed in Table 2. To a certain extent, the charge capacity decreased and the discharge capacity increased as the coating amount increased, resulting in higher initial cycle efficiency. This improvement can probably be ascribed to the inhibition of the oxide vacancy elimination as well as the side reactions of the cathode material with the electrolyte by the NAF coating layer. Nevertheless, when the coating amount was increased to 6 wt%, the resulting thick coating layer likely hindered Li+ diffusion and sacrificed some capacity, leading to a lower discharge capacity for the NC-6 sample. Therefore, the coating amount should be controlled within a certain range. All of the above results confirmed that the wet NAF-coating process had a positive effect on the discharge capacity and the initial coulombic efficiency of the cathode material.
| Sample | Charge capacity (mA h g−1) | Discharge capacity (mA h g−1) | ICLs (mA h g−1) | Coulombic efficiency (%) |
|---|---|---|---|---|
| LLNMO | 379 | 254.2 | 124.8 | 67.1 |
| NC-1 | 332.2 | 272.1 | 60.1 | 81.9 |
| NC-3 | 342.9 | 289.7 | 53.2 | 84.5 |
| NC-6 | 288.1 | 248.4 | 39.7 | 86.2 |
The cycling performances of the LLNMO and various NAF-coated samples between 2.0 V and 4.8 V at 0.2C are displayed in Fig. 6. Fig. 6a shows that the discharge capacity of all of the samples gradually declined to a constant level and the NC-3 sample exhibited the highest coulombic efficiency after 50 cycles. Additionally, the coated samples showed higher capacity retention (81.2%, 83.4%, and 78.5% for NC-1, NC-3, and NC-6, respectively) than the pristine LLNMO (75.8%), as shown in Fig. 6b, indicating an enhancement in cycling stability. This improvement was ascribable to the suppression of unexpected surface side reactions by the protective layer of NAF. The discharge capacities at the 1st and 50th cycles are shown in Fig. 6c, and indicate that the coated samples delivered a higher stable capacity than the pristine sample, except for sample NC-6. The lower capacity of NC-6 may be attributed to its thicker coating. In conclusion, the Li1.2Ni0.2Mn0.6O2 cathode showed higher discharge capacity and better cycle stability after coating with NAF, and the NC-3 sample (3 wt% NAF) had the best performance.
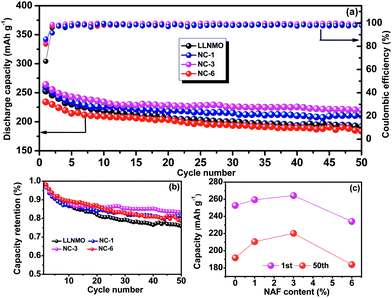 | ||
| Fig. 6 Cycling performance (2.0–4.8 V, 0.2C) of all the samples over 50 cycles: (a) capacity and coulombic efficiency, (b) capacity retention, and (c) discharge capacity at the 1st and 50th cycles. | ||
Voltage decay is believed to be a bottleneck for the practical application of high capacity Li-rich materials. The NAF coating suppressed the voltage decay of LLNMO, as shown by the charge–discharge profiles at different cycles and corresponding differential capacity vs. voltage profiles displayed in Fig. 7. The discharge profiles show that the pristine LLNMO greatly suffered from discharge voltage decay, whereas the coated sample exhibited a slight declining trend. The voltage decay can be further quantified by the shift in the discharge voltage peak (ΔV) of the differential curve at 3.3 V, where the structural transformation from layered to spinel occurred.8 The ΔV of LLNMO (0.415 V) was reduced after coating, and NC-3 exhibited the lowest value of 0.123 V. These results indicate that the NAF coating layer suppressed the phase transformation and thereby alleviated the voltage decay, and that the amount of coating applied should be adjusted to obtain optimal electrochemical performance.
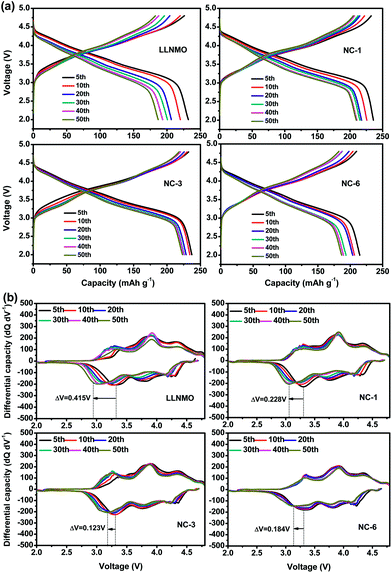 | ||
| Fig. 7 (a) Charge–discharge profiles of all samples at different cycles, and (b) corresponding differential capacity curves. | ||
Rate capability is important for practical application because it determine the charging time of batteries in electric devices, which depends on the diffusion rate of Li+ in the positive electrode.54 Accordingly, the rate capability of LLNMO and NAF-coated samples were investigated between 2.0 to 4.8 V. The results are described in Fig. 8. The cells were firstly charged at 0.1C but discharged at various current densities from 0.1C to 5C. For all tested rates, the NAF-coated samples performed higher capacities than the LLNMO electrode, and the superiority of the former was more obvious at higher rate, as displayed in the inset. All the coated samples exhibited better cycling stability and higher capacity than LLNMO. Particularly, the NC-3 sample still delivered 154.5 mA h g−1 after 50 cycles, 25 mA h g−1 higher than that of the pristine LLNMO (129.5 mA h g−1).
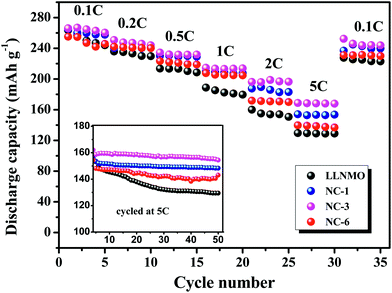 | ||
| Fig. 8 Rate performance of LLNMO and NAF-coated LLNMO electrodes at different discharge rates and (inset) performance at 5C rate over 50 cycles. | ||
EIS was implemented to investigate the observed enhancement in the rate performance of the coated samples. All measurements were performed prior to electrochemical oxidation. The Nyquist plots of the LLNMO and NAF-coated LLNMO are presented in Fig. 9. The inset depicts the possible equivalent circuit for the test system. All the samples showed typical Nyquist plots comprised of a semicircle in the high frequency region and a slope in the low frequency region. As reported,55 the semicircle represented the charge transfer reaction between the surface film and the active cathode mass, while the slope corresponded to lithium ion diffusion in the bulk material. The diameter of the semicircle represented the charge transfer resistance (Rct). As shown in the enlarged spectra at high frequency, Rct decreased greatly after coating with NAF in the following sequence: LLNMO > NC-6 > NC-1 > NC-3, in good accordance with the rate capability. The Nyquist plots were fitted with the Zview software, and the calculated values of Rct and RΩ are listed in Table 3. A thicker coating layer was unfavorable for the diffusion of Li+, so NC-6 exhibited a higher Rct than NC-1 and NC-3. In summary, an appropriate amount of NAF coating played an important role in reducing the charge transfer resistance and thus enhancing the rate stability of the cathode material.
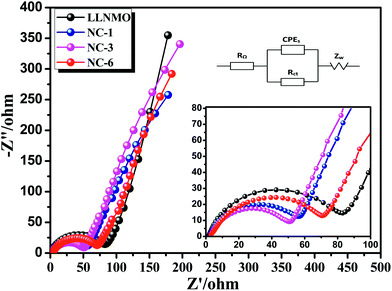 | ||
| Fig. 9 Nyquist plots for the LLNMO and NAF-coated LLNMO electrodes and (inset) enlargement of the high frequency region. | ||
| Sample | Rct | RΩ |
|---|---|---|
| LLNMO | 78.04 | 1.686 |
| NC-1 | 51.4 | 2.254 |
| NC-3 | 48.29 | 2.793 |
| NC-6 | 70.2 | 2.756 |
The AC test and TEM characterization of LLNMO and NC-3 cathodes after 50 cycles at 1C were performed to further investigate the enhanced electrochemical performance for NAF coating. As shown in Fig. 10a, the first semicircle at high-frequency are related to the resistance of Li+ diffusion through the surface film (RS) and the second semicircle at intermediate-frequency corresponding to the charge transfer resistance (Rct).
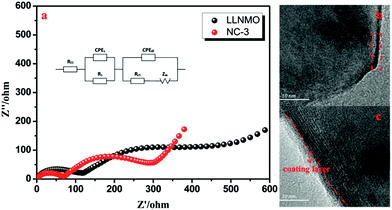 | ||
| Fig. 10 (a) Nyquist plots for the LLNMO and NC-3 electrodes after 50 cycles at 1C, (b) TEM images of cycled LLNMO, and (c) TEM images of cycled NC-3. | ||
The NC-3 sample exhibits a smaller Rct value than LLNMO, demonstrating the better rate capability. This enhancement can be further manifested by the TEM images shown in Fig. 10b and c. Some unfavorable byproducts accumulation can be seen on the surface of LLNMO particle (the red rectangle in Fig. 10b), contributing to the higher Rct value for LLNMO observed in Fig. 10a. By contrast, the NC-3 particle exhibits a smooth surface with a clear coating layer after long cycling, as shown in Fig. 10c. Accordingly, it is reasonable to conclude that the NAF coating layer can decrease the surface side reaction for a lower charge transfer resistance as well as protect the surface from HF attack for a better structural stability, corresponding to the better rate performance and cycling stability. In addition, the EDS mappings in Fig. 11 confirm the NAF coating layer in the cycled NC-3 sample.
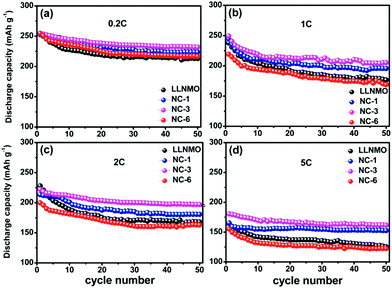
The cycling performance of pristine LLNMO and NAF-coated LLNMO at an elevated temperature of 50 °C is displayed in Fig. 12. Obviously, the NAF-coated samples performed better than the pristine LLNMO, and NC-3 exhibited the best cycle stability and highest capacity at every rate investigated. Moreover, the enhancement in performance was more obvious at higher rate. These results indicate the enhanced properties of the coated samples at elevated temperature, which can be explained by the increased thermal stability of the coated material.
The thermal stability and safety of cathode materials are of significant importance when considered for large-scale practical applications. Fig. 13 exhibits the differential scanning calorimetry curves of pristine LLNMO and NC-3 cathodes in a highly delithiated state. The LLNMO cathode exhibited an exothermic peak near 234.14 °C with a heat production of 14.59 J g−1. However, the exothermic peak of NC-3 sample located at 244.83 °C with a reduced heat generation of 1.22 J g−1. We propose that this enhanced thermal stability of the NC-3 material is probably due to the thermally stable coating-layer preventing the pristine LLNMO from directly contacting the liquid electrolyte.
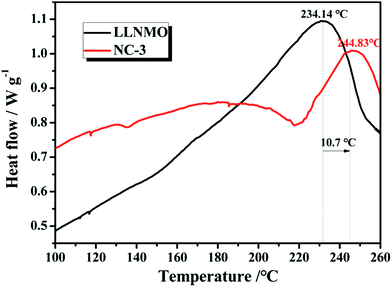 | ||
| Fig. 13 Differential scanning calorimetry (DSC) curves for LLNMO and NC-3 cathodes charged to 4.8 V. | ||
Conclusions
As-synthesized Li-rich Li1.2Ni0.2Mn0.6O2 cathode material was successfully coated with different amounts of (NH4)3AlF6 (1, 3, and 6 wt%) using a wet coating method. XRD analysis indicated that all samples had α-NaFeO2 layered rock-salt structure with R![[3 with combining macron]](https://www.rsc.org/images/entities/char_0033_0304.gif) m space group. Morphological characterization showed that the particle size of the pristine and coated samples were about 150–200 nm and that the thickness of the coating layer of the NC-3 material (3 wt% NAF) was ∼5 nm. The cycling and rate performances of the pristine LLNMO electrode were significantly enhanced after coating with NAF, especially for NC-3. The enhanced electrochemical performance was ascribed to the inhibition of unexpected surface side reactions by the protective layer of NAF, as well as the reduction of charge transfer resistance. Furthermore, the NC-3 sample exhibited enhanced cycling performance at elevated temperature owing to its improved thermal stability, as confirmed by the DSC results. This high electrochemical performance material represents a new insight for the next-generation of LIBs.
m space group. Morphological characterization showed that the particle size of the pristine and coated samples were about 150–200 nm and that the thickness of the coating layer of the NC-3 material (3 wt% NAF) was ∼5 nm. The cycling and rate performances of the pristine LLNMO electrode were significantly enhanced after coating with NAF, especially for NC-3. The enhanced electrochemical performance was ascribed to the inhibition of unexpected surface side reactions by the protective layer of NAF, as well as the reduction of charge transfer resistance. Furthermore, the NC-3 sample exhibited enhanced cycling performance at elevated temperature owing to its improved thermal stability, as confirmed by the DSC results. This high electrochemical performance material represents a new insight for the next-generation of LIBs.
Acknowledgements
This work was supported by the Chinese National 973 Program (2015CB251106), the National Natural Science Foundation of China (51302014), the Joint Funds of the National Natural Science Foundation of China (U1564206), Major achievements Transformation Project for Central University in Beijing and Beijing Science and Technology Project (D151100003015001).Notes and references
- J.-M. Tarascon and M. Armand, Nature, 2001, 414, 359–367 CrossRef CAS PubMed.
- V. Etacheri, R. Marom, R. Elazari, G. Salitra and D. Aurbach, Energy Environ. Sci., 2011, 4, 3243–3262 CAS.
- M. Armand and J.-M. Tarascon, Nature, 2008, 451, 652–657 CrossRef CAS PubMed.
- D. Larcher and J. M. Tarascon, Nat. Chem., 2015, 7, 19–29 CrossRef CAS PubMed.
- B. Dunn, H. Kamath and J. M. Tarascon, Science, 2011, 334, 928–935 CrossRef CAS PubMed.
- B. Song, W. Li, P. Yan, S. M. Oh, C. M. Wang and A. Manthiram, J. Power Sources, 2016, 325, 620–629 CrossRef CAS.
- J.-H. Kim and Y.-K. Sun, J. Power Sources, 2003, 119, 166–170 CrossRef.
- H. Yu and H. Zhou, J. Phys. Chem. Lett., 2013, 4, 1268–1280 CrossRef CAS PubMed.
- M. M. Thackeray, C. S. Johnson, J. T. Vaughey, N. Li and S. A. Hackney, J. Mater. Chem., 2005, 15, 2257–2267 RSC.
- M. M. Thackeray, S.-H. Kang, C. S. Johnson, J. T. Vaughey and S. A. Hackney, Electrochem. Commun., 2006, 8, 1531–1538 CrossRef CAS.
- J. Ma, Y.-N. Zhou, Y. Gao, X. Yu, Q. Kong, L. Gu, Z. Wang, X.-Q. Yang and L. Chen, Chem. Mater., 2014, 26, 3256–3262 CrossRef CAS.
- D. Kim, G. Sandi, J. R. Croy, K. G. Gallagher, S. H. Kang, E. Lee, M. D. Slater, C. S. Johnson and M. M. Thackeray, J. Electrochem. Soc., 2012, 160, A31–A38 CrossRef.
- C. S. Johnson, N. Li, C. Lefief, J. T. Vaughey and M. M. Thackeray, Chem. Mater., 2008, 20, 6095–6106 CrossRef CAS.
- J.-S. Kim, C. S. Johnson, J. T. Vaughey and M. M. Thackeray, Chem. Mater., 2004, 16, 1996–2006 CrossRef CAS.
- A. R. Armstrong, M. Holzapfel, P. Novak, C. S. Johnson, S.-H. Kang, M. M. Thackeray and P. G. Bruce, J. Am. Chem. Soc., 2006, 128, 8694–8698 CrossRef CAS PubMed.
- Y. J. Park, Y.-S. Hong, X. Wu, K. S. Ryu and S. H. Chang, J. Power Sources, 2004, 129, 288–295 CrossRef CAS.
- M. M. Thackeray, S.-H. Kang, C. S. Johnson, J. T. Vaughey, R. Benedek and S. A. Hackney, J. Mater. Chem., 2007, 17, 3112 RSC.
- N. Tran, L. Croguennec, M. Ménétrie, F. Weill, P. Biensan, C. Jordy and C. Delmas, Chem. Mater., 2008, 20, 4815–4825 CrossRef CAS.
- F. La Mantia, F. Rosciano, N. Tran and P. Novák, J. Electrochem. Soc., 2009, 156, A823 CrossRef CAS.
- L. Croguennec, J. Bains, J. Bréger, C. Tessier, P. Biensan, S. Levasseur and C. Delmas, J. Electrochem. Soc., 2011, 158, A664 CrossRef CAS.
- D. Wang, Y. Huang, Z. Huo and L. Chen, Electrochim. Acta, 2013, 107, 461–466 CrossRef CAS.
- Q. Li, G. Li, C. Fu, D. Luo, J. Fan and L. Li, ACS Appl. Mater. Interfaces, 2014, 6, 10330–10341 CAS.
- H. Li and L.-Z. Fan, Electrochim. Acta, 2013, 113, 407–411 CrossRef CAS.
- S. H. Kang, C. S. Johnson, J. T. Vaughey, K. Amine and M. M. Thackeray, J. Electrochem. Soc., 2006, 153, A1186 CrossRef CAS.
- S. H. Kang and M. M. Thackeray, J. Electrochem. Soc., 2008, 155, A269 CrossRef CAS.
- D. Y. W. Yu, K. Yanagida and H. Nakamura, J. Electrochem. Soc., 2010, 157, A1177 CrossRef CAS.
- M. Xu, Z. Chen, L. Li, H. Zhu, Q. Zhao, L. Xu, N. Peng and L. Gong, J. Power Sources, 2015, 281, 444–454 CrossRef CAS.
- B. Qiu, J. Wang, Y. Xia, Z. Wei, S. Han and Z. Liu, ACS Appl. Mater. Interfaces, 2014, 6, 9185–9193 CAS.
- S. J. Shi, J. P. Tu, Y. Y. Tang, X. Y. Liu, Y. Q. Zhang, X. L. Wang and C. D. Gu, Electrochim. Acta, 2013, 88, 671–679 CrossRef CAS.
- S. J. Shi, J. P. Tu, Y. J. Zhang, Y. D. Zhang, X. Y. Zhao, X. L. Wang and C. D. Gu, Electrochim. Acta, 2013, 108, 441–448 CrossRef CAS.
- C. Wang, F. Zhou, K. Chen, J. Kong, Y. Jiang, G. Yan, J. Li, C. Yu and W.-P. Tang, Electrochim. Acta, 2015, 176, 1171–1181 CrossRef CAS.
- F. Wu, X. Zhang, T. Zhao, L. Li, M. Xie and R. Chen, ACS Appl. Mater. Interfaces, 2015, 7, 3773–3781 CAS.
- Z. Wang, E. Liu, C. He, C. Shi, J. Li and N. Zhao, J. Power Sources, 2013, 236, 25–32 CrossRef CAS.
- S.-H. Kang and M. M. Thackeray, Electrochem. Commun., 2009, 11, 748–751 CrossRef CAS.
- Y. K. Sun, M. J. Lee, C. S. Yoon, J. Hassoun, K. Amine and B. Scrosati, Adv. Mater., 2012, 24, 1192–1196 CrossRef CAS PubMed.
- C. Lu, H. Wu, Y. Zhang, H. Liu, B. Chen, N. Wu and S. Wang, J. Power Sources, 2014, 267, 682–691 CrossRef CAS.
- J.-Z. Kong, C.-L. Wang, X. Qian, G.-A. Tai, A.-D. Li, D. Wu, H. Li, F. Zhou, C. Yu, Y. Sun, D. Jia and W.-P. Tang, Electrochim. Acta, 2015, 174, 542–550 CrossRef CAS.
- L.-N. Cong, X.-G. Gao, S.-C. Ma, X. Guo, Y.-P. Zeng, L.-H. Tai, R.-S. Wang, H.-M. Xie and L.-Q. Sun, Electrochim. Acta, 2014, 115, 399–406 CrossRef CAS.
- A. Boulineau, L. Simonin, J.-F. Colin, E. Canévet, L. Daniel and S. Patoux, Chem. Mater., 2012, 24, 3558–3566 CrossRef CAS.
- F. Wu, N. Li, Y. Su, H. Lu, L. Zhang, R. An, Z. Wang, L. Bao and S. Chen, J. Mater. Chem., 2012, 22, 1489–1497 RSC.
- F. Wu, N. Li, Y. Su, H. Shou, L. Bao, W. Yang, L. Zhang, R. An and S. Chen, Adv. Mater., 2013, 25, 3722–3726 CrossRef CAS PubMed.
- L. Zhang, B. Wu, N. Li, D. Mu, C. Zhang and F. Wu, J. Power Sources, 2013, 240, 644–652 CrossRef CAS.
- L. L. Zhang, J. J. Chen, S. Cheng and H. F. Xiang, Ceram. Int., 2016, 42, 1870–1878 CrossRef CAS.
- Y. Liu, Q. Wang, X. Wang, T. Wang, Y. Gao, M. Su and A. Dou, Ionics, 2015, 21, 2725–2733 CrossRef CAS.
- Y.-K. Sun, S.-T. Myung, C. S. Yoon and D.-W. Kim, Electrochem. Solid-State Lett., 2009, 12, A163 CrossRef CAS.
- G. Xu, J. Li, Q. Xue, Y. Dai, H. Zhou, X. Wang and F. Kang, Electrochim. Acta, 2014, 117, 41–47 CrossRef CAS.
- M. Chen, X. Xiang, D. Chen, Y. Liao, Q. Huang and W. Li, J. Power Sources, 2015, 279, 197–204 CrossRef CAS.
- C. S. Johnson, J.-S. Kim, C. Lefief, N. Li, J. T. Vaughey and M. M. Thackeray, Electrochem. Commun., 2004, 6, 1085–1091 CrossRef CAS.
- H. A. M. Abuzeid, A. M. A. Hashem, A. E. Abdel-Ghany, A. E. Eid, A. Mauger, H. Groult and C. M. Julien, J. Power Sources, 2011, 196, 6440–6448 CrossRef CAS.
- J. Li, R. Klöpsch, M. C. Stan, S. Nowak, M. Kunze, M. Winter and S. Passerini, J. Power Sources, 2011, 196, 4821–4825 CrossRef CAS.
- N. Tran, L. Croguennec, C. Labrugère, C. Jordy, P. Biensan and C. Delmas, J. Electrochem. Soc., 2006, 153, A261 CrossRef CAS.
- Y. Wu and A. Manthiram, J. Power Sources, 2008, 183, 749–754 CrossRef CAS.
- N. Yabuuchi, K. Yoshii, S. T. Myung, I. Nakai and S. Komaba, J. Am. Chem. Soc., 2011, 133, 4404–4419 CrossRef CAS PubMed.
- J. M. Zheng, Z. R. Zhang, X. B. Wu, Z. X. Dong, Z. Zhu and Y. Yang, J. Electrochem. Soc., 2008, 155, A775 CrossRef CAS.
- T. Cao, C. Shi, N. Zhao, C. He, J. Li and E. Liu, J. Phys. Chem. C, 2015, 119, 28749–28756 CAS.
| This journal is © The Royal Society of Chemistry 2017 |

