 Open Access Article
Double dimensionally ordered nanostructures: toward a multifunctional reinforcing nanohybrid for epoxy resin†
Ruhua Zhaa,
Ming Chena,
Tuo Shib,
Reddeppa Nadimicherlab,
Tongwu Jianga,
Zongwen Zhanga and
Min Zhang *c
*c
aCollege of Chemistry and Chemical Engineering, Xinyang Normal University, Xinyang 464000, P. R. China
bLaboratory of Solid State Ionics, School of Materials Science and Engineering, Huazhong University of Science and Technology, Wuhan 430074, P. R. China
cHenan Collaborative Innovation Center for Energy-Saving Building Materials, Xinyang Normal University, Xinyang 464000, P. R. China. E-mail: zm201177055@sina.com; Fax: +86-376-6370639; Tel: +86-376-6370639
First published on 4th January 2017
Abstract
Monodisperse 0D nano-TiO2, namely a ball cactus, with a BET surface area of 280 m2 g−1 and a pore volume of 1.0 cm3 g−1 was firstly synthesized by a solvothermal method. A double dimensionally ordered nanostructure filler system consisting of a 0D ball cactus and 2D layered MMT was constructed. The comprehensive performance of TiO2/MMT/EP nanocomposites was examined. The properties of the corresponding TiO2/MMT/EP nanocomposites, including mechanical properties, thermal stabilities, dielectric properties and surface free energies strongly depended on the loading of the double dimensional nanofillers. Our results demonstrate the potential of double dimensional synergism of 0D TiO2/2D MMT as a multifunctional reinforcement in polymeric composites. These results help to elucidate the complex interactions between nanostructures and polymer matrices, and flexible control over this multi-dimensional synergies concept could contribute to the development of adaptable structural materials for advanced applications.
1. Introduction
Titanium dioxide (TiO2), as a low cost and highly stable semiconductor oxide, has attracted increasing attention over the past decades. TiO2 is extensively utilized in diverse fields as core components for plastics, lithium-ion and perovskite solar cells, photocatalysis and catalyst supports, photochemical degradation of toxic chemicals.1–4 All these applications significantly depend on its crystal structure, crystallinity, morphology, specific surface area and particle size.5–7 The rise of nanotechnology provides a brand new methodology for high performance TiO2–polymer materials. The controllable synthesis of TiO2 with unusual morphologies and dimensions can endow the matrices with particular features and qualities. For example, TiO2–polystyrene (PS) nanoparticles synthesized by surface modification methods have been used for polymer hybrid thin films, which displayed very high transmittance in visible light because of the homodispersed TiO2 nanoparticles among the polymer matrix.8 Highly dispersed nano-TiO2–PMMA hybrids have been used to prepare polymer electrolyte membrane with high heat resistance and recyclability in advanced Li-ion battery industry.9 In addition, nanoporous TiO2 interconnected in conjugated polymers can be applied in solar cells.10Epoxy resin (EP), used at the forefront of many engineering applications, has attracted considerable attention over the past few decades and enters a variety of markets including coatings, adhesions, electronic devices, and aerospace,11–13 owing to its good mechanical properties and excellent durability to chemical corrosion.14–18 The demand for high performance epoxy resins is expected to grow in coming years. The structural composition is essentially important to enhance the properties of EP for advanced applications. However, the composition–structure–property relationship is still desired to figure out for the practical multifunctional applications of epoxy materials. In light of this issue, both the academic and industrial communities have been devoted to develop ideal additives.19–22 TiO2/EP nanocomposites have potential applications, particularly in organic photovoltaics, fire retardant composites, etc.23–26 As a result, much effort has been put into the fabrication of TiO2 nanotubes, nanowires, or shuttle-shape nanocrystals.27–29 In comparison, the fabrication of well-crystallized TiO2 remains a grand challenge. TiO2 with nanorods exhibit low density, big BET surface area and surface permeability.30 Among all these TiO2-based modifiers, which were just single dimensional, for example, 0D nanoparticles, 1D nanotubes, or 2D nanolayers, there were inevitable limitations. The single dimensional nanofillers cannot meet the rising demands for toughening materials. Two different nanofiller assemblies, intimately blended at the nanoscopic scale, have been reported for introducing reinforcements and generally have the superiorities of low energy-cost and consistency with standard industrial techniques.31 They also reduce or even eliminate the problem of agglomeration, often occurred when nanofillers are random scattered in a polymer matrix. The assembly of the second component not only improves its distribution effect, but it also introduces extra properties to the nanocomposites.32 Polymer based nanohybrids with synergies between the polymer chains and nanoparticles display peculiar mechanical, electrical performance and heat stability possess widespread applications in civil engineering, electronic devices, automobile machinery and aerospace.33–35 Obtaining a homogenous distribution of nanofillers among the polymer crossing network is the key issue for achieving good quality nanohybrids.36 Although functional modification is the commonly applied approach to enhance nanofiller distribution effect within the matrix backbone and to reinforce the mechanical performance,37,38 in most cases, it may lead to a structure disruption and a decrease in other properties, which is the least desirable for enhancing comprehensive properties. However, the construction of TiO2-based EP nanocomposites enhanced by multi-dimensionally ordered nanostructures has been rarely reported to date.
A flexible configuration of dimensionally different nanomaterials (such as zero-dimensional (0D) nanoparticles, one-dimensional (1D) nanowires, nanorods, and two-dimensional (2D) nanolayers) as building units having two or more scales ranging from the micro-/nano-scale to the macroscopic scale can contribute to the generation of multidimensional nanocomposites. Emerging multi-dimensional nanostructure materials provide peculiar chance to tailor govern the mechanical, thermal and electronic performance of polymer nanocomposites.39,40 The integration of low-dimensional nanomaterials with unique physical and chemical properties into a composite with hierarchical structures can endow full strengths of the component unit. This strategy has enabled the fabrication of multifunctional substance owing to attractive performances for special applications. Montmorillonite (MMT) is a typical 2D layered crystalline hydrated aluminosilicate mineral. The structural unit is a ‘sandwich structure’ and the interlayer spacing is about 2–3 nm, which can benefit the interlayer exchange, polymerization, absorption and catalysis.41–43 MMT-based nanocomposites have present ultrahigh mechanical reinforcement and high temperature durability due to the multiple noncovalent effects between the monodispersed MMT nanosheets and polymer chains.44,45 The optimal performance of MMT-based nanohybrids can be obtained by fine dispersed and highly exfoliated structures of nanofillers in the resin. Natural MMT is hydrophilic and incompatible with EP matrix, thus is normally considered unsuitable to host non-polar polymers without preliminary modification.46 The simple incorporation of MMT into EP can generally achieve increased tensile modulus, but reduced tensile strength and fracture strain often occurred, which was mostly due to the nonuniformity of MMT layers and the existence of imperfections.47 Kunigal and his coworkers employed a new dispersion approach, namely “high shear melt mixing process”, to prepare nonagglomerated-distributed EP–MMT nanocomposites.48 The observation revealed that the storage modulus (E′) was higher than that of the pristine EP with the MMT loading increased from 2 wt% to 7 wt%. However, the glass transition temperature (Tg) was decreased, which suggested that the MMT layers in EP–MMT system did not attain homogeneous dispersions, thus resulted in inadequate interaction between EP matrix and MMT layers, and the macromolecular segmental motion was not effectively hindered, hence the free volume among the polymer crossing networks increased and Tg decreased. The properties of EP have also been improved by incorporating other flexible, cross-linkable polymers to construct full- or semi-interpenetrating networks in polymer nanocomposites to optimize the EP matrix system. Unfortunately, most thermoplastic modification used in the epoxy system often comes at the expense of other desired properties. For example, the polyurethane (PUR)-modified EP/MMT system49 and the poly(methyl methacrylate) (PMMA)/EP/MMT ternary system50 typically had high stiffness and fracture toughness compared to most thermoset modifications. Nevertheless, there was a decrease in the thermal properties and Tg, mainly due to the decreased cross-linking density of the nanohybrids. The efficient and facile exfoliation of MMT is of significant importance in practice.
In this work, monodisperse 0D nano-TiO2, namely ball cactus, was synthesized by a solvothermal method. A double dimensionally ordered nanostructure filler system consisting of 0D TiO2 ball cactus and 2D layered MMT was obtained. The comprehensive performance of TiO2/MMT/EP nanocomposites co-reinforced by 0D mesoporous TiO2 ball cactus and 2D layered MMT nanoparticles was described. The morphology, mechanical, thermal, dielectric properties and the intercalate properties have been examined extensively. The purpose of this work is to clarify the multi-dimensionality behavior in matrix/nanoparticle interface and efficiently utilize the peculiar properties of these polymer nanocomposites. This concept is desired to contribute to the advanced applications of nanomaterials in polymer matrices.
2. Experimental section
2.1. Sample preparation
![[thin space (1/6-em)]](https://www.rsc.org/images/entities/char_2009.gif) 000 rpm for 30 min, and rinsed with distilled water and ethanol repeatedly and subsequent drying in electricity heat oven at 80 °C for 24 h and calcined in muffle furnace at 550 °C for 4 h.
000 rpm for 30 min, and rinsed with distilled water and ethanol repeatedly and subsequent drying in electricity heat oven at 80 °C for 24 h and calcined in muffle furnace at 550 °C for 4 h.![[thin space (1/6-em)]](https://www.rsc.org/images/entities/char_2009.gif) 000 rpm for 30 min, and washed by distilled water and ethanol repeatedly and subsequently dried in oven at 80 °C for 48 h.
000 rpm for 30 min, and washed by distilled water and ethanol repeatedly and subsequently dried in oven at 80 °C for 48 h.In the second step, 100 g of bisphenol-A type EP (E-51, molecular structure illustrated in Fig. S2†), 80 g methyl tetrahydrophthalic anhydride (MTHPA, Alfa Aesar), 1 g 2-ethyl-4-methylimidazole (Alfa Aesar, AR) and various amounts of TiO2/MMT mixtures were slowly fed into a 500 mL three-necked round bottomed flask and mechanically stirred for 1 h. These blends were completely mixed and mechanically stirred for 2 h and ultrasound dispersed evenly for 1 h and degassed in a vacuum oven to eliminate air bubbles. All the above operations are conducted at room temperature. The bubble-free viscous materials were slowly added to a aluminum mold to proceed the curing reaction: preliminary cured, further heating and post-cured. The curing condition was 90 °C/3 h, 150 °C/2 h and 180 °C/2 h, respectively. Finally, the aluminum molds were naturally cooled down.
For the need of XRD measurements, MMT/EP nanocomposites had also been prepared. The preparation process was the same as that of TiO2/MMT/epoxy nanohybrids.
2.2. Gel content of TiO2/MMT/epoxy nanohybrids
The gel fraction of the nanohybrids (50 × 10 × 1.0 mm3) was tested using CHCl3 as the extraction agent. The extraction reaction included continuous extraction with CHCl3 in a round bottom flask for 72 h or more until the sample weight was constant, according to the standard test method ASTM D2765-84.52,53 After the extraction, all the nanohybrids were dried and the gel content was calculated by the following formula (1):
 | (1) |
2.3. Characterizations and measurements
XRD characteristics were performed on a diffractometer (Philips PW 3050) using Cu-Kα monochromatic radiation. The Bragg's angle is set from 20 to 80°. The morphology characteristics of the nano-TiO2 ball cactus were conducted by SEM, Nova NanoSEM 450. The structure of the obtained nano ball cactus was identified by TEM via a JEOL 2100F device. Using a non-local density functional theory (NLDFT), the pore size distribution (PSD) was determined. The N2 adsorption data was used in the PSD calculation and a slit pore model was assumed. N2 adsorption and desorption isotherms were tested at −196 °C on ASAP 2020 micromeritics analyzer. The elementary composition of the samples was characterized by XPS on a VG MultiLab 2000 system. TGA analysis (NETZSCH Instruments High Resolution STA 409PC) was carried out in N2 at a flow rate of 70 mL min−1 with a heating rate of 20 °C min−1 and a scanning range of RT to 1000 °C. A DMA device was used to perform the mechanical property test of the samples. The samples were cut in the shape of 50 × 10 × 1.0 mm3 and tested in 3 point bending mode. The thermal transitions were measured in the temperature range of 20–200 °C at a heating rate of 4 °C min−1. The flexural and tensile tests were performed at room temperature using a microcomputer controlled electronic universal testing machine (CMT-4101, SANS Co. China) integrated with a force sensor (10 N/50 N). The reproducibility of the data was ensured by repeating the mechanical tests for at least five times using samples of 80.0 mm × 10.0 mm × 4.0 mm. At room temperature and according to Chinese standard of GB/T 1043-1993, the impact strength of the cured specimens was measured on a Pendulum Impact Testing Machine (Model ZBC from SHENZHENG SANS TESTING MACHINE Co. LTD). The response of the materials including maximum stress or fracture to the applied load was recorded for the average value of the 5 samples of each material group. Dielectric properties were measured at room temperature in air by two parallel plate modes at a frequence range of 103 Hz to 106 Hz by Precision Impedance Analyzer (Agilent 4294A). The size of the sample was ∼20 mm × 10 mm × 2 mm. In order to form a parallel plate capacitor, the sample was placed between the two copper electrodes. The measurement of the advancing contact angle of the sample was conducted at room temperature on a contact angle goniometer (Datephysics, OCA20) by injecting a 5 μL liquid drop and at least three droplets were dispensed at distinct regions of the same piece of the film, and at least two were used. Deionized water and n-hexadecane were utilized as benchmarks for the surface free energy measurement using a two-liquid geometric method.3. Results and discussion
3.1. Characterization of nano-TiO2 ball cactus
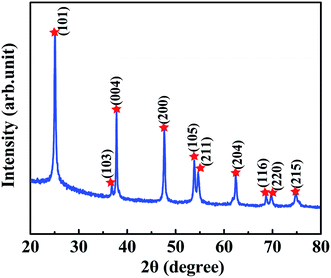
Before fabrication of TiO2/MMT/EP nanocomposites, we examined the crystal phase of the TiO2 ball cactuses. Fig. 1 reveals the small-angle XRD of the TiO2 ball cactuses. It was obvious that TiO2 ball cactuses was the anatase phase.As revealed in Fig. 2A–C, the TiO2 ball cactuses are monodisperse, ∼3 μm in diameter, and consisted of numerous regular and homogeneous nanothorns having a uniform diameter of 65 nm. The length of each nanothorn was 200–250 nm. The TEM image in Fig. 2C reveals that the ball cactuses are mainly composed of nanoparticles. They endow them with rough and porous surface. It was additionally demonstrated by the pore analysis of the TiO2 ball cactuses (Fig. 3). The HRTEM in Fig. 2D showed that the distance between each adjacent lattice fringe was about 0.35 nm. This value is just corresponding to the d spacing data of (101) planes for anatase TiO2.
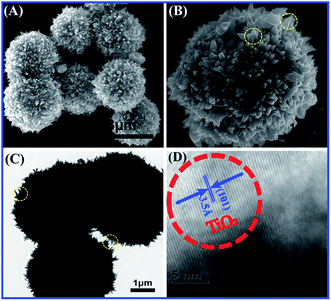 | ||
| Fig. 2 (A) SEM image of the TiO2 ball cactus, (B) magnified view of the surface, (C) TEM image of nanothorns and (D) high resolution TEM image of ball cactus. | ||
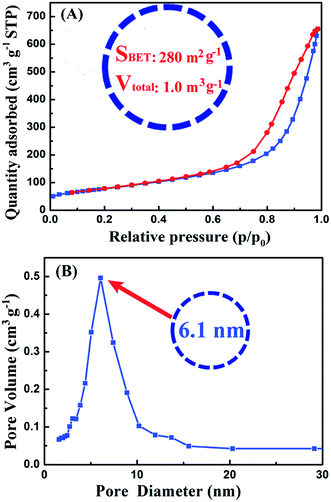 | ||
| Fig. 3 (A) Nitrogen adsorption–desorption isotherms and (B) corresponding pore size distributions of nano-TiO2 ball cactus. | ||
Fig. 3 showed the BET curves of nano-TiO2 ball cactus. It reveals N2 adsorption–desorption isotherms and the pore size distributions. The ball cactus show type II isotherms with a noticeable hysteresis loop (Fig. 3A), indicating the presence of mesoporous structure of nano-TiO2 ball cactus. The pore size distribution then demonstrated that the ball cactus possessed a uniform mesopore diameter of 6.1 nm (Fig. 3B). Their BET surface area (SBET) is found to be 280 m2 g−1 and their total pore volume (Vtotal) is 1.0 m3 g−1. It is known that the diameter of every bisphenol-A type EP monomer molecule (E-51) is at the Angstrom meter scale (10−10 m) size, which is smaller than that of the nano-TiO2 ball cactus. Thus, the mesopore size determined using the BJH method is expected to be sufficiently large for EP molecular chains to breezily run through the internal mesoporous gaps. The uniform mesopores and the narrow pore size distribution are attributed to the interstitial space between uniform-sized nano-TiO2 ball cactus.
Fig. 4 depicts the XPS spectra of the TiO2 ball cactus samples. Fig. 4A reveals the full spectrum of ball cactus. It can be seen that the O 1s and Ti 2p peaks were situated at the binding energies at 529 and 459 eV, respectively, and the Ti LMM and O KLL Auger peaks were also acquired at binding energies of 1106 and 975 eV, respectively. Fig. 4B reveals the Ti 2p core level spectrum, which consists of two obvious Ti 2p1/2 and Ti 2p3/2 photopeaks with the binding energies of 464.5 and 458.7 eV, respectively, which was in line with the studies from Siemensmeyer and Schultze.54 The binding energy at 458.7 eV is evident, being indicative of the presence of Ti4+. In addition, the XPS spectrum of O 1s is also made up of three major peaks (Fig. 4C), and the first strong peak situated at a low binding energy of 529.7 eV is assigned to the bulk oxygen bonded with titanium (Ti–O), while the second shoulder peak at 531.5 eV belongs to the surface hydroxyl groups (Ti–OH). Furthermore, the broader shoulder peak at 533.5 eV was assigned to oxygen from H2O in the TiO2 sample.55
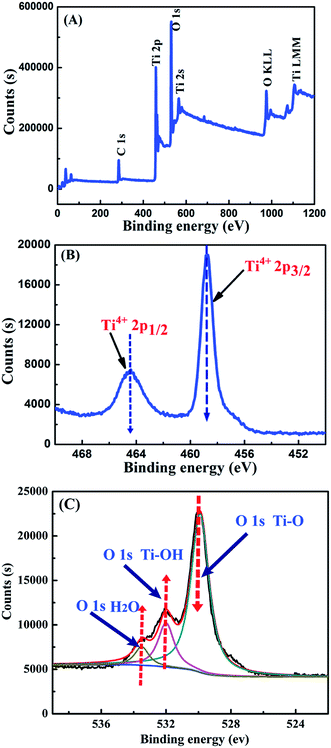 | ||
| Fig. 4 XPS spectra of nano-TiO2 ball cactus. (A) Wide-survey spectrum, (B) Ti 2p core level and (C) O 1s core level. | ||
3.2. Characterization of TiO2/MMT/EP nanocomposites
To investigate the interactions of 0D TiO2 ball cactus and 2D layered MMT confined within the intramolecular space of epoxy resin, the small angle XRD (SAXRD) patterns of TiO2/MMT/EP nanocomposites were obtained in the range of 2θ from 2–10°, in which the layered structure information and the interlamellar distance of MMT can be reflected56 (Fig. 5B–F). Based on the SAXRD results, the exfoliation degree of MMT can be evaluated by the interlamellar spacing of MMT calculated using the following Bragg equation: nλ = 2d![[thin space (1/6-em)]](https://www.rsc.org/images/entities/char_2009.gif) sin
sin![[thin space (1/6-em)]](https://www.rsc.org/images/entities/char_2009.gif) θ, where λ is the wavelength (λ = 1.5418 × 10⁻¹⁰ m) of the incidence X-ray, n is the series of diffraction (n = 1), θ is the incident angle, and d is the interlamellar spacing of MMT. For the sake of comparison, the SAXRD pattern of pure MMT was also examined under the same conditions (Fig. 5A). The diffraction peak at 2θ = 5.82° in Fig. 5A can be assigned to the interlayer structures of MMT.57 The XRD data indicated that the d-spacing of MMT is 1.52 nm which is calculated from the peak position using the Bragg equation. The XRD patterns of TiO2/MMT/EP nanocomposites changed significantly. TiO2/MMT/EP nanocomposites at filler concentrations of 2, 4, 5, 6 phr even gave no diffraction peak in 2θ range (Fig. 5B–D), pointing out the uniformly dispersed delaminated single MMT layers in the epoxy matrix. The diffraction peak and corresponding d-spacing of MMT and TiO2/MMT/EP nanocomposites are listed in Table 1. When the amount of 0D TiO2/2D MMT increased to 8 phr, small shoulder was appeared at 2θ = 2.07°, which was in line with the d-spacing of 4.26 nm (Fig. 5F). This implied that 2D MMT in TiO2/MMT/EP nanocomposites cannot be exfoliated and existed in the form of an intercalated layered structure.
θ, where λ is the wavelength (λ = 1.5418 × 10⁻¹⁰ m) of the incidence X-ray, n is the series of diffraction (n = 1), θ is the incident angle, and d is the interlamellar spacing of MMT. For the sake of comparison, the SAXRD pattern of pure MMT was also examined under the same conditions (Fig. 5A). The diffraction peak at 2θ = 5.82° in Fig. 5A can be assigned to the interlayer structures of MMT.57 The XRD data indicated that the d-spacing of MMT is 1.52 nm which is calculated from the peak position using the Bragg equation. The XRD patterns of TiO2/MMT/EP nanocomposites changed significantly. TiO2/MMT/EP nanocomposites at filler concentrations of 2, 4, 5, 6 phr even gave no diffraction peak in 2θ range (Fig. 5B–D), pointing out the uniformly dispersed delaminated single MMT layers in the epoxy matrix. The diffraction peak and corresponding d-spacing of MMT and TiO2/MMT/EP nanocomposites are listed in Table 1. When the amount of 0D TiO2/2D MMT increased to 8 phr, small shoulder was appeared at 2θ = 2.07°, which was in line with the d-spacing of 4.26 nm (Fig. 5F). This implied that 2D MMT in TiO2/MMT/EP nanocomposites cannot be exfoliated and existed in the form of an intercalated layered structure.
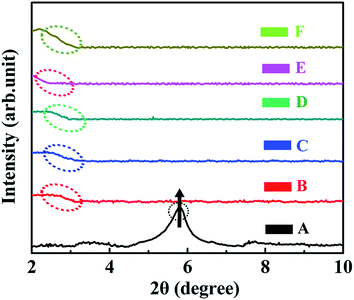 | ||
| Fig. 5 XRD patterns of pure MMT (A) and TiO2/MMT/EP nanocomposites at filler concentrations of 2 (B), 4 (C), 5 (D), 6 (E) and 8 phr (F), respectively. | ||
| Sample | 2θ (°) | Interlayer space (nm) | |
|---|---|---|---|
| MMT | 5.82 | 1.52 | |
| TiO2/MMT/EP nanocomposites | 2 phr | None | >4.26 |
| 4 phr | None | >4.26 | |
| 5 phr | None | >4.26 | |
| 6 phr | None | >4.26 | |
| 8 phr | 2.07 | 4.26 |
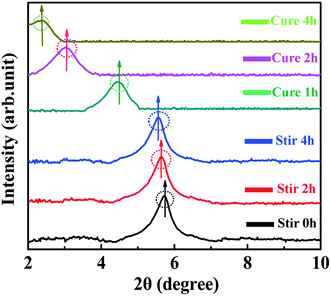
For comparing and analyzing the interaction behaviors between 0D TiO2 ball cactus and 2D layered MMT, the XRD patterns of MMT/EP (Fig. 6) and TiO2/MMT/EP nanocomposites (Fig. 7) were collected. As can be seen in Fig. 6, in the mixing stage of MMT/EP nanocomposites, the layered structure of MMT does not change even it was mechanically stirred for 4 h. However, as the curing reaction proceeds, the diffraction peak is shifted to a lower value and become broadened. When the curing time was 1, 2 and 4 h, the diffraction peak of the corresponding products was 4.45, 3.02 and 2.35, respectively. The corresponding d-spacing is 1.98, 2.93 and 3.75 nm, respectively. The XRD patterns confirmed that the intercalation of MMT in the MMT/EP system occurred mainly in the curing stage. Nevertheless, the MMT still could not be fully exfoliated even when the curing reaction was completed.
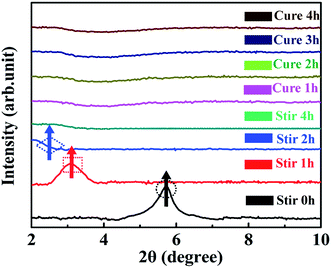
In the XRD patterns of TiO2/MMT/EP nanocomposites (Fig. 7), it was clear that the diffraction peak was slightly splitted and shifted to a lower value as the mixing time extension. Additionally, the peak height was gradually decreased. When the sample was stirred for 4 h, the diffraction peak entirely disappeared and did not show any change after the cure reaction was completed. These features indicated that the 2D layered MMT in the TiO2/MMT/EP system could be fully exfoliated into individual layers during the mixing process.
Compared with the intercalation behavior of MMT in the TiO2/MMT/EP system, in the absence of the 0D TiO2 nanoparticles as the second filler, the layered structure of 2D MMT layers in the MMT/EP system eventually cannot be completely exfoliated. The elastic force exerted by cross-linked EP molecules inside the MMT galleries are found responsible for exfoliation of MMT layers from the intercalated tactoids.58 However, the elastic force is not strong enough to thoroughly exfoliate the 2D MMT layers into individual MMT lamellae.
XRD results regarding the degree of intercalation are verified by TEM micrographs. TEM results of pure EP and TiO2/MMT/EP nanohybrids are depicted in Fig. 8. Fig. 8A shows the nanostructure of pure epoxy. Fig. 8B shows the nanostructure of TiO2/MMT/EP nanocomposites at filler concentration of 2 phr. It can be observed that dark lines are present with a sheet thickness of about 1 nm, which correspond to MMT lamellar structure. The black shadows correspond to nano TiO2. For the 0D TiO2 nanoparticles, the size of the nanostructures has been decreased. Hence, the black dots look much smaller than that of the former that exists on its own. The gray areas represent the epoxy matrix. This is direct evidence that MMT layers have been delaminated into epoxy matrix. At filler concentration of 4 phr, MMT lamellae are also present and black dots (nano TiO2) are far away from each other (Fig. 8C). At filler concentration of 5 phr, the interlayer spacing of exfoliated MMT lamellae increases. Notably, the individual MMT lamellae (1 nm thick) and nano TiO2 are displayed in a staggered and homogeneously dispersed distribution in epoxy matrix (Fig. 8D). At higher filler concentrations (6, 8 phr), a partial of nano TiO2 have been agglomerated (Fig. 8E and F). The interlayer spacing of MMT decreases to about 3–4 nm (Fig. 8F). Therefore, these TEM micrographs are consistent with the XRD data. Interlayer spacing of MMT decreases to about 3–4 nm (Fig. 8F).
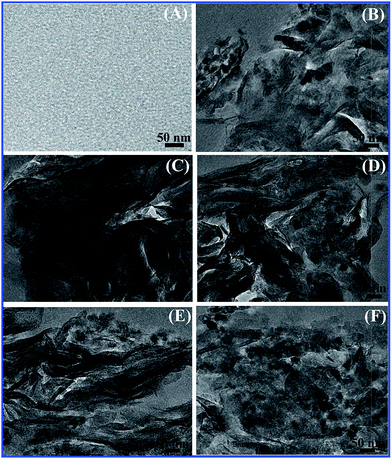 | ||
| Fig. 8 TEM images of pure epoxy (A) and TiO2/MMT/EP nanocomposites at filler concentrations of 2 (B), 4 (C), 5 (D), 6 (E) and 8 phr (F), respectively. | ||
In summary, based on the analysis of the above XRD and the TEM data, we argue that the exfoliation behavior of 2D layered MMT in the TiO2/MMT/EP system was entirely different from that in the MMT/EP system, which was caused by the integration of 0D TiO2 ball cactus. There are mainly two reasons for the structural transformation of 2D MMT and 0D TiO2 nanoparticles. The first one derives from the external high shearing forces produced by high energy ultrasonic stirring and high-speed centrifugation.59 The 2D layered MMT and the 0D TiO2 nanoparticles possess different geometrical shapes, thus they display different movement behaviors. Moreover, they bear different loading and give strong adhesion under high shear stress. Finally, the 2D MMT layers are exfoliated into individual MMT lamellae and the 0D TiO2 nanoparticles are changed in their magnitude and the length scale during the frequently occurred mutual contact and detachment among the rigid interacting particle–particle interfaces. The second reason derives from the internal nanoscale forces of TiO2/MMT/EP itself. It has been proved that there are nanoscale forces surrounding the nanoscopic components.60 That is, as the in situ polymerization of EP monomer and TiO2/MMT fillers proceeds, the gradual increase of the conformational entropy for the crosslinked molecules system triggers the structure transformation of EP matrix, 2D MMT and 0D TiO2. The interparticle forces between 0D TiO2 and 2D layered MMT, confined within the intramolecular space of EP resin, are strengthened when they close to each other as a result of the continually increased crosslinking density of the TiO2/MMT/EP nanocomposites. When the interparticle interaction forces are strong enough because of the greatly shortened interparticle distances during the heat curing reaction, the cross-linked EP molecules inside the MMT galleries exert elastic force to exfoliate the 2D MMT layers into individual MMT lamellae from the intercalated tactoids, and the 0D TiO2 nanoparticles are eventually fractured into small fragments.
3.3. Mechanical properties
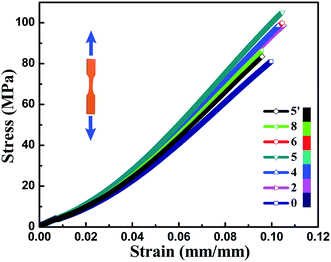
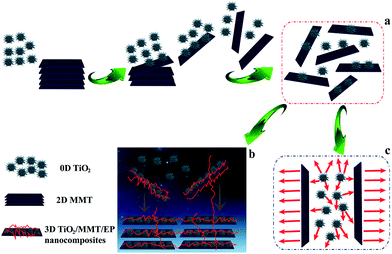
Mechanical properties of neat EP and TiO2/MMT/EP nanocomposites are determined from the respective tensile, flexural and impact resistance measurements. The corresponding stress–strain results of all the nanocomposites are depicted in Fig. 9, and the specific tensile properties are listed in Table S2.† The value for averaged tensile strength for TiO2/MMT/EP nanocomposites at the TiO2/MMT concentration of 2 phr (85.74 MPa), 4 phr (97.42 MPa), 5 phr (98.84 MPa), 6 phr (93.38 MPa), and 8 phr (76.62 MPa) samples are remarkably improved by 112.23, 142.13, 144.65, 131.14, and 89.65%, respectively, which was compared with neat EP (40.40 MPa). The averaged Young's modulus of TiO2/MMT/EP nanocomposites at the TiO2/MMT concentration of 2 phr (2.97 GPa), 4 phr (3.06 GPa), 5 phr (3.36 GPa), 6 phr (3.00 GPa) and 8 phr (2.96 GPa) are higher than that of the neat EP (0.50 GPa). The tensile strength and Young's modulus was significantly raised when nano-TiO2 ball cactus and MMT were introduced into the EP matrix. The elongation at break of TiO2/MMT/EP nanocomposites at the TiO2/MMT concentration of 2 phr (10.28%), 4 phr (10.44%), 5 phr (10.52%), and 6 phr (10.46%) are higher than that of the neat EP (9.98%). It was noted that the 5 phr of TiO2/MMT based nanocomposites system displayed the optimum tensile strength and tensile modulus values, which were raised by 572% and 144%, respectively when compared to those of pure EP. By comparison, the values for averaged tensile strength, tensile modulus and the elongation at break for MMT/EP nanocomposites at the MMT concentration of 5 phr are 79.32 MPa, 2.54 GPa and 11.19%, respectively. Obviously, the TiO2/MMT/EP nanocomposite at the TiO2/MMT concentration of 5 phr has a better tensile performance than that of the MMT/EP nanocomposite at the MMT concentration of 5 phr, indicating the 0D TiO2/2D MMT synergistic reinforcement in EP matrix.There were two principal reasons as illustrated in Scheme 1. The first one was ascribed to the surface hydroxyl groups of monodisperse nano-TiO2 ball cactus and their high specific surface area, which benefited the interfacial interaction between 0D TiO2 filler and EP matrix (Scheme 1b). Furthermore, the 2D layered MMT as the second filler could provide synergistic reinforcement interactions and additional regulatory effects, which meant that these double dimensionally different nanoscale particles formed efficient stiff particle–matrix interfacial layer and thus increased crosslink density of the EP network due to their percolated structure. The 2D layered MMT and 0D TiO2 fillers, which were well dispersed in the surrounding EP matrix could hinder the entanglement problem of each component and thus make them more scattered as illustrated in Scheme 1b. It can lead to a better dispersion effect and increased tensile strength. Additionally, the synergistic interactions could resist the tensile stress that is perpendicular and parallel to the layered plane of MMT, Scheme 1c, respectively. The tensile strength and tensile modulus of the nanocomposites were decreased when the concentration of TiO2/MMT was high (6 phr, 8 phr). It was mainly attributed to the irregular arrangement of the TiO2/MMT nanofillers among the EP matrix.
It could be correlated with the SEM analysis of the tensile fracture morphology observations (Fig. 10). At the micrometer scale, the neat EP exhibited a smooth, glossy microstructure without any plastic deformation, Fig. 10A. In Fig. 10B–F, it was clearly indicated that the surface roughness increased with random orientation especially at higher loadings (6, 8 phr) of TiO2/MMT into the EP matrix and exhibited irregular dispersion. In the amplified picture of the fracture surface of (2, 4 phr) TiO2/MMT/EP nanocomposites, Fig. 10B and C, the 0D TiO2 are found to be linked to each other, and its high surface area is good for the highly cross-linked molecule network within the 2D MMT. It is apparent that the (5 phr) TiO2/MMT/EP nanocomposites, Fig. 10D, displayed rugged scallops and ductile fracture characteristics. Additionally, the 2D MMT could be pulled out with EP linked to the 0D TiO2, showing an efficient contact and interfacial interaction among the macromolecular crossing networks.43,44 All the 0D TiO2 nanoparticles are uniformly spreaded within EP matrix and there is no entanglement, further showing the proposed double dimensionally ordered nanofiller reinforcing mechanism as illustrated in Scheme 1b. Thus, it could be concluded that the 5 phr of TiO2/MMT based nanocomposites system showed good compatibility and had proper distribution of 0D TiO2 and 2D MMT.
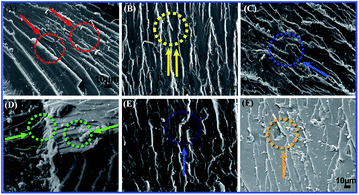 | ||
| Fig. 10 SEM micrographs showing tensile fracture morphology of neat EP (A) and TiO2/MMT reinforced nanocomposites at filler concentrations of 2 (B), 4 (C), 5 (D), 6 (E) and 8 phr (F), respectively. | ||
The flexural properties neat EP and TiO2/MMT/EP nanocomposites are shown in Fig. 11. It was clearly indicated that the flexural strength as well as the flexural modulus were greatly increased when the nano-TiO2 ball cactus and MMT were introduced into the EP matrix. It was attributed to the strong particle–matrix interactions between the rigid double dimensionally different nanoscale particles and EP, which were capable of carrying and withstanding any part of the external forces. TiO2/MMT/EP nanocomposites imparted a high portion of interface. As presented in the inset in Fig. 11, the values for averaged flexural strength and flexural modulus of MMT/EP nanocomposites at the MMT concentration of 5 phr are 209.3 MPa and 8.9 GPa, respectively, which are lower than that of the TiO2/MMT/EP nanocomposite at the TiO2/MMT concentration of 5 phr. These results demonstrate that the 2D layered MMT as the second filler can provide synergistic reinforcement interaction between the rigid 0D TiO2/2D MMT particles and the EP matrix. It was well known that the effect of the interfacial adhesion among the nanocomposites generally played an essential action in transfer stress ability of the materials.61,62 The hydroxyl groups on the nano-TiO2 ball cactus surface ensured well filler–polymer bonding, which can facilitate the stress transfer properties of the nanocomposites system. A lot of external and internal energy could be offseted at the nanoparticle/polymer interface. The gradual increase in flexural strength as well as the flexural modulus revealed that external stresses were efficiently transferred via the interface. In the same way corresponded a high interfacial stiffness at fillers concentration of 5 phr to the high composite modulus. It was noted that when the concentration of the fillers was 5 phr, the flexural modulus and flexural strength were increased by 163% and 181%, respectively compared to those of neat EP. However, when the concentration exceeded 5 phr, the failure strain underwent a mild drop. The decline proposed that a lot of fillers at the moment dominated, and they reduced the deformation within the polymer networks by hindering forces mechanically, which was evidenced by the difference among their SEM micrographs of flexural fracture morphologies.
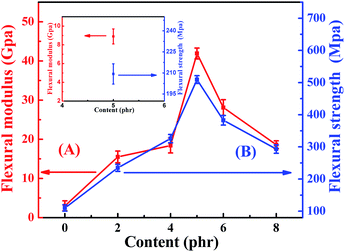 | ||
| Fig. 11 Flexural modulus (A) and flexural strength (B) of neat EP and TiO2/MMT reinforced nanocomposites at filler concentrations of 2, 4, 5, 6 and 8 phr, respectively. | ||
Fig. 12 shows the fracture surfaces for the neat EP matrix and TiO2/MMT/EP nanocomposites. Fig. 12A displays a brittle characteristic characterized by vast smooth surfaces, hyperbolic lines, as well as the fracture bands along the crack propagation direction. In contrary to the neat EP, the fracture surfaces of TiO2/MMT/EP nanocomposites are rougher (Fig. 12B–F). Fig. 12B distinctly displays lots of hyperbolic lines spitting via the crack propagation. The above micro-rough structure could be due to matrix shear yielding within the rigid nanofillers. The surface of (5 phr) TiO2/MMT/EP nanocomposite exhibits the highest roughness (Fig. 12D). It was extensively rugged, which meant that cracks moved quickly, allowing little polymer deformation as the yielding process was more quickly.
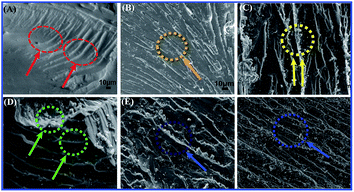 | ||
| Fig. 12 SEM micrographs showing flexural fracture morphology of neat EP (A) and TiO2/MMT reinforced nanocomposites at filler concentrations of 2 (B), 4 (C), 5 (D), 6 (E) and 8 phr (F), respectively. | ||
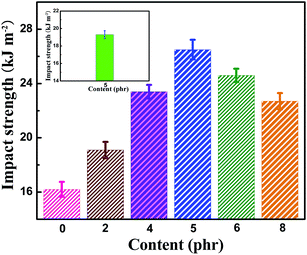
The dependence of the impact strength of neat EP and TiO2/MMT/EP nanocomposites on fillers content is shown in Fig. 13. The reinforcing effect was obvious even at low filler loading (2 phr) and achieved the highest level found for 5 phr TiO2/MMT, which was increased by 51.8% compared to that of neat EP. At higher contents (6 phr, 8 phr), the impact strength decreased gradually. However, they remained superior impact strength over the neat EP and no unexpectedly decrease was noticed. This result can be interpreted as crack pinning and crack tip blunting. On one hand, propagating cracks can be hindered by stiff 0D TiO2 nanoparticles. When the propagating crack comes across TiO2 nanoparticles, it is momentarily restrained and crowded out among these nanoparticles, forming secondary cracks.63,64 Additionally, crack tip blunting often come up because of the localized shear yielding and damage zones of the interface of MMT/EP and fracture of 2D MMT nanoparticles. The exfoliated MMT lamellae act as stress centers as they possess different elastic characteristics over the neat EP. When the local stress surpasses the yield stress of neat EP, the shear yielding of the MMT/matrix interface will occur. Therefore, the TiO2/MMT/EP nanocomposite is capable of consuming large amounts of energy upon fracture. As shown in the inset in Fig. 13, the impact strength of the MMT/EP nanocomposite at the MMT concentration of 5 phr is 19.3 kJ m−2. It is lower than that of the TiO2/MMT/EP nanocomposite at the TiO2/MMT concentration of 5 phr. All the above results fully indicate the existence of the synergies between 0D TiO2 ball cactuses and 2D MMT lamellae in EP matrix.
SEM of the impact fracture surface was explored to illustrate the fracture toughening behavior in TiO2/MMT/EP nanocomposites. With the addition of the double dimensional nanofillers, rougher and random fracture surfaces are generated (Fig. 14B–F). A large number of river-shaped crazings and dimples appear in the surface of impact fracture for TiO2/MMT/EP nanocomposites. It is probably due to the blocking actions and crack pinning of 0D mesoporous TiO2 nanoparticles and 2D layered MMT nanoparticles in the EP crosslinking system.62,65 Additionally, vast river-shaped lines are crooked, which are good for the fracture toughness by discharging the extra tension within the crack fronts. This phenomena is owing to the stiff 0D mesoporous TiO2 nanoparticle filler and layered 2D MMT nanoparticles, which prompted the EP matrix to generate lots of plastic deformation and consume large fracture energy. Oppositely, the neat EP shows totally smooth surface (Fig. 14A) and a typical brittle fracture. It indicates the hindering effect of crack transfer is fairly low.
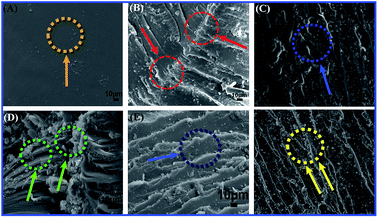 | ||
| Fig. 14 SEM micrographs showing impact fracture morphology of neat EP (A) and TiO2/MMT reinforced nanocomposites at filler concentrations of 2 (B), 4 (C), 5 (D), 6 (E) and 8 phr (F), respectively. | ||
Our 0D TiO2/2D MMT-inspired nanocomposite is prepared by heat curing of E-51, nano-TiO2 ball cactus and layered MMT nanoclay platelets, which stack in a well-ordered layered structure to form a crosslinking system (Scheme 1). Kinds of other techniques to generate forceful TiO2 and/or MMT-reinforced materials have been conceived.66–68 Nevertheless, our approach has the superiority of not only offering peculiar domination of the nanostructure, but also of being facile, facilitating scale-up and large manufacturing. Scheme 1 illustrates the possible structure and 3D networks of TiO2/MMT/EP nanocomposites. These basic building blocks are linked by the double dimensionally ordered fillers to form a highly cross-linked network. The fine nano-TiO2 ball cactus can be availably implanted into the gaps between layered MMT and EP matrix. In addition to the heat curing reaction of EP resin, the cross-linking reaction between EP and 0D TiO2/2D MMT nanoparticles could additionally be involved in the case. The functional hydroxyl groups on the surface of the nano-TiO2 ball cactus enable interface designs that improve the interfacial strength in the resultant nanocomposites. Additionally, the 2D MMT can strengthen the crosslinking density by their layered nanosheets. The synergistic interfacial interaction is one important approach for constructing integrated TiO2/MMT/EP 3D networks. Several typical interfacial interactions in the synergistic building blocks include hydrogen bonding, ionic bonding, branched polymers, linear molecules and polymers, and three-dimensional (3D) thermosetting resin networks. The roughness on the surface of 0D TiO2 and 2D MMT nanoparticles will also result in an enhanced mechanical interlocking with the EP and, consequently, in better adhesion. Thus, the TiO2/MMT/EP nanocomposites with below 5 phr TiO2/MMT, in which the layered MMT lamellae are totally homogeneously distributed among the EP matrix, are toughened and strengthened simultaneously. This indicates that TiO2/MMT nanohybrids can possess high bending energy that could keep out strong energy from all directions before yield generates. We emphasize that such double dimensionally ordered nanostructure filler marks an perfect model system for exploring synergistic reinforcement effects on polymer mechanics in usual.
3.4. Dynamic mechanical analysis
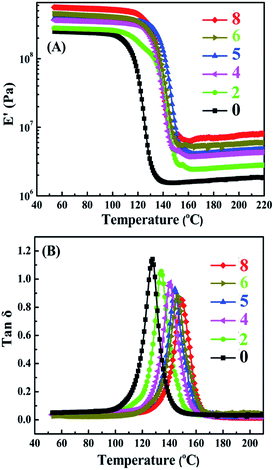
DMA is a high-efficient strategy for the characterization of interfaces and allows exploring glass transitions or secondary transitions and yield signals on the structure of nanocomposites. The typical DMA thermograms of neat EP and TiO2/MMT/EP nanocomposites are depicted in Fig. 15. The storage modulus (E′) for all nanocomposites went up to a higher value relative to the neat EP when the nanofiller loading increased (Fig. 15A). For neat EP the value was 349 MPa, and this value gradually increased to 378, 393, 563, 452, 365 MPa for TiO2/MMT/EP nanocomposites at the loading of 2, 4, 5, 6, 8 phr, respectively. Additionally, the modulus decreased as the temperature boosting, but retained a higher stiffness than the EP as the temperature exceeded 150 °C. The increase in E′ can be attributed to the full exfoliation of 2D MMT layers in TiO2/MMT/EP nanocomposites. Each exfoliated MMT lamella with nano TiO2 surroundings was just like extremely large and rigid crosslinking plane, which was equivalent to increase the amount of cross-links for the epoxy matrix. The interpenetrated fillers of the 0D TiO2 and the 2D layered MMT into the cross-linked epoxy networks led to increased crosslinking density and strong stiffening effect on the epoxy matrix. This is a strong advantage of TiO2/MMT/EP nanocomposites compared with the neat EP. It was because that it could retain the high modulus even when the temperature exceeded the glass transition temperature (Tg).As shown in Fig. 15B, as nanofillers increased, the Tg peak of TiO2/MMT/EP tended to change to slightly higher values compared with the neat EP (128.9 °C) while the damping peak decreased. It was ascribed that firstly the double dimensionally different nanoparticles play significant action in the hindering effect of heat conduction. The vertical heat transfer can be effectively retarded owing to the great length–diameter ratio of 2D MMT. Meanwhile, the heat convection & conduction can be restrained by 0D TiO2 ball cactus in all directions including the horizontal direction. Secondly, under ultrasonic radiation, the MMT and TiO2 ball cactus catalyze the polymerization of EP in the stirring process and thus alter the cured network systems. The confinement and the decline in the mobile range of molecule segments of polymer occurs as a result of the intercalation of 0D TiO2 and 2D MMT into the crosslinking networks of epoxy matrix.
3.5. Thermo gravimetric analysis
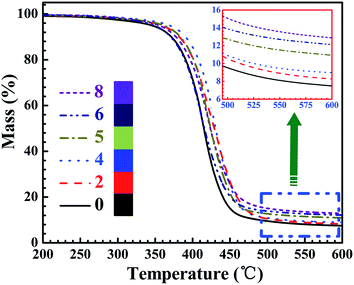
Thermal stability of the neat EP and TiO2/MMT/EP nanocomposites was investigated using TGA. The results are displayed in Fig. 16 and the specific parameters are listed in Table 2. As shown in Fig. 16, it was apparently shown that all the TGA curves had just a degradation stage. When the temperature was <250 °C, all the samples revealed the similar thermal behavior and the weight loss could be nearly ignored. The weight decrease occurred mainly over 250 °C and was completed below 600 °C. The degradation temperature for T5% of the cured systems decreased with increasing mixed fillers loading (0–5 phr), and for neat EP the T5% was 345.4 °C, for TiO2/MMT/EP nanocomposites at the loading of 5 phr the T5% increased to 368.3 °C. T10% and Tmax showed the same tendency. When the temperature was ranging from 300 °C to 500 °C, all samples displayed a quick thermal degradation. As shown in Table 1, it also led to an increase in residual weight. The char yields at 600 °C for the cured samples also increased as the mixed fillers loading increase, the char yield of neat EP was 7.5%, whereas the value for TiO2/MMT/EP nanocomposites at the loading of 8 phr was increased to 12.9%. It was indicated that the thermal stability of the TiO2/MMT/EP systems was enhanced with the importing of the mixed fillers. Each exfoliated MMT lamella with nano TiO2 surroundings was just like extremely large and rigid crosslinking plane, which was equivalent to increase the amount of cross-links for the epoxy matrix. The better dispersion of the hybrid fillers would contribute to the more strong synergistic effect. It is well known that the chemical structure and the crosslinking density play important roles in controlling the heat endurance of the thermosets. Generally a higher crosslinking density of crosslinking networks contributes to higher heat endurance. The enhanced behavior for the TiO2/MMT/EP nanocomposites is attributed to the existence of 0D TiO2 and the exfoliated 2D layered MMT and the forceful interaction between the EP macromolecule segments and uniform nano TiO2 ball cactus, which increased the crosslinking density and inhibited the molecular mobility of polymer chains.| Samples | T5%a (°C) | T10%b (°C) | Tmaxc (°C) | Ycd (%) |
|---|---|---|---|---|
| a The temperature for 5% weight loss.b The temperature for 10% weight loss.c Maximum weight loss temperature.d Char yields at 600 °C. | ||||
| 0 | 345.4 | 371.5 | 414.4 | 7.5 |
| 2 | 358.3 | 382.1 | 416.8 | 8.3 |
| 4 | 361.8 | 383.4 | 423.6 | 9.0 |
| 5 | 368.3 | 390.6 | 425.2 | 10.9 |
| 6 | 355.6 | 377.7 | 420.8 | 12.1 |
| 8 | 348.7 | 370.8 | 417.6 | 12.9 |
3.6. Dielectric behavior
The effect of 0D TiO2 and 2D layered MMT on the formation of the conductive pathway and the dielectric properties of TiO2/MMT/EP nanocomposites were examined at 103 Hz to 106 Hz as a function of the filler loading of neat and TiO2/MMT/EP nanocomposites (Fig. 17). It was noted that the incorporation of 0D TiO2 and 2D layered MMT into the EP matrix increased the dielectric constant (ε) values. The ε for TiO2/MMT/EP nanocomposites were increased as the filler loading increased to 5 phr. The ε of neat EP was 3.26 at 1 kHz, whereas the ε of TiO2/MMT/EP systems with filler loading of 2, 4, 5 phr were 3.36, 3.58, 3.90, respectively. The dielectric loss of neat EP matrix was 0.010, and the dielectric loss of EP nanocomposites with the filler loading of 2, 4, 5 phr were 0.024, 0.031, 0.041, respectively. These results were probably due to the rising interfacial areas and crosslinking density generated by the hybrid fillers of 0D TiO2 and 2D layered MMT during the formation of nanocomposites. When the filler loading was larger than 5 phr, the dielectric constant of the nanocomposite showed a decreased value. This phenomenon may be related to the phase inversion.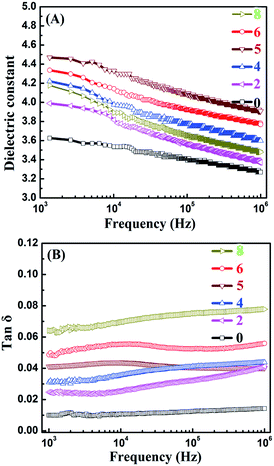 | ||
| Fig. 17 Frequency dependence of dielectric constants (A) and dielectric loss (B) of neat EP and reinforced nanocomposites. | ||
3.7. Contact angle and surface free energy
For the sake of reinforcing the modulus without the sacrifice of the low surface energy of the TiO2/MMT/EP nanohybrids, it was anticipated to be best to introduce the double dimensionally different 0D TiO2/2D MMT fillers into the EP macromonomer. In that case, the cross-linking density was raised, contributing to an improved modulus. Surface tensions of the neat and TiO2/MMT/EP nanocomposites were determined using the Owens–Wendt–Kaelble method (OWK):69
 | (2) |
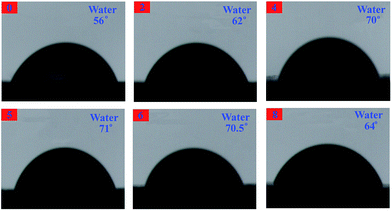
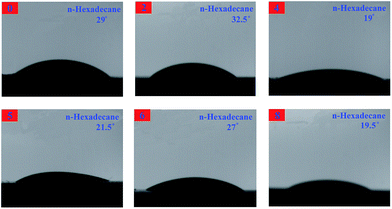
The contact angles are measured with water and n-hexadecane as probe liquids (Fig. 18 and 19), and the details are listed in Table 3. The advancing contact angle of the neat EP was estimated with water to be ca. 56°. Upon adding 0D TiO2/2D MMT to the system, the water advancing contact angle for the organic–inorganic nanocomposites was increased as the TiO2/MMT loading in EP matrix increased. As shown in Table 3, the surface free energies calculated from the difference in the advancing angles of the TiO2/MMT/EP nanocomposites were lower than that of neat EP (46.59 mJ m−2). This observation indicated that when the 0D TiO2/2D MMT was incorporated into organic polymers, the surface hydrophobicity of the nanocomposites will be improved. The TiO2/MMT/EP nanocomposites were therefore more hydrophobic than the neat EP. Inorganic nanoparticle–polymer nanocomposites have found great potential in the fabrication of superhydrophobic surfaces.70 It is well confirmed that nanostructures and morphologies on surfaces play a significant action in controlling the hydrophobicity of nanohybrids. In TiO2/MMT/EP system, there were homogeneously dispersed distribution of exfoliated MMT individual layers and nano TiO2 within the EP matrix, which were investigated by SEM and TEM results. These formed double dimensionally ordered nanostructures contain air-traps.71 In this state, the air layer can be trapped among the ordered nanostructures, which can firmly prevent water droplets from intruding into the surface microstructures and thus give rise to a very slippery, high-hydrophobic surface. Because of the own merits of lower surface tension, the greater durability of these TiO2/MMT/EP nanohybrids would be a superiority compared with the common approaches and their high modulus makes them beneficial for physical damage resistance in long-term water borne tasks.
| Samples | Contact angle [°] | Surface free energy [mJ m−2] | |
|---|---|---|---|
| H2O | C16H34 | ||
| 0 | 56 | 29 | 46.59 |
| 2 | 62 | 32.5 | 42.10 |
| 4 | 70 | 19 | 38.70 |
| 5 | 71 | 21.5 | 37.55 |
| 6 | 70.5 | 27 | 37.58 |
| 8 | 64 | 19.5 | 42.00 |
4. Conclusions
We proposed a double dimensionally ordered nanostructure filler system consisting of 0D mesoporous TiO2 ball cactus nanoparticles and 2D layered MMT nanoparticles to fabricate TiO2/MMT/EP nanohybrids with enhanced comprehensive performance due to the synergies between 0D TiO2 and 2D MMT. From the systematic study, it was clarified that the synthesized mesoporous TiO2 ball cactus embedded in the space among the layered MMT nanoparticles played a significant action in raising comprehensive performance. The configuration of TiO2 ball cactus and MMT into EP demonstrated their ability to synergistically improve the tensile, flexural and impact properties at low filler contents (∼2 phr). Moreover, the nanoreinforcements produced a significant enhancement on the heat endurance and char yield of the nanocomposites system. Thus the TiO2/MMT/EP nanocomposites reinforced with optimized double dimensional fillers loadings possessed better mechanical, thermal and thermal mechanical properties than neat EP. Thus the TiO2/MMT/EP nanohybrids fabricated in our work could be studied for a high performance and advanced industrial applications that demand excellent durability. Our concept reported here teach lessons for kinds of polymers and also will be a key approach to establish a more ingenious multi-dimensional filler system toward outstanding nanocomposites.Acknowledgements
This work was supported by the Henan Key Scientific Research Project (16A430026 and 17A150048).Notes and references
- K. Hu, K. C. Robson, P. G. Johansson, C. P. Berlinguette and G. J. Meyer, J. Am. Chem. Soc., 2012, 134, 8352–8355 CrossRef CAS PubMed.
- A. Musumeci, D. Gosztola, T. Schiller, N. M. Dimitrijevic, V. Mujica, D. Martin and T. Rajh, J. Am. Chem. Soc., 2009, 131, 6040–6041 CrossRef CAS PubMed.
- B. Y. Xia, Y. Yan, X. Wang and X. W. Lou, Mater. Horiz., 2014, 1, 379–399 RSC.
- A. Mei, X. Li, L. Liu, Z. Ku, T. Liu, Y. Rong, M. Xu, M. Hu, J. Chen, Y. Yang, M. Grätzel and H. Han, Science, 2014, 345, 295–298 CrossRef CAS PubMed.
- X. Chen and S. Mao, J. Nanosci. Nanotechnol., 2006, 6, 906–925 CrossRef CAS PubMed.
- P. Tao, Y. Li, A. Rungta, A. Viswanath, J. Gao, B. C. Benicewicz, R. W. Siegel and L. S. Schadler, J. Mater. Chem., 2011, 21, 18623–18629 RSC.
- A. M. Díez-Pascual and A. L. Díez-Vicente, ACS Appl. Mater. Interfaces, 2015, 7, 5561–5573 Search PubMed.
- R. Matsuno, H. Otsuka and A. Takahara, Soft Matter, 2006, 2, 415–421 RSC.
- H. Choi, H. Cho, S. Song, H. Suh, S. Park and J. Y. Kim, Phys. Chem. Chem. Phys., 2010, 12, 15309–15314 RSC.
- S. Zhang, J. Cao, Y. Shang, L. Wang, X. He, J. Li, P. Zhao and Y. Wang, J. Mater. Chem. A, 2015, 3, 17697–17703 CAS.
- H. Gu, J. Guo, H. Wei, S. Guo, J. Liu, Y. Huang, M. A. Khan, X. Wang, D. P. Young and S. Wei, Adv. Mater., 2015, 27, 6277–6282 CrossRef CAS PubMed.
- J. H. Lee, L. Wang, S. Kooi, M. C. Boyce and E. L. Thomas, Nano Lett., 2010, 10, 2592–2597 CrossRef CAS PubMed.
- V. N. Mochalin, I. Neitzel, B. J. Etzold and A. Peterson, ACS Nano, 2011, 5, 7494–7502 CrossRef CAS PubMed.
- T. J. Trentler, J. E. Boyd and V. L. Colvin, Chem. Mater., 2000, 12, 1431–1438 CrossRef CAS.
- Y. Martinez-Rubi, B. Ashrafi, J. Guan, C. Kingston, A. Johnston, B. Simard, V. Mirjalili, P. Hubert, L. Deng and R. J. Young, ACS Appl. Mater. Interfaces, 2011, 3, 2309–2317 CAS.
- L. Chen, S. Chai, K. Liu, N. Ning, J. Gao, Q. Liu, F. Chen and Q. Fu, ACS Appl. Mater. Interfaces, 2012, 4, 4398–4404 CAS.
- F. Liu and K. Guo, Polym. Adv. Technol., 2014, 25, 418–423 CrossRef CAS.
- F. Hu, L. Jiang, M. Cao, Z. Xu, J. Huang, D. Wu, W. Yang, W. Yang, S. H. Liu and J. Yin, RSC Adv., 2014, 5, 5982–5987 RSC.
- X. S. Wang, H. K. Kim, Y. Fujita, A. Sudo, H. Nishida and T. Endo, Macromolecules, 2006, 39, 1046–1052 CrossRef CAS.
- S. Ma, X. Liu, Y. Jiang, Z. Tang, C. Zhang and J. Zhu, Green Chem., 2013, 15, 245–254 RSC.
- B. De and N. Karak, J. Mater. Chem. A, 2013, 1, 348–353 CAS.
- P. P. Vijayan, D. Puglia, J. M. Kenny and S. Thomas, Soft Matter, 2013, 9, 2899–2911 RSC.
- J. Zhu, J. Kim, H. Peng, J. L. Margrave, V. N. Khabashesku and E. V. Barrera, Nano Lett., 2003, 3, 1107–1113 CrossRef CAS.
- G. Williams, B. Seger and P. V. Kamat, ACS Nano, 2008, 2, 1487–1491 CrossRef CAS PubMed.
- V. Tsyalkovsky, V. Klep, K. Ramaratnam, R. Lupitskyy, S. Minko and I. Luzinov, Chem. Mater., 2007, 20, 317–325 CrossRef.
- F. De Angelis, C. Di Valentin, S. Fantacci, A. Vittadini and A. Selloni, Chem. Rev., 2014, 114, 9708–9753 CrossRef CAS PubMed.
- I. Paramasivam, H. Jha, N. Liu and P. Schmuki, Small, 2012, 8, 3073–3103 CrossRef CAS PubMed.
- Y. J. Hwang, C. Hahn, B. Liu and P. Yang, ACS Nano, 2012, 6, 5060–5069 CrossRef CAS PubMed.
- J. Pan, G. Liu, G. Q. M. Lu and H. M. Cheng, Angew. Chem., Int. Ed., 2011, 50, 2133–2137 CrossRef CAS PubMed.
- N. Ning, S. Fu, W. Zhang, F. Chen, K. Wang, H. Deng, Q. Zhang and Q. Fu, Prog. Polym. Sci., 2012, 37, 1425–1455 CrossRef CAS.
- Z. Li, Z. Liu, H. Sun and C. Gao, Chem. Rev., 2015, 115, 7046–7117 CrossRef CAS PubMed.
- H. Gu, J. Guo, H. Wei, S. Guo, J. Liu, Y. Huang, M. A. Khan, X. Wang, D. P. Young and S. Wei, Adv. Mater., 2015, 27, 6277–6282 CrossRef CAS PubMed.
- E. Ionescu, H. J. Kleebe and R. Riedel, Chem. Soc. Rev., 2012, 41, 5032–5052 RSC.
- H. Dong, P. Ye, M. Zhong, J. Pietrasik, R. Drumright and K. Matyjaszewski, Langmuir, 2010, 26, 15567–15573 CrossRef CAS PubMed.
- O. Eksik, J. Gao, S. A. Shojaee, A. Thomas, P. Chow, S. F. Bartolucci, D. A. Lucca and N. Koratkar, ACS Nano, 2014, 8, 5282–5289 CrossRef CAS PubMed.
- C. Sanchez, P. Belleville, M. Popall and L. Nicole, Chem. Soc. Rev., 2011, 40, 696–753 RSC.
- A. de los Santos Pereira, N. Y. Kostina, M. Bruns, C. Rodriguez-Emmenegger and C. Barner-Kowollik, Langmuir, 2015, 31, 5899–5907 CrossRef CAS PubMed.
- C. F. Hansell, P. Espeel, M. M. Stamenovic, I. A. Barker, A. P. Dove, F. E. Du Prez and R. K. O'Reilly, J. Am. Chem. Soc., 2011, 133, 13828–13831 CrossRef CAS PubMed.
- H. Yao, H. Fang, X. Wang and H. Yu, Chem. Soc. Rev., 2011, 40, 3764–3785 RSC.
- M. Zhao, Q. Zhang, J. Huang and F. Wei, Adv. Funct. Mater., 2012, 22, 675–694 CrossRef CAS.
- S. S. Gupta and K. G. Bhattacharyya, Phys. Chem. Chem. Phys., 2012, 14, 6698–6723 RSC.
- B. Chen, J. R. Evans, H. C. Greenwell, P. Boulet, P. V. Coveney, A. A. Bowden and A. Whiting, Chem. Soc. Rev., 2008, 37, 568–594 RSC.
- Q. Zeng, D. Wang, A. Yu and G. Lu, Nanotechnology, 2002, 13, 549–553 CrossRef CAS.
- G. Keledi, J. Hári and B. Pukánszky, Nanoscale, 2012, 4, 1919–1938 RSC.
- X. Liu and X. Lu, Angew. Chem., Int. Ed., 2006, 45, 6300–6303 CrossRef CAS PubMed.
- B. Chen, J. R. G. Evans, H. C. Greenwell, P. Boulet, P. V. Coveney, A. A. Bowden and A. Whiting, Chem. Soc. Rev., 2008, 37, 568–594 RSC.
- K. Wang, L. Chen, J. Wu, M. L. Toh, C. He and A. F. Yee, Macromolecules, 2005, 38, 788–800 CrossRef CAS.
- N. M. Renukappa, R. Chikkakuntappa and N. S. Kunigal, Polym. Eng. Sci., 2011, 51, 1827–1836 Search PubMed.
- M. Bakar, M. Kostrzewa, B. Hausnerova and K. Sar, Adv. Polym. Technol., 2010, 29, 237–248 CrossRef CAS.
- M. Hernandez, J. Dupuy, J. Duchet and H. Sautereau, e-Polym., 2007, 7, 1176–1186 Search PubMed.
- H. G. Yang, G. Liu, S. Z. Qiao, C. H. Sun, Y. G. Jin, S. C. Smith, J. Zou, H. M. Cheng and G. Q. Lu, J. Am. Chem. Soc., 2009, 131, 4078–4083 CrossRef CAS PubMed.
- M. Sangermano, E. Amerio, P. Epicoco, A. Priola, G. Rizza and G. Malucelli, Macromol. Mater. Eng., 2007, 292, 634–640 CrossRef CAS.
- G. Pan, Z. Du, C. Zhang, C. Li, X. Yang and H. Li, Polymer, 2007, 48, 3686–3693 CrossRef CAS.
- B. Siemensmeyer and J. Schultze, Surf. Interface Anal., 1990, 16, 309–314 CrossRef CAS.
- Z. Song, J. Hrbek and R. Osgood, Nano Lett., 2005, 5, 1327–1332 CrossRef CAS PubMed.
- J. E. Martin, A. J. Patil, M. F. Butler and S. Mann, Adv. Funct. Mater., 2011, 21, 674–681 CrossRef CAS.
- T. Takeichi, R. Zeidam and T. Agag, Polymer, 2002, 43, 45–53 CrossRef CAS.
- J. H. Park and S. C. Jana, Macromolecules, 2003, 36, 2758–2768 CrossRef CAS.
- N. Domun, H. Hadavinia, T. Zhang, T. Sainsbury, G. H. Liaghat and S. Vahid, Nanoscale, 2015, 7, 10294–10329 RSC.
- K. J. M. Bishop, C. E. Wilmer, S. Soh and B. A. Grzybowski, Small, 2009, 5, 1600–1630 CrossRef CAS PubMed.
- Z. Niu, J. He, T. P. Russell and Q. Wang, Angew. Chem., Int. Ed., 2010, 49, 10052–10066 CrossRef CAS PubMed.
- M. Zammarano, P. H. Maupin, L. P. Sung, J. W. Gilman, E. D. McCarthy, Y. S. Kim and D. M. Fox, ACS Nano, 2011, 5, 3391–3399 CrossRef CAS PubMed.
- W. Liu, S. V. Hoa and M. Pugh, Compos. Sci. Technol., 2005, 65, 307–316 CrossRef CAS.
- D. Ratna, O. Becker, R. Krishnamurthy, G. P. Simon and R. J. Varley, Polymer, 2003, 44, 7449–7457 CrossRef CAS.
- D. A. Norman and R. E. Robertson, Polymer, 2003, 44, 2351–2362 CrossRef CAS.
- F. De Angelis, C. Di Valentin, S. Fantacci, A. Vittadini and A. Selloni, Chem. Rev., 2014, 114, 9708–9753 CrossRef CAS PubMed.
- A. M. Díez-Pascual and A. L. Díez-Vicente, ACS Appl. Mater. Interfaces, 2015, 7, 5561–5573 Search PubMed.
- O. Eksik, J. Gao, S. A. Shojaee, A. Thomas, P. Chow, S. F. Bartolucci, D. A. Lucca and N. Koratkar, ACS Nano, 2014, 8, 5282–5289 CrossRef CAS PubMed.
- Z. Hu, L. M. Pitet, M. A. Hillmyer and J. M. DeSimone, Macromolecules, 2010, 43, 10397–10405 CrossRef CAS.
- A. Ghazizadeh, S. A. Haddadi and M. Mahdavian, RSC Adv., 2016, 6, 18996–19006 RSC.
- E. Zhang, Y. Wang, T. Lv, L. Li, Z. Cheng and Y. Liu, Nanoscale, 2015, 7, 6151–6158 RSC.
Footnote |
| † Electronic supplementary information (ESI) available. See DOI: 10.1039/c6ra26365h |
| This journal is © The Royal Society of Chemistry 2017 |

