 Open Access Article
Creative Commons Attribution 3.0 Unported Licence
A highly sensitive metronidazole sensor based on a Pt nanospheres/polyfurfural film modified electrode
Jianzhi Huanga,
Xiaolei Shena,
Ruili Wanga,
Qiang Zeng*ab and
Lishi Wang*a
aSchool of Chemistry and Chemical Engineering, South China University of Technology, Guangzhou 510641, People's Republic of China. E-mail: ceqzeng@scut.edu.cn; wanglsh@scut.edu.cn; Tel: +86 20 87112906
bState Key Laboratory of Pulp and Paper Engineering, South China University of Technology, Guangzhou 510641, People's Republic of China
First published on 3rd January 2017
Abstract
In this contribution, we combine the advantages of both Pt nanospheres and polyfurfural film and successfully develop a novel Pt nanospheres/polyfurfural film modified glassy carbon electrode (GCE) for electrochemical sensing of a nitro group containing pentatomic cyclic compound, metronidazole. In particular, the polyfurfural film and Pt nanospheres were handily obtained by a one-step electropolymerization method and a potential step method, respectively. Benefiting from their excellent synergistic catalytical properties, the Pt nanospheres/polyfurfural film/GCE shows significantly enhanced electrocatalytic activity towards metronidazole. A series of experimental parameters including the electropolymerization cycles of furfural, the deposition time of platinum, accumulation time, accumulation potential and pH of the supporting electrolyte for metronidazole was also investigated and optimized. The proposed sensor exhibited excellent selectivity, stability and reproducibility for the determination of metronidazole, providing a wide linear detection range from 2.5 to 500 μmol dm−3 and a low detection limit of 50 nmol dm−3 (S/N = 3) under optimal experimental conditions. When the proposed sensor was applied to determine metronidazole in real human serum samples, it gave a satisfactory result.
1. Introduction
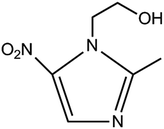
Metronidazole, 1-(2-hydroxyethyl)-2-methyl-5-nitroimidazole (Chart 1), is the most important nitroimidazole derivative and is well-known for its anti-microbial properties.1,2 Because it is effective against anaerobic bacteria, trichomonas, amoeba and giardia, nowadays it has been extensively used for the treatment of anaerobic bacterial diseases3,4 and protozoal diseases such as trichomoniasis,5 amoebiasis6,7 and giardiasis.8 However, metronidazole can be genotoxic and carcinogenic when the accumulated dose of metronidazole exceeds a 2 g daily dosage in human beings,9–11 presenting with some toxic reactions like seizures,12 peripheral neuropathy,13 optic neuropcathy14 and cerebellar ataxia.15 Therefore, it is significantly important and necessary to develop a highly sensitive and rapid method for the determination of metronidazole.Several techniques such as high performance liquid chromatography,16,17 gas chromatography,18 supercritical fluid chromatography,19 ultraviolet spectrophotometry,20 fluorescence spectrophotometry,21 capillary electrophoresis22 have been used for the detection and quantification of metronidazole, but high cost and time-consuming experimental processes limit their extensive application. In contrast with these methods, electrochemical method features high sensitivity, simplicity of operation, low cost and short analysis time. Therefore, sensors based on different chemically modified electrodes have been developed for the quantitative determination of metronidazole and achieved success.23–33
Polymer-modified electrodes have attracted great attention in sensing applications.34–41 In particular, the strategy of electropolymerization is to immobilize a polymer film onto an electrode surface with multiple active sites and advantages of rapid synthesis, controllable film thickness, flexible charge transport and permeation characteristics by easily adjusting the electrochemical parameters.42,43 Previously, we have successfully prepared a polyfurfural film modified glassy carbon electrode (GCE) by a one-step electropolymerization method, which exhibits excellent electrocatalytical activity to the reduction of the nitro group in hexatomic aromatic compounds44,45 due to the promoted electron transfer by the conjugated π-electron backbones of polyfurfural film.44–46 Herein, we seek the possibility of the polyfurfural film for the catalytical reduction of the nitro group in a pentatomic cyclic compound of metronidazole. In order to improve the catalytical activity and sensitivity of the polyfurfural film modified electrode, a potential step method47 was also used to prepare Pt nanospheres on the surface of the polyfurfural film, resulting in a proposed metronidazole sensor based on a Pt nanospheres/polyfurfural film modified GCE. With the excellent catalytical contributions of both Pt nanospheres and polyfurfural film, the Pt nanospheres/polyfurfural film/GCE shows superior electrocatalytical activity towards the nitro group in metronidazole. In contrast with the published electrochemical sensors, the proposed electrochemical sensor possesses a wider detection linear range and a lower detection limit for metronidazole, which successfully used in the quantitative determination of metronidazole in real human serum samples with a good performance. It is also highly sensitive, stable and reproducible for the proposed sensor. This developed technique would thus have an enormous meaning to pharmaceutical and biological analysis.
2. Experimental
2.1 Reagents
Metronidazole (99%, analytical grade) was purchased from Macklin Biochemical Co. Ltd. (Shanghai, China). Chloroplatinic acid hexahydrate (99.9%, analytical grade) was purchased from J&K Chemical (Beijing, China). Furfural (GC, 98%) was obtained from TCI Company. Sodium perchlorate and acetonitrile were obtained from Fuchen Chemical Reagent Company (Tianjin, China). Normal human serum samples were received from Huayueyang Biotechnology Co. Ltd (Beijing, China). All other reagents were of analytical grade and used without further purification. Britton–Robinson (BR) buffer solutions was prepared by mixing 0.04 mol dm−3 of boric acid, phosphoric acid and acetic acid, and then adjusted to the required pH value with 0.2 mol dm−3 of NaOH solution. All aqueous solutions were prepared with doubly distilled water.2.2 Fabrication of Pt nanospheres/polyfurfural film/GCE
Before the fabrication of the polyfurfural film, a bare glassy carbon electrode (GCE, 3 mm diameter) was firstly polished with 0.3 μm alumina powders, and then successively polished with 0.05 μm alumina powders. After polishing, the bare GCE was rinsed ultrasonically with absolute alcohol and doubly distilled water, and then dried in the nitrogen stream. As reported previously,44–46 the electropolymerization of furfural was performed in acetonitrile containing furfural (0.01 mol dm−3) and sodium perchlorate (0.06 mol dm−3) by cyclic voltammetry at a scan rate of 100 mV s−1 between −0.8 V and +2.8 V for 6 cycles. After electropolymerization, the polyfurfural film modified glassy carbon electrode was rinsed with water to remove all physically adsorbed chemicals.As followed, a potential step method47 was employed to obtain Pt nanospheres in 0.5 mmol dm−3 H2PtCl6 solution containing 0.25 mol dm−3 H2SO4, where potential stepped repeatedly between 0.23 V and 0.60 V at 100 Hz for 450 s. These conditions allow proper amount of monodispersed Pt nanospheres to be formed without the overlapping effect of diffusion layer between Pt nuclei. The preparation of Pt nanospheres/polyfurfural film/GCE electrochemical sensor is concluded as Scheme 1.
2.3 Apparatus and method
Cyclic voltammetry (CV), electrochemical impedance spectroscopy (EIS) and differential pulse voltammetry (DPV) experiments were performed on a CHI 660D electrochemical workstation (Chenhua, Shanghai, China), a three-electrode configuration was used in all electrochemical experiments. In the process of electropolymerization, a bare GCE as the working electrode, a silver wire electrode as the reference electrode and a platinum wire as the counter electrode were used. While the Pt nanospheres/polyfurfural film/GCE working electrode and the saturated calomel reference electrode (SCE) were applied instead in the process of determination. The differential pulse voltammetry scans from −0.4 V to −1.0 V with an amplitude of 0.05 V, pulse width was 0.2 s, pulse period was 0.5 s, sampling width was 0.0167, increment was 0.004 V. For cyclic voltammetry, scan rate was 50 mV s−1, sample interval was 0.001 V. Electrochemical impedance spectroscopy was obtained in 5 mmol dm−3 of K3[Fe(CN)6]/K4[Fe(CN)6] solution containing 0.1 mol dm−3 of KCl under open circuit potential with a frequency range from 0.1 Hz to 100 kHz and 50 mV amplitude. The electrochemical experiment parameters were same in all experiments. The surface morphology was characterized using a field emission scanning electron microscope (FE-SEM; Zeiss Ultra55, Germany). The working solution was deaerated with N2 for 15 min prior to data acquisition during the experiments.For the determination of metronidazole, the detection limit, Cm, was obtained using equation eqn (1):
| Cm = 3Sb/m | (1) |
3. Results and discussion
3.1 Characterization of Pt nanospheres/polyfurfural film modified glassy carbon electrode
By contrast to a bare GCE (Fig. 1A), the SEM image of the polyfurfural film modified GCE shows a clear view of the polymer layer with a rough surface (Fig. 1B). After further modification, well dispersed Pt nanospheres are observed on the polymer surface and display uniform morphology and size distribution (Fig. 1C and D). For the high magnification SEM image of Pt nanospheres in Fig. 1E, the diameter of a Pt nanosphere is about 250 nm, showing a rough surface which makes Pt nanosphere possess a large surface area.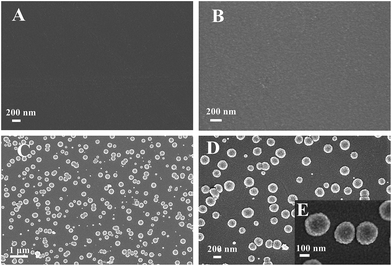 | ||
| Fig. 1 SEM images of (A) bare GCE, (B) polyfurfural film/GCE, (C) and (D) Pt nanospheres/polyfurfural film/GCE, (E) the high magnification SEM image of the Pt nanospheres/polyfurfural film/GCE. | ||
Fig. 2A shows the cyclic voltammograms of different electrodes in 5.0 mmol dm−3 [Fe(CN)6]3−/4− solution containing 0.1 mol dm−3 KCl. The redox-label [Fe(CN)6]3−/4− displayed a reversible CV curve at the bare GCE (curve a). As seen from curve b, the cathodic and anodic peak currents were decreased obviously with a larger peak-to-peak separation (ΔEp) when polyfurfural film was formed onto the surface of the bare GCE, suggesting that polyfurfural film hinders the electron transfer. Further modification of Pt nanospheres onto the surface of the polyfurfural film/GCE (curve c) results in the recovery of the cathodic and anodic peak currents and ΔEp, indicating that the Pt nanospheres can improve the electron transfer rate due to their excellent conductivity. Moreover, the EIS plots obtained after each modification process (Fig. 2B) are in accordance with the results concluded by CV and provide the confirmation that polyfurfural film and Pt nanospheres have been successfully modified on the electrode surface stepwise.
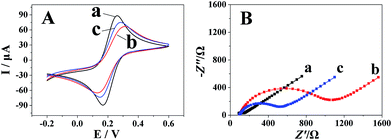 | ||
| Fig. 2 (A) CVs and (B) EIS of (a) bare GCE, (b) polyfurfural film/GCE and (c) Pt nanospheres/polyfurfural film/GCE in 5.0 mM [Fe(CN)6]3−/4− containing 0.1 M KCl. | ||
3.2 Electrochemical behavior of metronidazole at the Pt nanospheres/polyfurfural film/GCE
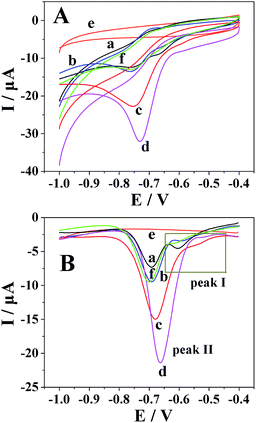
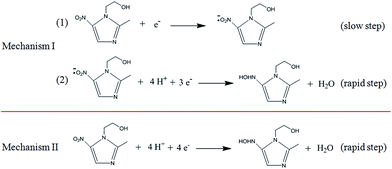
By cyclic voltammetry, the reduction of metronidazole was irreversible (Fig. 3A). In particular, two obvious reduction peaks were observed on a bare GCE (curve a), but only one reduction process was respectively observed on the Pt nanospheres/GCE (curve b), the bare platinum electrode (curve f), the polyfurfural film/GCE (curve c) and the Pt nanospheres/polyfurfural film/GCE (curve d), indicating two different reaction mechanisms. Comparing to the bare GCE, the electrodes respectively modified with Pt nanospheres, polyfurfural film and Pt nanospheres/polyfurfural film show a gradual increase on the reduction peak current of metronidazole due to the enhanced catalytical activities towards metronidazole. Interestingly, the current increase resulted by the polyfurfural film is more significant than that by Pt nanospheres. Therefore, this observation suggests that polyfurfural film plays the most important role in the catalytical reduction of metronidazole in this system.In order to better explain the electrocatalytical reaction mechanism, differential pulse voltammetry was employed in the following studies, possessing highly sensitive. As reported previously,23,33,48–51 the electrochemical reduction of metronidazole undergoes two possible reaction mechanisms (Scheme 2), the metronidazole molecules are initially adsorbed at the electrode surface and then reduced by two possible reaction mechanisms, where the –NO2 group is initially reduced to –NO2˙− (I-1) and then to –NHOH (I-2) in the first mechanism and the –NO2 group is directly converted to –NHOH (II) in the second mechanism, respectively.
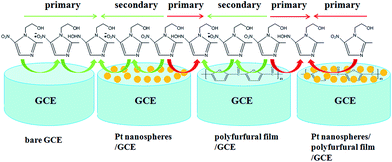
As shown in Fig. 3B, two obvious reduction peaks were observed on the bare GCE at −0.604 V and −0.696 V, respectively (curve a), indicating that the reduction processes of metronidazole mainly follow the first mechanism.23,33 By contrast, two reduction peaks were still observed on the Pt nanospheres/GCE (−0.592 V and −0.692 V, curve b), the bare platinum electrode (−0.614 V and −0.700 V, curve f) and the polyfurfural film/GCE (−0.536 V and −0.680 V, curve c), but the peak I became much weaker and the peak II is clearly enhanced. As the reduction of –NO2 to –NO2˙− (peak I) is a slow reaction process,23,33,51 the reduction of metronidazole is now mainly contributed by the mechanism II rather than the mechanism I, where the –NO2 group can be directly reduced to –NHOH due to the presence of Pt nanospheres or polyfurfural film. This observation is much more pronounced for the Pt nanospheres/polyfurfural film/GCE where the peak I is nearly disappeared, suggesting a one-step reaction mechanism triggered by both Pt nanospheres and polyfurfural film. The detailed descriptions about electrocatalytical reduction mechanism of metronidazole can be seen in Fig. 4. The green and red arrows represent two kinds of reaction mechanisms (mechanism I and II in Scheme 2), respectively. In particular, the majority of metronidazole molecules follow the primary mechanism and the minority was involved in the reaction by the secondary mechanism under different conditions. The catalytical activity trend of different electrodes is also a consequence of the introduction of Pt nanospheres and polyfurfural film in order: Pt nanospheres/polyfurfural film/GCE > polyfurfural film/GCE > Pt nanospheres/GCE > bare GCE.
3.3 The effect of electropolymerization cycles of furfural and deposit time of platinum
The effects of electropolymerization cycles of furfural and deposit time of platinum on the reduction of 500 μmol dm−3 metronidazole in BR (pH 10) buffer solution have been investigated by differential pulse voltammetry. As shown in Fig. 5A, the reduction peak current reached the maximum value when 6 cycles were chosen. The polyfurfural film can be gradually formed on the GCE surface during the electropolymerization and its thickness and catalytical activity will be determined by the electropolymerization cycles of furfural. Less than 6 cycles, the polyfurfural film is probably not fully produced and not able to provide sufficient catalytical active sites to metronidazole. By contrast, if over 6 cycles, the formed polyfurfural film would be too thick and increase the resistance of the electrode surface to hinder electron transfer. Therefore, the optimized furfural electropolymerization cycles have been chosen at 6 cycles and as the optimal condition in subsequent experiments.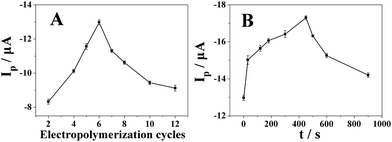 | ||
| Fig. 5 The effect of (A) electropolymerization cycles of furfural and (B) deposit time of platinum on the reduction peak current of 500 μmol dm−3 metronidazole in BR (pH 10) buffer solution (n = 3). | ||
In order to improve the catalytical properties and electronic conductivity of polyfurfural film, Pt nanospheres were allowed to grow at the surface of polyfurfural film/GCE by a potential step method, resulting in Pt nanospheres/polyfurfural film/GCE. As shown in Fig. 5B, the reduction peak current of metronidazole increased significantly with the increase of the Pt deposit time and reached the maximum value when the deposit time was 450 s. However, after 450 s, the reduction peak current gradually decreased. Therefore, the Pt deposit time of 450 s was chosen in subsequent experiments.
3.4 Effect of scan rate
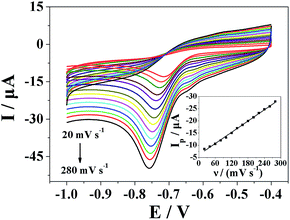
Fig. 6 shows the cyclic voltammograms of Pt nanospheres/polyfurfural film/GCE in 500 μmol dm−3 metronidazole at different scan rates. In Fig. 6, the reduction peak current showed linearity with the scan rate, and the linear regression equation can be expressed as Ip (μA) = −0.0767ν (mV s−1) − 6.1189 (R = 0.9984), which indicates the reduction of the metronidazole is typical adsorption controlled process. The pre-peak at ca. −0.65 V in the CV represents a reaction process (I-1) in mechanism I, where the –NO2 group is initially reduced to –NO2˙− (I-1) and then to –NHOH (I-2) in the first mechanism, the –NO2 group is initially reduced to –NO2˙− (I-1) is at ca. −0.65 V. It is proposed that metronidazole molecules are initially adsorbed at the surface-active sites of Pt nanospheres/polyfurfural film/GCE and then quickly reduced. Because the reduction of the metronidazole is typical adsorption controlled process, it is necessary to study the effect of accumulation time and accumulation potential.3.5 The effect of accumulation time and accumulation potential
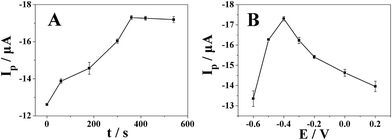
As shown in Fig. 7A, the reduction peak current by differential pulse voltammetry increased gradually with the accumulation time and reached the maximum value when the accumulation time is 360 s (accumulation potential was −0.4 V). The reduction peak current almost remained the same after 360 s due to the saturation of surface active catalytical sites of Pt nanospheres/polyfurfural film/GCE. Thus, the optimal accumulation time of 360 s was employed in further experiments.With the optimal accumulation time determined above, we further studied the effect of accumulation potential on reduction peak current of metronidazole. As shown in Fig. 7B, the reduction peak current increased gradually with the increase of accumulation potential and reached the maximum value when the accumulation potential is −0.4 V. After −0.4 V, the reduction peak current decreased with the increase of accumulation potential. Therefore, an accumulation potential at −0.4 V was chosen for determination of metronidazole in subsequent experiments.
3.6 pH effect on electrochemical behavior of metronidazole
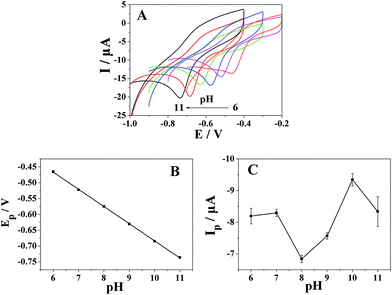
The effect of solution pH on the electrochemical behavior of metronidazole at the Pt nanospheres/polyfurfural film/GCE was investigated with BR buffer solution in the pH range from 6 to 11 (Fig. 8A). In Fig. 8A, the reduction peak potential (Ep) shift to more negative values with the increase of pH value. Fig. 8B shows good linearity between the reduction peak potential of metronidazole and pH values range from 6 to 11, with the linear regression equation Ep = −0.05424 pH − 0.14137 (R = 0.9998). The slope of the Ep–pH plot is −54.24 mV pH−1 which closes to −59.2 mV pH−1, indicated that numbers of the transferring proton and electron in the reaction were same, the result further confirmed the proposed reaction mechanism in Fig. 4 that the reduction of metronidazole at the Pt nanospheres/polyfurfural film/GCE follows mechanism II, where the –NO2 group of metronidazole can be directly reduced to –NHOH group involving four electrons and four protons transfer. As shown in Fig. 8C, pH values influenced the reduction peak current of metronidazole at the Pt nanospheres/polyfurfural film/GCE vary from 6 to 11, when the pH value was 10, the reduction peak current reached to a maximum value. Therefore, a pH value of 10 was chosen as the optimum pH value in subsequent quantification.3.7 The quantitative determination of metronidazole
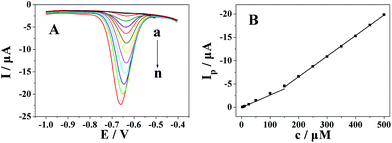
The quantitative determination of metronidazole at the Pt nanospheres/polyfurfural film/GCE under optimal conditions addressed above was achieved by DPV. As shown in Fig. 9, the reduction peak current of metronidazole at the Pt nanospheres/polyfurfural film/GCE increased linearly with concentration ranges of 2.5–150 μmol dm−3 and 150–500 μmol dm−3, and the linear regression equations were Ip (μA) = −0.02653c (μM) + 0.04097 (R = 0.9948) and Ip (μA) = −0.04418c (μM) + 2.28704 (R = 0.9999), respectively. The detection limit for metronidazole was 50 nmol dm−3 (S/N = 3).Moreover, the Pt nanospheres/polyfurfural film/GCE showed a wider linear range and a lower detection limits compared with the reported electrochemical sensors48,49,52–57 which were shown in Table 1.
| Electrode | Linear range (μmol dm−3) | Limit of detection (nmol dm−3) | Ref. |
|---|---|---|---|
| Gr-IL/GCE | 0.1–25 | 47 | 48 |
| Activated GCE | 2–600 | 1100 | 49 |
| Co/GCE | 0.4–100 | 200 | 52 |
| SWCNT/GCE | 0.1–200 | 63 | 53 |
| Carbon fiber/MDE | 1–22 | 500 | 54 |
| Poly(chromotrope 2B)/GCE | 10–400 | 330 | 55 |
| HMDE | 0.23–1.8 | 36 | 56 |
| P-AgSA-CE | 20–100 | 2000 | 57 |
| Pt nanospheres/polyfurfural film/GCE | 2.5–500 | 50 | This work |
3.8 Selectivity, reproducibility and stability of the Pt nanospheres/polyfurfural film/GCE
Selectivity is one of the key factors which can evaluate the practical application of the proposed sensor. In this study, various possible interferences from some inorganic ions, organic ions and organic compounds have been investigated by differential pulse voltammetry. In Table 2, the response of proposed sensor to metronidazole was not affected by additions of 1000-fold concentrations of inorganic ions (such as NO3−, Cl−, PO43−, SO42−, F−, CO32−, Na+, Ca2+, K+, Mg2+, Zn2+, NH4+ and K+), organic ions (such as Ac−) (signal change below 4%) and 100-fold concentrations of some organic compounds such as ascorbic acid, oxalic acid, dopamine, cystine, alanine, glucose, citric acid and tartaric acid (signal change below 5%). Moreover, interferences resulted from 10-fold concentrations of other imidazoles (imidazole, benzimidazole and 2-methylimidazole, signal change below 3%) and other molecules containing nitro group (nifedipine, nitrendipine and nitrophenol, signal change below 4%) were negligible. The results showed that the proposed sensor is superior for the determination of metronidazole with excellent selectivity.| Interference | Concentration (mol dm−3) | Signal change (%) |
|---|---|---|
| NaNO3 | 0.2 | −2.49 |
| CaCl2 | 0.2 | 3.07 |
| K3PO4 | 0.2 | −3.83 |
| MgSO4 | 0.2 | −3.16 |
| Zn(Ac)2 | 0.2 | −3.83 |
| NH4F | 0.2 | −1.70 |
| K2CO3 | 0.2 | −2.86 |
| Ascorbic acid | 0.02 | 2.84 |
| Oxalic acid | 0.02 | −0.81 |
| Dopamine | 0.02 | 4.89 |
| Cystine | 0.02 | 0.41 |
| Alanine | 0.02 | 4.93 |
| Glucose | 0.02 | −2.15 |
| Citric acid | 0.02 | 0.83 |
| Tartaric acid | 0.02 | 3.54 |
| Imidazole | 0.002 | 1.89 |
| Benzimidazole | 0.002 | 2.10 |
| 2-Methylimidazole | 0.002 | 1.52 |
| Nifedipine | 0.002 | 2.50 |
| Nitrendipine | 0.002 | 3.48 |
| Nitrophenol | 0.002 | 3.25 |
Reproducibility of the electrochemical sensors is a key factor in their application. To estimate the method's reproducibility, six modified electrodes were fabricated and the reduction peak current of metronidazole at each electrode was obtained under the same conditions. The relative standard deviation (RSD) of measurements was calculated to be 0.57% for metronidazole, indicated that the proposed sensor possesses high reproducibility. Furthermore, stability of the electrochemical sensor is another important factor in their application and development. The reduction peak current of metronidazole remained 98.51% of its initial value when the as-prepared electrode was stored at 4 °C in a refrigerator for 1 month, suggested that the proposed sensor possesses excellent stability. Therefore, from the results above, with excellent selectivity, reproducibility and stability, the Pt nanospheres/polyfurfural film/GCE is promising for determination of metronidazole.
3.9 Analytical application for real samples
To investigate the analytical reliability and application potential of the Pt nanospheres/polyfurfural film/GCE for determination of metronidazole in real sample, human serum samples were used for quantitative analysis by the standard-addition technique. Three parallel experiments were performed on all measurements. As shown in Table 3, the average recoveries were between 96.27% and 102.20%, indicating that the Pt nanospheres/polyfurfural film/GCE can be successfully used for the determination of metronidazole in real samples.| Sample | Added (μmol dm−3) | Founda (μmol dm−3) | Recovery (%) | RSD (%) |
|---|---|---|---|---|
| a Sample responses are expressed as a confidence interval of 95% probability (n = 3). | ||||
| 1 | 250 | 253.11 ± 0.37 | 101.24 | 0.06 |
| 2 | 150 | 153.30 ± 1.76 | 102.20 | 0.46 |
| 3 | 75 | 76.33 ± 2.23 | 101.77 | 1.18 |
| 4 | 35 | 33.77 ± 0.74 | 96.49 | 0.89 |
| 5 | 15 | 14.44 ± 0.99 | 96.27 | 2.77 |
4. Conclusions
In summary, a Pt nanospheres/polyfurfural film modified glassy carbon electrode has been fabricated for electrochemical sensing of metronidazole, by a one-step electropolymerization method and a potential step method, respectively. The proposed sensor was successfully applied to the determination of metronidazole in real human serum samples, which exhibited excellent electrocatalytical activity to the reduction of metronidazole. Moreover, the Pt nanospheres/polyfurfural film/GCE showed better sensitivity, stability and reproducibility compared with other sensors, which also had a wider linear ranges (2.5–500 μmol dm−3) and a lower detection limit (50 nmol dm−3). This work may provide a new and effective analytical platform for determination of metronidazole potentially in applications of real pharmaceutical and biological samples.Acknowledgements
Financial support from the National Natural Science Foundation of China (Grant No. 21475046, 21427809, 21645004) and State Key Laboratory of Pulp and Paper Engineering (201623) are gratefully acknowledged. We also acknowledge the Fundamental Research Funds for the Central Universities (No. 2015ZM050 and 2015ZP028).References
- N. C. Desai, A. S. Maheta, K. M. Rajpara, V. V. Joshi, H. V. Vaghani and H. M. Satodiya, J. Saudi Chem. Soc., 2014, 18, 963–971 CrossRef.
- A. M. Jarrad, T. Karoli, A. Debnath, C. Y. Tay, J. X. Huang, G. Kaeslin, A. G. Elliott and Y. Miyamoto, Eur. J. Med. Chem., 2015, 101, 96–102 CrossRef CAS PubMed.
- N. Dione, S. Khelaifia, J. C. Lagier and D. Raoult, Int. J. Antimicrob. Agents, 2015, 45, 537–540 CrossRef CAS PubMed.
- A. Katsandri, A. Avlamis, A. Pantazatou, G. L. Petrikkos, N. J. Legakis, J. Papaparaskevas and N. Hellenic, Diagn. Microbiol. Infect. Dis., 2006, 55, 231–236 CrossRef CAS PubMed.
- L. A. Dunn, K. T. Andrews, J. S. McCarthy, J. M. Wright, T. S. Skinner, P. Upcroft and J. A. Upcroft, Int. J. Antimicrob. Agents, 2007, 29, 98–102 CrossRef CAS PubMed.
- B. Swami, D. Lavakusulu and C. S. Devi, Curr. Med. Res. Opin., 1977, 5, 152–156 CrossRef CAS PubMed.
- H. Qureshi, A. Ali, R. Baqai and W. Ahmed, J. Int. Med. Res., 1997, 25, 167–170 CAS.
- A. V. Scorza and M. R. Lappin, J. Feline Med. Surg., 2004, 6, 157–160 Search PubMed.
- M. W. Carroll, D. Jeon, J. M. Mountz, J. D. Lee, Y. J. Jeong, N. Zia, M. Lee, J. Lee, L. E. Via and S. Lee, Antimicrob. Agents Chemother., 2013, 57, 3903–3909 CrossRef CAS PubMed.
- J. Han, L. Zhang, S. Yang, J. Wang and D. Tan, Bull. Environ. Contam. Toxicol., 2014, 92, 196–201 CrossRef CAS PubMed.
- A. Kuriyama, J. L. Jackson, A. Doi and T. Kamiya, Clin. Neuropharmacol., 2011, 34, 241–247 CrossRef CAS PubMed.
- J. P. Ferroir, C. Corpechot, A. Freudenreich and A. Khalil, Rev. Neurol., 2009, 165, 828–830 CrossRef PubMed.
- A. Etxeberria, S. Lonneville, M. P. Rutgers and M. Gille, Rev. Neurol., 2012, 168, 193–195 CrossRef CAS PubMed.
- N. M. McGrath, B. Kent-Smith and D. M. Sharp, Clin. Exp. Ophthalmol., 2007, 35, 585–586 Search PubMed.
- M. P. Prabhakaran, M. Zamani, B. Felice and S. Ramakrishna, Mater. Sci. Eng., C, 2015, 56, 66–73 CrossRef CAS PubMed.
- A. Turcant, A. Premel-Cabic, A. Cailleux and P. Allain, Clin. Chem., 1991, 37, 1210–1215 CAS.
- B. M. Tashtoush, E. L. Jacobson and M. K. Jacobson, Drug Dev. Ind. Pharm., 2008, 34, 840–844 CrossRef CAS PubMed.
- C. Ho, D. W. Sin, K. M. Wong and H. P. Tang, Anal. Chim. Acta, 2005, 530, 23–31 CrossRef CAS.
- V. R. Bari, U. J. Dhorda and M. Sundaresan, Anal. Chim. Acta, 1998, 376, 221–225 CrossRef CAS.
- A. K. Mishra, A. Kumar, A. Mishra and H. V. Mishra, J. Nat. Sci., Biol. Med., 2014, 5, 261–264 CrossRef CAS PubMed.
- S. Z. Tan, J. H. Jiang, B. N. Yan, G. L. Shen and R. Q. Yu, Anal. Chim. Acta, 2006, 560, 191–196 CrossRef CAS.
- Y. Lin, Y. Su, X. Liao, N. Yang, X. Yang and M. F. Choi, Talanta, 2012, 88, 646–652 CrossRef CAS PubMed.
- H. B. Ammar, M. B. Brahim, R. Abdelhedi and Y. Samet, Mater. Sci. Eng., C, 2016, 59, 604–610 CrossRef CAS PubMed.
- Y. Gu, X. Yan, W. Liu, C. Li, R. Chen, L. Tang, Z. Zhang and M. Yang, Electrochim. Acta, 2015, 152, 108–116 CrossRef CAS.
- G. Yang, F. Zhao and B. Zeng, Electrochim. Acta, 2014, 135, 154–160 CrossRef CAS.
- E. Roy, S. K. Maity, S. Patra, R. Madhuri and P. K. Sharma, RSC Adv., 2014, 4, 32881–32893 RSC.
- S. Sadeghi, M. Hemmati and A. Garmroodi, Electroanalysis, 2013, 25, 316–322 CrossRef CAS.
- Y. Gu, X. Yan, C. Li, B. Zheng, Y. Li, W. Liu, Z. Zhang and M. Yang, Biosens. Bioelectron., 2016, 77, 393–399 CrossRef CAS PubMed.
- Y. B. Mollamahale, M. Ghorbani, M. Ghalkhani, M. Vossoughi and A. Dolati, Electrochim. Acta, 2013, 106, 288–292 CrossRef CAS.
- W. Liu, J. Zhang, C. Li, L. Tang, Z. Zhang and M. Yang, Talanta, 2013, 104, 204–211 CrossRef CAS PubMed.
- B. Rezaei and S. Damiri, Electrochim. Acta, 2010, 55, 1801–1808 CrossRef CAS.
- Y. Liu, J. Liu, H. Tang, J. Liu, B. Xu, F. Yu and Y. Li, Sens. Actuators, B, 2015, 206, 647–652 CrossRef.
- Y. Gu, W. Liu, R. Chen, L. Zhang and Z. Zhang, Electroanalysis, 2013, 25, 1209–1216 CrossRef CAS.
- H. Li, H. Guan, H. Dai, Y. Tong, X. Zhao, W. Qi, S. Majeed and G. Xu, Talanta, 2012, 99, 811–815 CrossRef CAS PubMed.
- K. C. Lin, C. Y. Yin and S. M. Chen, Sens. Actuators, B, 2011, 157, 202–210 CrossRef CAS.
- M. R. Ganjali, P. Norouzi, F. Faridbod and H. Pirelahi, J. Chin. Chem. Soc., 2007, 54, 55–61 CrossRef CAS.
- K. Giribabu, R. Suresh, R. Manigandan, S. Munusamy, S. P. Kumar, S. Muthamizh and V. Narayanan, Analyst, 2013, 138, 5811–5818 RSC.
- F. Ismail and S. B. Adeloju, Electroanalysis, 2014, 26, 2701–2709 CrossRef CAS.
- M. Li, W. Liu, J. P. Correia, A. C. Mourato, A. S. Viana and G. Jin, Electroanalysis, 2014, 26, 374–381 CrossRef CAS.
- S. He, Z. Chen, Y. Yu and L. Shi, RSC Adv., 2014, 4, 45185–45190 RSC.
- S. Chitravathi, B. E. Swamy, G. P. Mamatha and B. S. Sherigara, J. Electroanal. Chem., 2012, 667, 66–75 CrossRef CAS.
- H. L. Yan, H. L. Xiao, Q. J. Xie, J. L. Liu, L. G. Sun, Y. P. Zhou, Y. Zhang, L. Chao, C. Chen and S. Z. Yao, Sens. Actuators, B, 2015, 207, 167–176 CrossRef CAS.
- X. Chen, Q. Zhang, C. Qian, N. Hao, L. Xu and C. Yao, Biosens. Bioelectron., 2015, 64, 485–492 CrossRef CAS PubMed.
- T. Y. Wei, X. J. Huang, Q. Zeng and L. S. Wang, J. Electroanal. Chem., 2015, 743, 105–111 CrossRef CAS.
- Q. Zeng, T. Y. Wei, M. Wang, X. J. Huang, Y. S. Fang and L. S. Wang, Electrochim. Acta, 2015, 186, 465–470 CrossRef CAS.
- Y. H. Fu, Y. P. Lin, T. S. Chen and L. S. Wang, J. Electroanal. Chem., 2012, 687, 25–29 CrossRef CAS.
- N. Tian, Z. Y. Zhou, S. G. Sun, Y. Ding and Z. L. Wang, Science, 2007, 316, 732–735 CrossRef CAS PubMed.
- J. Peng, C. Hou and X. Hu, Sens. Actuators, B, 2012, 169, 81–87 CrossRef CAS.
- S. A. Ozkan, Y. Ozkan and Z. Senturk, J. Pharm. Biomed. Anal., 1998, 17, 299–305 CrossRef CAS PubMed.
- S. F. Lu, K. B. Wu, X. P. Dang and S. S. Hu, Talanta, 2004, 63, 653–657 CrossRef CAS PubMed.
- V. Vyskocil and J. Barek, Curr. Org. Chem., 2011, 15, 3059–3076 CrossRef CAS.
- Y. Zhi, J. B. Hu, Z. D. Wu and Q. L. Li, Anal. Lett., 1998, 31, 429–437 CrossRef.
- A. Salimi, M. Izadi, R. Hallaj and M. Rashidi, Electroanalysis, 2007, 19, 1668–1676 CrossRef CAS.
- P. N. Bartlett, E. Ghoneim, G. El-Hefnawy and I. El-Hallag, Talanta, 2005, 66, 869–874 CrossRef CAS PubMed.
- X. Li and G. Xu, J. Food Drug Anal., 2014, 22, 345–349 CrossRef CAS.
- Y. Gui, Y. N. Ni and S. Kokot, Chin. Chem. Lett., 2011, 22, 591–594 CrossRef CAS.
- V. Vyskocil, T. Navratil, A. Danhel, J. Dedik, Z. Krejcova, L. Skvorova, J. Tvrdikova and J. Barek, Electroanalysis, 2011, 23, 129–139 CrossRef CAS.
| This journal is © The Royal Society of Chemistry 2017 |

