 Open Access Article
Using aminopyrine as a nitrogen-enriched small molecule precursor to synthesize high-performing nitrogen doped mesoporous carbon for catalyzing oxygen reduction reaction
Enguang Zhang a,
Mingjie Wua,
Qiaowei Tanga,
Qiaojuan Gong*b,
Shuhui Sun*c,
Jinli Qiao*a and
Lei Zhang*d
aCollege of Environmental Science and Engineering, Donghua University, 2999 Ren'min North Road, Shanghai 201620, China. E-mail: qiaojl@dhu.edu.cn; Fax: +86-21-67792159; Tel: +86-21-67792379
bDepartment of Applied Chemistry, Yuncheng University, 1155 Fudan West Street, Yun Cheng 04400, P. R. China. E-mail: gqjuan@163.com
cInstitut National de la Recherche Scientifique (INRS), Energie Materiaux Telecommunications Research Center, 1650 Boul. Lionel-Boulet Varennes, Quebec J3X 1S2, Canada. E-mail: shuhui@emt.inrs.ca
dEnergy, Mining and Environment, National Research Council Canada, 4250 Wesbrook Mall, Vancouver, V6T 1W5, Canada. E-mail: Lei.Zhang@nrc.gc.ca
First published on 3rd January 2017
Abstract
With aminopyrine as a nitrogen-enriched small molecule precursor, a series of nitrogen doped carbon materials have been fabricated and explored as electrocatalysts for oxygen reduction reaction (ORR). The most active catalyst is a nitrogen doped carbon, which was prepared through a facile template-mediated pyrolyzing method using ferric nitrate (Fe(NO3)3·9H2O) as an activation reagent along with nanoscaled silica as a sacrificial support (hereafter referred to as AP/SiO2). The AP/SiO2 is confirmed and identified as having highly active molecule catalytic centers for ORR, due to its possessing a porous, sponge-like and uniform structure with a super-large specific surface area of 932.68 m2 g−1. The AP/SiO2 catalyst exhibited a high onset potential of 0.98 V, a half-wave potential of 0.82 V, and a high number of exchanged electrons (>3.8, close to four) in alkaline media. After 5000 continuous cycles, the material showed almost no negative shift with respect to the Pt/C material. Even in acidic medium, the AP/SiO2 catalyst still showed much higher durability than Pt/C and a low yield of HO2−. This work may have provided a new and simple route in the design and batch-synthesis of highly active and durable carbonaceous electrocatalysts for ORR.
1. Introduction
The rapid increase of the global energy consumption coupled with the critical issue of climate change has led to tremendous research efforts towards clean and renewable energy sources.1 In response, fuel cells and metal–air batteries have been investigated many times in recent years as promising renewable energy technology,2,3 owing to their large energy density, high efficiency and to the fact that the emission of harmful gases can be negligible.4,5 The kinetically sluggish four-electron oxygen reduction reaction (ORR), one of the key reactions occurring at the cathode in fuel cells, is the foremost limitation in these energy-transforming appliances.6,7 Durable catalysts with high activity for the oxygen reduction reaction (ORR) are undoubtedly crucial for the large scale application of fuel cells.4,8 To efficiently catalyze the ORR, Pt-based materials are widely recognized as the superior ORR electrocatalysts. However, the commercial applications of the Pt-based materials have been blocked by the low performance and high electrode costs of the Pt cathode.9,10 Furthermore, Pt-based catalysts are easily subject to aggregation, dissolution, and poisoning, bring down the active surface area and increasing the overpotential for fuel cell reactions, especially for the sluggish but critical ORR.11,12 So essentially, to replace the Pt materials, intensive research has been exploring by developing new ORR electrocatalyst alternatives of low-cost and abundant materials with high activity and stability.13Cheap, efficient and abundant non-precious metal catalysts are believed to be the best long-term, sustainable solutions for large-scale applications in the fuel cell field.4,14,15 In this regard, two traditional methods are normally proposed: (1) dope some heteroatoms to increase active sites using the direct pyrolysis; and (2) change the catalysts' morphology such as porous structure and size to transport properties of the ORR-relevant species. In the numerous catalysts studied, transition metal nitrogen (N) doped carbon materials16,17 (carbon nanotubes, graphene and amorphous activated carbon), with high activity and good stability in alkaline medium have been explored as promising candidates.7,18,19 And these carbon materials may work together with the metal species, providing significantly promotion in catalyzing efficiency.20,21 Recently, certain types of heteroatom doped carbon materials with N, B, S, P, Co, Fe, Mn, have shown high activity for the ORR, especially for nitrogen- and sulfur-doped carbon materials.14,22–28 It was found that the morphology of the catalyst's pores could significantly impact catalytic ORR performances besides the chemical compositions of the active sites,29–31 since pores with adequate size had a large accessible surface area, which would expose more active sites to the surrounding media, offering more and more efficient transport path for the target reactants and products.32 Therefore, it is essential to control both the morphology and structures of the catalysts.33
It is believed that the high surface area, the high porosity and the proper pore structure of catalysts usually lead to a high catalytic activity for the ORR. Herein, we present a nitrogen (N) doped mesoporous carbon material with low cost, high surface area and high porosity. The mesoporous carbon materials were synthesized by homogeneously dispersing iron and aminopyrine precursors onto the surface of the SiO2 template (AP/SiO2). In particular, we used a nitrogen-enriched small molecule precursor acting as carbon–nitrogen co-source without any additional N precursors. The nanoscaled silica was removed by excess amount of sodium hydroxide instead of hydrofluoric acid. Therefore, the product can be produced readily in large green quantities. Transition metal Fe was also removed by acid-leaching after heat-treatment to obtain final catalysts and, thus to improve the durability of catalysts at the same time. The as-prepared AP/SiO2 showed a sponge-like uniform structure with a specific surface area of 932.68 m2 g−1. As a result, the sample exhibited outstanding ORR activity and stability both in acidic and alkaline solutions, making it a promising substitute to commercial Pt/C in both fuel cell and metal–air battery systems.
2. Experimental
2.1 Catalyst preparation
Mesoporous silica (500 nm particle size) was purchased from Hangzhou Wan Jing New Material Co., Ltd. Ferric nitrate (Fe(NO3)3·9H2O), perchloric acid (HClO4), potassium hydroxide (KOH), aminopyrine and isopropyl alcohol were purchased from Sinopharm Chemical Reagent Co., Ltd. Sodium hydroxide (NaOH) was purchased from Pinghu Chemical Reagent Factory. Sulfuric acid (H2SO4) was purchased from Kunshan crystal microelectronics materials co., Ltd. All the chemicals were used as received without further purification.The template SiO2 solution was prepared as we reported recently.25 The AP/SiO2 was synthesized by homogeneously dispersing iron and aminopyrine precursors onto the surface of the SiO2 template. For obtaining the mesoporous carbon materials, at first, 4 grams of SiO2 were added into 40 mL 1 M HCl under stirring to form a homogeneous solution. In a typical synthesis process, 100 mL 0.15 M aminopyrine solution was added into the pre-synthesized SiO2 solution under magnetic stirring, resulting in the spontaneous coating of adherent aminopyrine layers. Then, 20 mL 0.55 M Fe(NO3)3 solution was added into this mixture under stirring for more than 1 h. Then the viscous solution obtained above was dried for 48 h at 85 °C. The resulted solid was forced ground until to a homogeneous fine powder in an agate mortar, and then pyrolyzed at 800 °C under a nitrogen atmosphere for 1 h, with a temperature ramp rate of 5 °C min−1. Excess amount of sodium hydroxide (NaOH) (5 M) solution were used to leach out the SiO2 for 48 hours. The resulting powder was washed with deionized water for neutralization, and then dried overnight. The redundant phase (mainly unreacted metallic iron and iron compounds) were removed, using acid-leached with 0.5 M H2SO4 at 85 °C for 8 h, then re-pyrolyzed at 800 °C for 1 h under the same conditions as those during the first heat treatment to obtain the final catalyst sample.
To confirm the effect of specific surface area and pore structure, two other samples were also synthesized: one is the Vulcan-BP2000 carbon black (provided by Carbot Corporation with a specific surface area of 1475 m2 g−1), which was used as the support to increase the conductivity and specific surface area, thus denoted as AP/BP2000. The other one was AP, which was also synthesized as general catalyst but without any addition of SiO2 template or carbon support, just simply pyrolyzed under the same high temperature as for AP/SiO2 and AP/BP2000.
2.2 Sample characterization
Scanning electron microscopy (SEM) analysis was carried out using HITACHI/S-4800 system. Transmission electron microscopy (TEM) analyses were carried out using a high-resolution Hitachi JEM-2100 system operating at 200 kV. To verify the microstructures of the samples, XRD patterns were collected by a Rigaku D/max-2550 V diffractometer with Cu Kα radiation operating at 30 kV and 40 mA. The specific surface area was measured by the Brunauer–Emmett–Teller (BET) method using nitrogen adsorption–desorption isotherms on an ASAP 2020 volumetric adsorption analyzer (Micromeritics, U.S.A.), and the specific surface area was in a relative pressure range of 0.05–0.3. The pore size distribution curves were calculated by the nonlocal density functional theory. X-ray photoelectron spectroscopy (XPS) measurements were performed to analyze surface particles of the catalyst, using a spectrometer (RBD-upgraded PHI-5000C ECSA system (PerkinElmer)) with an Al Kα X-ray anode source (hν = 1486.6 eV) at 14.0 kV and 250 W.2.3 Electrochemical measurements
All of the electrochemical measurements were performed using a standard three-electrode cell with the CHI Electrochemical Station (760D). The electrocatalytic activities were evaluated by linear sweep voltammetry (LSV) using both rotating disk electrode (RDE) and rotating ring-disk electrode (RRDE) techniques using a Pine RDE instrument (Pine Research Instrumentation, USA). A platinum wire was used as the counter electrode and a saturated calomel electrode as the reference electrode, respectively. The catalyst of 5.0 mg was dispersed in a 1 mL mixed solution containing 800 μL isopropyl alcohol and 200 μL 0.5% Nafion (diluted with methanol) to prepare the catalyst ink (ultrasonically mixing for more than 1 h). Then 5 μL (loading, 100 μg cm−2) or 15 μL (loading, 300 μg cm−2) of ink was applied onto a clean glassy carbon (GC) disk (6.25 mm inner diameter and 7.92 mm outer diameter) with a sectional area of 0.2475 cm2 and used as the working electrode. For comparison, a commercially available Pt/C catalyst (20 wt% Pt) was used as the baseline. Pt/C catalyst (loading, 100 μg cm−2) was also measured under the same conditions. All electrochemical tests were performed in O2-saturated 0.1 M KOH at room temperature. A flow of O2 was maintained over the electrolyte to ensure a continuous O2 saturation during the measurement. In this work, all potentials were converted to the reversible hydrogen electrode (RHE) scale using the well-known Nernst relation, E (RHE) = E (SHE) + 0.059 pH. Before each measurement, the electrolyte was bubbled with O2 for 30 minutes. Linear sweep voltammetry was conducted under the same conditions in an N2-saturated electrolyte to subtract the background capacitive current.3. Results and discussion
3.1 Physical characterization
The morphology and microstructure were first investigated by means of scanning electron microscopy (SEM) and low-resolution transmission electron microscopy (TEM). As shown in Fig. 1(a)–(c), AP demonstrated a sheet-like structure, whereas AP/BP2000 showed a particle cluster structure. This may derive from the specific morphology features (high surface area and coarse structure) of BP2000. It was worthwhile to note that sponge-like uniform structure was observed for the AP/SiO2 catalyst, obviously from the removing of SiO2. The TEM images shown in Fig. 1(d)–(f) reflected the geometric characteristics of the AP without any template and demonstrated successful introduction of BP2000 and SiO2 for these catalysts. The XRD pattern of AP/SiO2 (Fig. 2(a)) showed only two apparent broad diffraction peaks (23° and 43°), which correspond to the (002) and (004) planes of carbon materials with low graphitization, certifying an entirely amorphous structure. Obviously, this structure was consistent with the sponge-like structure shown in Fig. 1(f). In addition, we could hardly observe any metal-containing nanoparticles by TEM inspection because the etching processes dissolved both the inorganic template silica and metal particles, which are also proved by XRD pattern.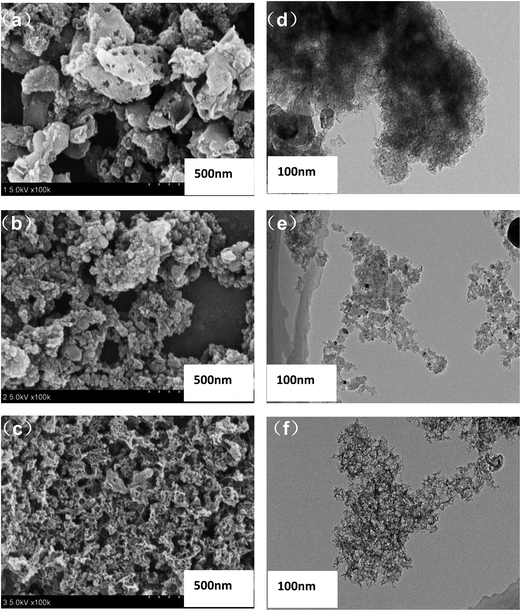 | ||
| Fig. 1 SEM images of AP (a), AP/BP2000 (b), and AP/SiO2 (c). TEM images of as-prepared AP (d), AP/BP2000 (e), and AP/SiO2 (f). | ||
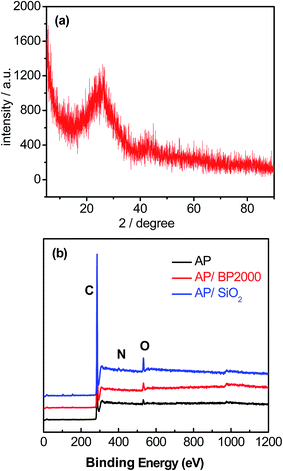 | ||
| Fig. 2 (a) XRD pattern of AP/SiO2 sample. (b) XPS spectra of AP, AP/BP2000, and AP/SiO2 catalyst samples. | ||
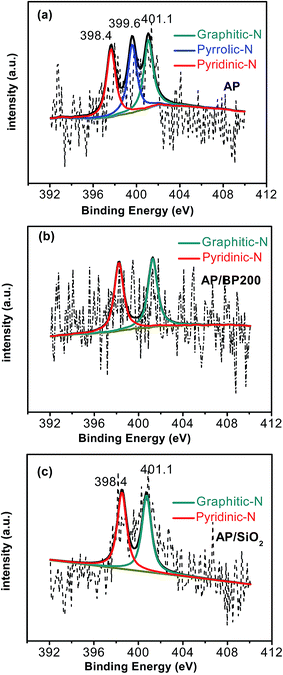
In view of the surface properties, XPS was conducted to study the surface chemical composition of the samples. The XPS data confirmed the presence of N in the carbonized products (AP, AP/BP2000 and AP/SiO2). The elemental analysis results were also shown in Table 1. As shown in Fig. 2(b), almost no silica or metallic species can be detected for all of the three samples except for C, N, O signals. Obviously, this result may not be accurate enough to prove that the leaching processes using NaOH solution and H2SO4 are extremely effective. Therefore, we made further elemental analysis using ICP technique, and found that the final Fe content of catalysts was around 0.4 wt%. This result confirmed the presence of trace metals, which was consistent with those reported elsewhere.14,24–28 Therefore, we could not completely rule out the contribution of residual Fe to the ORR performance in this work, although the content of Fe is very low. By curve-fitting the high-resolution N 1s spectrum of AP (Fig. 3(a)), three different components of nitrogen could be proposed as pyridinic-N at 398.4 eV, pyrrolic-N at 399.7 eV and graphitic-N at 401.1 eV.34 It was noteworthy that the N 1s spectra of AP/BP2000 (Fig. 3(b)) and AP/SiO2 (Fig. 3(c)) showed only two different signals having binding energies of 398.4 eV, 401.1 eV, corresponding to pyridinic-N and graphitic-N, respectively. To the best of our knowledge pyridinic-N and graphitic-N are generally believed to participate in the active sites.35–37 This phenomena was also found in our most recently reported work derived from nitrogen-enriched polyquaternium24,25 and poly(ethyleneimine).14 The ratio of different functions nitrogen of the total nitrogen was shown in Table 1. This may verify that the low ORR catalytically active form of pyrrolic-N was found to be the dominant form of the doped N for AP, while the pyridinic-N and graphitic-N with high ORR catalytic activity for AP/SiO2.38,39
| Catalysts | Total surface C content (at%) | Surface content (at%) of different N functionalities | Total surface O content (at%) | ||
|---|---|---|---|---|---|
| Pyridinic-N | Graphitic-N | Pyrrolic-N | |||
| AP | 58.71% | 3.75% | 4.49% | 4.59% | 29.36% |
| AP/BP2000 | 44.88% | 2.75% | 2.90% | — | 49.47% |
| AP/SiO2 | 40.56% | 3.84% | 4.34% | — | 51.26% |
The porous nature of the three catalysts was assessed by nitrogen adsorption–desorption analysis (Fig. 4(a)–(c)). Both the AP and AP/BP2000 catalysts exhibited gentle isotherm, while AP/SiO2 showed a steep increase of nitrogen absorption at a relatively high pressure. As a result, the existence of mesopores was testified. The nitrogen adsorption–desorption analysis proved that the porous structures are consistent with the SEM and TEM images. The BET surface areas of these three catalysts are 434.4 m2 g−1 (AP), 708.4 m2 g−1 (AP/BP2000), and 932.7 m2 g−1 (AP/SiO2), respectively, where the AP/SiO2 shows the largest surface area. It is obvious that the porous structure in AP and AP/BP2000 are not observed, whereas the mesopore size distribution is clearly centered at 12.5 nm for AP/SiO2, according to the Barrett–Joyner–Halenda (BJH) model (inset in Fig. 4(c)).
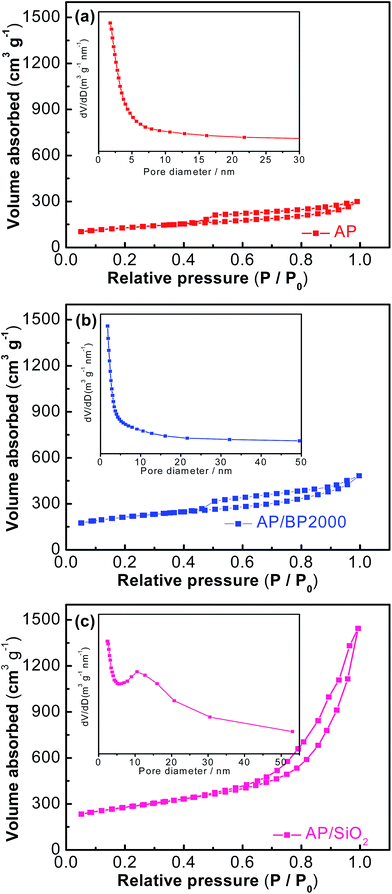 | ||
| Fig. 4 N2 sorption isotherms of AP (a), AP/BP 2000 (b), and AP/SiO2 (c). Insets show the pore size distribution from the BJH method of corresponding samples. | ||
3.2 Electrochemical measurements
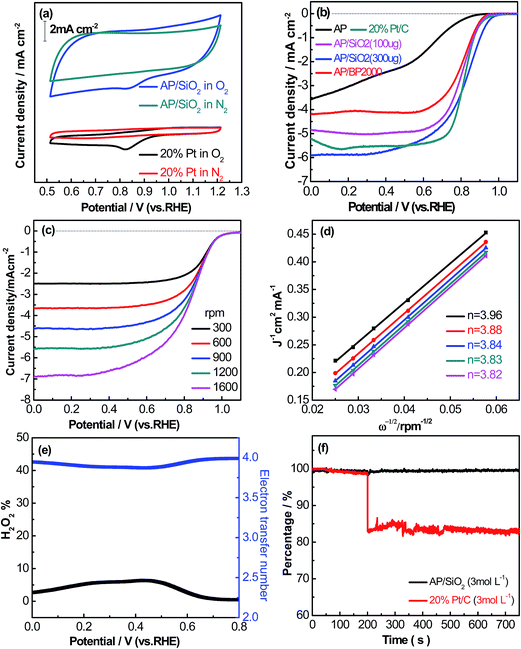
The ORR performance of AP, AP/BP2000 and AP/SiO2 were investigated, using both the cyclic voltammetry (CV) and the linear sweep voltammetry (LSV) on a rotating disk electrode (RDE). Fig. 5(a) showed the CV curves of AP/SiO2 and 20% Pt/C, tested in a N2- and O2-saturated 0.1 M KOH aqueous electrolyte solution at a scan rate of 50 mV s−1. In conditions of the O2-saturated solution, the CV curves both exhibited significant cathodic oxygen reduction peaks, whereas the CV curves showed no obvious peaks in the N2-saturated electrolyte. Compared with 20% Pt/C, AP/SiO2 displayed almost the same pronounced ORR peak with potential 0.85 V vs. 0.84 V, and a higher corresponding current density. The results strongly certified that the AP/SiO2 had good ORR catalytic performance towards ORR relatively.To gain further insight into the ORR, RDE technique was performed in O2- saturated 0.1 M KOH aqueous solution with a scan rate of 5 mV s−1. Fig. 5(b) compared the RDE polarization curves obtained at 1600 rpm for the catalysts. As shown in Fig. 5(b), the LSV curves of pure AP in 0.1 M KOH was sluggish. The sharp increase in onset potential relative to AP indicated that the addition of BP2000 and SiO2 improved the electrocatalytic activity greatly. The onset potential reflects the O2 reduction overpotential. This implies that the larger BET surface area may lead to the better ORR performance. For comparison, 20% Pt/C was also obtained in a similar way, and the onset potential of 0.96 V was observed. The onset potential, half potential and current density of the catalysts are shown in Table 2. Evidently, the AP/SiO2 exhibits a comprehensive advantage over the other two catalysts. To our interest, the AP/SiO2 electrode with a loading of 300 μg cm−2 possessed an onset potential of 0.98 V, even more positive than that of the 20% Pt/C electrode (0.96 V) (Fig. 5(b)). Compared to 20% Pt/C, the AP/SiO2 gives higher onset potential (about 0.02 V), larger current density (about 0.47 mA cm−2), and almost the same half-potential at 0.82 V (shown in Table 2). The activity of the catalyst is as good as most of catalysts reported before,40 and even much higher than these catalysts.41–43 The excellent performance of AP/SiO2 derived from the structural features such as larger specific surface area and suitable porous structure. In short, the ORR performance of AP/SiO2 was higher than commercial Pt/C, which opened up a new path for the fuel cells.
| Catalysts | Loading (μg cm−2) | Onset potential (V vs. RHE) | Half-potential (V vs. RHE) | Current density (V vs. RHE) |
|---|---|---|---|---|
| AP | 300 | 0.86 | 0.58 | 3.58 |
| AP/BP2000 | 300 | 0.93 | 0.81 | 4.21 |
| AP/SiO2 | 100 | 0.94 | 0.80 | 4.85 |
| AP/SiO2 | 300 | 0.98 | 0.82 | 5.97 |
| 20% Pt/C | 100 | 0.96 | 0.82 | 5.50 |
The kinetic process and pathway of the ORR on AP/SiO2 electrode was thoroughly evaluated using diffusion-corrected Tafel plots. Polarization curves of the AP/SiO2 catalyst at different rotation rates (300, 600, 900, 1200 and 1600 rpm), were recorded using the RDE technique (Fig. 5(c)). The curves showed an increase in the catalytic current density with rotation rates because of the enhanced diffusion of electrolytes.37 Then the Koutecky–Levich plots for the ORR at different potential for AP/SiO2 can be obtained. The slope of the plots allowed us to check the consistency with the theoretical values according to the following eqn (1):
 | (1) |
 | (2) |
The jd can be expressed as eqn (3):
 | (3) |
![[thin space (1/6-em)]](https://www.rsc.org/images/entities/char_2009.gif) 485 C mol−1), Co2 was the concentration of dissolved oxygen, Do2 was choose as the diffusion coefficient of oxygen in the bulk solution, v stood for the kinematic viscosity of the solution.
485 C mol−1), Co2 was the concentration of dissolved oxygen, Do2 was choose as the diffusion coefficient of oxygen in the bulk solution, v stood for the kinematic viscosity of the solution.
With AP/SiO2 as a typical candidate, Fig. 5(d) showed the Koutecky–Levich plots at 0.61, 0.65, 0.69, 0.73, 0.77 V, respectively. By computing the slopes of the Koutecky–Levich plots, the number of transferred electrons of 3.96, 3.88, 3.84, 3.83, 3.82 are figured out, which increases with a cathodically increased potential. It can be seen that the number of transferred electrons for oxygen reduction depend on the high positive over potentials with an average value of 3.86. This result demonstrates that the 4e− transfer process has taken place, and the reduction of O2 produces HO2− in the final product in AP/SiO2 electrode. This result is consistent with the description in literature.22,26,27,44 As we have described above, the final Fe content of AP/SiO2 catalyst is around 0.4 wt%. According to literature, even a slight trace of metallic impurities in carbon materials may have a strong influence on the ORR.14,46 This indicates that the groups among Fe and N may act as catalysts' active sites for ORR, following 4e− transfer process. On the other hand, the excellent ORR electrocatalytic performance of the AP/SiO2 can be resulted from the introduction of the unique mesoporous structures.14,24,25 This was further confirmed by a rotating ring-disk electrode (RRDE) measurement that monitors the peroxide species (HO2−) produced during the ORR process on the AP/SiO2 catalyzed electrode.
The percentage of peroxide (H2O2%) was determined using RRDE technique at room temperature based on ring current (Ir) and the disk current (Id) through the following eqn (4):
 | (4) |
The electron transfer number (n) could be calculated via the following eqn (5):
 | (5) |
As shown in Fig. 5(e), the peroxide yield on the AP/SiO2 electrode was found to be less than 8% over the potential range of 0 V to 0.80 V. The corresponding electron transfer number was higher than 3.8, suggesting the nearly complete reduction of oxygen to water.
Given the excellent ORR activity of AP/SiO2, its ability to tolerance the negative effect of methanol oxidation on cathode of direct methanol fuel cells was also tested (this is important for direct methanol fuel cells, in which methanol can crossover from anode to cathode to react with ORR electrode, reducing the cathode potential, poison the ORR catalyst, and waste methanol fuel). To test the methanol tolerance of the AP/SiO2 catalyst, the chronoamperometric responses was recorded in the presence of methanol in the electrolyte solution, and 20% Pt/C as a comparison (shown in Fig. 5(f)). After the addition of 3 M methanol to a 0.1 M KOH solution saturated with O2, it can be seen that the AP/SiO2 electrode has superior ability to tolerance methanol oxidation, however, the Pt/C showed a dramatic decrease under the same testing conditions. These results extremely indicated that the AP/SiO2 catalyst also displayed a high selectivity for the ORR with excellent resistance to methanol crossover poisoning effects, besides the excellent electrocatalytic activity.
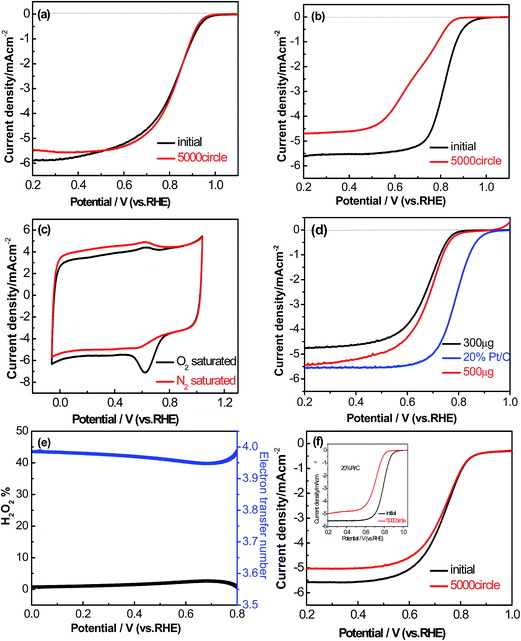
The durability of the AP/SiO2 electrode was also evaluated in an O2-saturated 0.1 M KOH solution at a scan rate of 50 mV s−1 (Fig. 6(a)). In this regard, we tested and compared the RDE curves before and after 5000 cycles with Pt/C catalyst as a benchmark. It was noted that after 5000 continuous cycles, there was 18% of decrease to the initial current density observed from the Pt/C electrode, and half-wave potential E1/2 exhibited a severe shift of 127 mV (Fig. 6(b)). Importantly, the AP/SiO2 showed only a 7% decrease relative to the initial current density within the same tested period, and half-wave potential E1/2 almost exhibited no shift (Fig. 6(a)), indicating that the AP/SiO2 catalyst was very stable in alkaline solution.
To the best of our knowledge, a large part of non-precious metal catalysts possess high overpotential and low durability in acidic medium.45 The electrocatalytic performance of the AP/SiO2 in acidic medium (0.5 M H2SO4) was also investigated. As the CV curves shown in Fig. 6(c), the AP/SiO2 catalyst showed an obvious peak at 0.674 V vs. RHE in O2-saturated 0.1 M HClO4 solution. The LSV measurements on RDE for each of AP/SiO2 and 20% Pt/C in 0.1 M HClO4 electrolyte at a scan rate of 50 mV s−1 and a rotation rate of 1600 rpm were then conducted (Fig. 6(d)). Compared with 20% Pt/C (loading of 100 μg cm−2), the AP/SiO2 with a loading of 300 μg cm−2, showed a relatively small onset potential at 0.79 V vs. RHE, half potential at 0.66 V, and current density 4.8 mA cm−2, but with the increase of loading, the onset potential, half potential and current density all have a certain rise. For example, the catalyst (loading of 500 μg cm−2) gives an onset potential at 0.82 V and a half-wave potential at 0.69 V. Considering that the carbon materials are economical and inexpensive, a large loading can make up the shortage of electrochemically active.
The pathway and kinetic process of the ORR in acidic solution were also evaluated as shown in Fig. 6(e). The peroxide yield on the AP/SiO2 electrode was found to be very small (less than 3%) over the potential range of 0 V to 0.80 V. The corresponding electron transfer number was thus higher than 3.94. These results also indicated that AP/SiO2 had a good performance in acidic solution. Further by comparing the performance before and after the 5000 cycles (Fig. 6(f)), to our surprise, AP/SiO2 even showed much higher durability than Pt/C. Both the onset potential and the half-wave potential are almost no any shift, except for some decrease in diffusion-limited current density. This suggests that the AP/SiO2 has an excellent electrochemistry performance for ORR.
4. Conclusions
From the view of precursor materials, (1) AP/SiO2 synthesized using small molecules and low-cost material, can greatly reduce the economic cost of the catalyst. (2) The precursor, aminopyrine, acts as both nitrogen and carbon sources at the same time without needing any additional dopants. (3) The nanoscaled template silica can be facially removed by excess amount of sodium hydroxide instead of hydrofluoric acid, thus the catalyst material can be produced in large green quantities. In view of catalyst performance, AP/SiO2 exhibits high ORR performance (early peak potential and half potential, large current density, high surface area, high porosity) both in the acid and alkaline solution. Meanwhile, AP/SiO2 shows the perfect resistance to methanol, and cyclic stability.Since AP/SiO2 shows a sponge-like uniform structure with a specific surface area of 932.7 m2 g−1, as a result, the sample exhibits promising ORR activity and stability both in acidic and alkaline solutions. The outstanding electrochemical performance thereby makes it a promising future substitute to commercial Pt/C in fuel cell systems.
Acknowledgements
This work was financially supported by the National Natural Science Foundation of China (U1510120, 21173039); the International Academic Cooperation and Exchange Program of Shanghai Science and Technology Committee (14520721900) and the College of Environmental Science and Engineering, State Environmental Protection Engineering Center for Pollution Treatment and Control in Textile Industry, Donghua University. All the financial supports are gratefully acknowledged.References
- S. Chu and A. Majumdar, Nature, 2012, 488, 294–303 CrossRef CAS PubMed.
- F. Jaouen, Energy Environ. Sci., 2010, 4, 114–130 Search PubMed.
- W. Gang, K. L. More, C. M. Johnston and Z. Piotr, Science, 2011, 332, 443–447 CrossRef PubMed.
- M. K. Debe, Nature, 2012, 486, 43–51 CrossRef CAS PubMed.
- P. G. Bruce, S. A. Freunberger, L. J. Hardwick and J. M. Tarascon, Nat. Mater., 2012, 11, 19–29 CrossRef CAS PubMed.
- Y. Li, M. Gong, Y. Liang, J. Feng, J. E. Kim, H. Wang, G. Hong, B. Zhang and H. Dai, Nat. Commun., 2013, 4, 1805 CrossRef PubMed.
- K. Gong, F. Du, Z. Xia, M. Durstock and L. Dai, Science, 2009, 323, 760–764 CrossRef CAS PubMed.
- R. J. G. Seungdoo Park and J. M. Vohs, Appl. Catal., A, 2000, 200, 55–61 CrossRef.
- B. E. Logan, Appl. Microbiol. Biotechnol., 2010, 85, 1665–1671 CrossRef CAS PubMed.
- A. Matthias, K. J. J. Mayrhofer, S. Vojislav, B. B. Blizanac, T. Tada, P. N. Ross and N. M. Markovic, JACS, 2005, 127, 6819–6829 CrossRef PubMed.
- Y. Shao, G. Yin and Y. Gao, J. Power Sources, 2007, 171, 558–566 CrossRef CAS.
- S. Guo, S. Zhang and S. Sun, Angew. Chem., Int. Ed., 2013, 52, 8526–8544 CrossRef CAS PubMed.
- Z. S. And and S. Holdcroft, Macromolecules, 2004, 37, 2084–2089 CrossRef.
- J. J. Shi, X. J. Zhou, P. Xu, J. L. Qiao, Z. W. Chen and Y. Y. Liu, Electrochim. Acta, 2014, 145, 259–269 CrossRef CAS.
- A. Morozan, B. Jousselme and S. Palacin, Energy Environ. Sci., 2011, 4, 1238 CAS.
- A. Vinu, K. Ariga, T. Mori, T. Nakanishi, S. Hishita, D. Golberg and Y. Bando, Adv. Mater., 2015, 17, 1648–1652 CrossRef.
- J. Park, Y. Nabae, T. Hayakawa and M.-a. Kakimoto, ACS Catal., 2014, 4, 3749–3754 CrossRef CAS.
- D. Wang and D. Su, Energy Environ. Sci., 2014, 7, 576 CAS.
- Y. Li, Y. Zhao, H. Cheng, Y. Hu, G. Shi, L. Dai and L. Qu, J. Chem. Soc., 2012, 134, 15–18 CrossRef CAS PubMed.
- J. Liu, X. Sun, P. Song, Y. Zhang, W. Xing and W. Xu, Adv. Mater., 2013, 25, 6879–6883 CrossRef CAS PubMed.
- Z. Chen, D. Higgins, A. Yu, L. Zhang and J. Zhang, Energy Environ. Sci., 2011, 4, 3167–3192 CAS.
- V. Perazzolo, C. Durante, R. Pilot, A. Paduano, J. Zheng, G. A. Rizzi, A. Martucci, G. Granozzi and A. Gennaro, Carbon, 2015, 95, 949–963 CrossRef CAS.
- K. Elumeeva, N. Fechler, T. P. Fellinger and M. Antonietti, Mater. Horiz., 2014, 1, 588–594 RSC.
- M. J. Wu, E. G. Zhang, Q. P. Guo, Y. Z. Wang, J. L. Qiao, K. X. Li and P. C. Pei, Appl. Energy, 2016, 175, 468–478 CrossRef CAS.
- M. Wu, J. Qiao, K. Li, X. Zhou, Y. Liu and J. Zhang, Green Chem., 2016, 18, 2699–2709 RSC.
- M. Favaro, L. Ferrighi, G. Fazio, L. Colazzo, C. Di Valentin, C. Durante, F. Sedona, A. Gennaro, S. Agnoli and G. Granozzi, ACS Catal., 2015, 5, 129–144 CrossRef CAS.
- V. Perazzolo, E. Grądzka, C. Durante, R. Pilot, N. Vicentini, G. A. Rizzi, G. Granozzi and A. Gennaro, Electrochim. Acta, 2016, 197, 251–262 CrossRef CAS.
- W. Xia, J. Masa, M. Bron, W. Schuhmann and M. Muhler, Electrochem. Commun., 2013, 13, 593–596 CrossRef.
- H. Peng, Z. Mo, S. Liao, H. Liang, L. Yang, F. Luo, H. Song, Y. Zhong and B. Zhang, Sci. Rep., 2013, 3, 65 Search PubMed.
- G. Wang and P. Zelenay, Acc. Chem. Res., 2013, 46, 1878–1889 CrossRef PubMed.
- J. Zhang, D. He, H. Su, X. Chen, M. Pan and S. Mu, J. Mater. Chem. A., 2014, 2, 1242–1246 CAS.
- H. W. Liang, W. Wei, Z. S. Wu, X. Feng and K. Mullen, J. Am. Chem. Soc., 2013, 135, 16002–16005 CrossRef CAS PubMed.
- L. Zhang, J. Kim, E. Dy, S. Ban, K.-c. Tsay, H. Kawai, Z. Shi and J. Zhang, Electrochim. Acta, 2013, 108, 480–485 CrossRef CAS.
- R. Li, A. Cao, Y. Zhang, G. Li, F. Jiang, S. Li, D. Chen, C. Wang, J. Ge and C. Shu, ACS Appl. Mater. Interfaces, 2014, 6, 20574–20578 CAS.
- S. Yang, X. Feng, X. Wang and K. Mullen, Angew. Chem., Int. Ed., 2011, 50, 5339–5343 CrossRef CAS PubMed.
- G. Wu, C. M. Johnston, N. H. Mack, K. Artyushkova, M. Ferrandon, M. Nelson, J. S. Lezama-Pacheco, S. D. Conradson, K. L. More, D. J. Myers and P. Zelenay, J. Mater. Chem., 2011, 21, 11392 RSC.
- Y. Zhao, K. Watanabe and K. Hashimoto, J. Am. Chem. Soc., 2012, 134, 19528–19531 CrossRef CAS PubMed.
- H. Zhang, Y. Wang, D. Wang, Y. Li, X. Liu, P. Liu, H. Yang, T. An, Z. Tang and H. Zhao, Small, 2014, 10, 3371–3378 CrossRef CAS PubMed.
- L. Lai, J. R. Potts, D. Zhan, L. Wang, C. K. Poh, C. Tang, H. Gong, Z. Shen, J. Lin and R. S. Ruoff, Energy Environ. Sci., 2012, 5, 7936 CAS.
- X. Ge, A. Sumboja, D. Wuu, T. An, B. Li, F. W. T. Goh, T. S. A. Hor, Y. Zong and Z. Liu, ACS Catal., 2015, 5, 4643–4667 CrossRef CAS.
- Z. S. Wu, L. Chen, J. Liu, K. Parvez, H. Liang, J. Shu, H. Sachdev, R. Graf, X. Feng and K. Mullen, Adv. Mater., 2014, 26, 1450–1455 CrossRef CAS PubMed.
- Y. Zhang, X. Zhuang, Y. Su, F. Zhang and X. Feng, J. Mater. Chem. A, 2014, 2, 7742 CAS.
- W. Wei, H. Liang, K. Parvez, X. Zhuang, X. Feng and K. Mullen, Angew. Chem., 2014, 53, 1570–1574 CrossRef CAS PubMed.
- M. Favaro, F. Carraro, M. Cattelan, L. Colazzo, C. Durante, M. Sambi, A. Gennaro, S. Agnoli and G. Granozzi, J. Mater. Chem. A, 2015, 3, 14334–14347 CAS.
- Y. Tan, C. Xu, G. Chen, X. Fang, N. Zheng and Q. Xie, Adv. Funct. Mater., 2012, 22, 4584–4591 CrossRef CAS.
- L. Wang, A. Ambrosi and M. Pumera, Angew. Chem., Int. Ed., 2013, 52, 13818–13824 CrossRef CAS PubMed.
- X. J. Zhou, P. Xu, L. Xu, Z. Y. Bai, Z. W. Chen, J. L. Qiao and J. J. Zhang, J. Power Sources, 2014, 260, 349–356 CrossRef CAS.
| This journal is © The Royal Society of Chemistry 2017 |

