 Open Access Article
Rapid degradation of azo-dye using Mn–Al powders produced by ball-milling
W. Ben Mbareka,
M. Azaboua,
E. Pineda b,
N. Fiolc,
L. Escodad,
J. J. Suñol
 *d and
M. Khitounia
aLaboratoire de Chimie Inorganique, UR-11-Es-73, Faculté des Sciences de Sfax, University of Sfax, Tunisia
bUniversitatpolitècnica De Catalunya, Dept. Física i EnginyeriaNuclear, ESAB, 08660 Castelldefels, Spain
cUniversitat de Girona, P-II Campus Montilivi, 17071, Girona, Spain
dDep. deFisica, Universitat de Girona, Campus Montilivi, Girona 17071, Spain. E-mail: joanjosep.sunyol@udg.edu
First published on 22nd February 2017
Abstract
This study was conducted on the reduction reaction of the azo dye Reactive Black 5 by means of the Mn85Al15 particles prepared by melt-spinning and ball-milling processes. The morphology, the surface elementary composition and the phase structure of the powders were characterized by scanning electron microscopy, energy dispersive X-ray spectroscopy and X-ray diffraction. The degradation efficiency of the ball milled powder was measured by using an ultraviolet-visible absorption spectrophotometer and the collected powder was analyzed by means of Fourier transform infrared spectroscopy technique to characterize the functional groups in the extract. The degradation of Reactive Black 5 and the analysis of the aromatic by-products were investigated by high performance liquid chromatography coupled with tandem mass spectrometry. The ball-milled powder shows higher degradation efficiency and the Reactive Black 5 solution was completely decolorized after 30 min. The degradation kinetics and the formation by-products depend on the pH and temperature of the solution. The analyses of the extracted product confirmed the cleavage of the (–N![[double bond, length as m-dash]](https://www.rsc.org/images/entities/char_e001.gif) N–) bonds. Our findings are expected to pave the way for a new opportunity with regard to the functional applications of nanostructured metallic particles.
N–) bonds. Our findings are expected to pave the way for a new opportunity with regard to the functional applications of nanostructured metallic particles.
1. Introduction
Industrial water effluents with colorful contamination, including azo dyes, have received intensive concerns due to its potential carcinogenic effects.1,2 Different physico-chemical and biological approaches are employed for the removal of azo dyes from aqueous solutions, adsorption methods, biological degradation, coagulation processes, ozonation and hypochlorite treatment have been extensively exploited.3–6 However, all of these methods have disadvantages, namely that, for example, oxidation processes such as Fenton and photocatalyst are quite expensive; biological methods require time; flocculation and adsorption may be ineffective.7,8 Therefore, appropriate methods for the degradation of azo dyes must take into account rapid pre-treatment and advanced biological treatment. Moreover, it is important to explore low cost, abundant materials that have high efficiency in degrading the azo dyes. The reduction with zero-valent metals (ZVM), like iron, magnesium, zinc, nickel or aluminum has been investigated as a promising route because of its merits of low cost, rapid degradation efficiency, and convenient operation in practical applications.9–12 The surface activity of ZVM is of significant importance with regard to the degradation reaction of organic contaminants,13,14 since the degradation reaction involved a redox process in which surface metal atoms lose electrons to cleave the active bonds (such as –N![[double bond, length as m-dash]](https://www.rsc.org/images/entities/char_e001.gif) N– bonds) of organic molecules.9,13–21
N– bonds) of organic molecules.9,13–21
Therefore, various surface activation methods have been developed. The metals are generally used in powder form, which offers more active surface sites for the reactive degradation of organic molecules in comparison with the bulk material of the same weight. Besides, some routes of powder surface pretreatment, including acid washing, ultrasonic treatment,11 H2-reducing pretreatment20 and mechanical milling,21,22 have been applied to further increase the fractional concentration of active sites.
In particular, the catalytic activity of nanocrystalline metals and oxides was found strongly dependent on its crystallite size, specific surface area, morphologies, and textures.21–23 These characteristics can be improved by various techniques; one of the cheapest and easiest is the high energy ball milling technique. In the process of ball milling, the powder particles become trapped between ball and ball or between ball and walls of the jars. Therefore, there occurs severe plastic deformation producing stresses and strains. This creates a crystal lattice distortion and introduces many defects inside the particles, thus increasing their surface and lattice distortion energies. The obtained materials are in metastable state and this is responsible for many excellent properties that are unachievable in conventional alloys. The good chemical and catalytic properties of many nanostructured materials are well known examples of this fact.21–23 Indeed, the high density of defects and the intrinsic brittleness of these materials facilitate their subdivision into fine powders, and consequently a considerable increase in their specific surface areas. It has also been reported that dealloying of crystalline or amorphous alloys yields uniform nanoporous metals with high surface area.24–26
In the present study, we utilize the technique of melt spinning followed by ball milling in order to generate high active surface Mn85Al15 powders to improve degradation efficiency of Reactive Black 5. The effects of experimental variables such as temperature and solution pH were studied. Additionally, the reaction kinetics and the cleavage of the azo bonds were also investigated.
2. Experimental procedure
The alloy ingot with nominal composition of Mn85Al15 (at%) alloy was prepared by arc melting of a mixture of pure Mn (99.9 wt%) and Al (99.99 wt%) under a Ti-gettered argon atmosphere. This ingot was melted by induction heating18 and injected through a nozzle, with width of 0.8 mm, on a rotating copper wheel obtaining rapidly quenched ribbons with a thickness of 40 μm. The ribbon samples were then put into a ball-milling jar under Ar atmosphere. An inverse rotating direction was adopted to mill the samples and the speed of the jar upon ball milling was 500 rpm. After each 10 min of milling, a time of 5 min waiting interval was applied in order to avoid the sample heating and to prevent the powder sticking to the jar walls and the balls, as well as powder agglomeration. The total milling time was 15 hours.A scanning electron microscopy (SEM) in secondary electron mode operating at a voltage of 15 kV was used to examine the morphology of the ball milled (BM) powder. The SEM was equipped with an energy dispersive X-ray microanalysis system (EDX, Vega©Tescan).
The specific surface area of the MnAl powder was determined by the gas multilayer adsorption method according to the Brunauer, Emmett and Teller (BET) theory in a Micromeritics ASAP 2010 M apparatus. The measurements were carried out under nitrogen after degassing the powder at 300 °C for 24 hours.
Structural changes of the milled powders were characterized by X-ray diffraction (XRD) room temperature measurements on a Siemens D500 powder diffractometer using CuKα radiation (λCu = 0.15406 nm). The microstructural characteristics were derived from a full pattern XRD Rietveld fitting procedure.27,28
To evaluate the colorant degradation reaction an aqueous solution of Reactive Black 5 (named RB5) with a concentration of 40 mg L−1 was used. For each degradation experiment, 0.25 g BM powder was added into 100 mL of solution. Samples at different pH were prepared to check their effect on the degradation reaction. In this respect, the solution with pH = 3 by adding 1 M (CH3COOH), the solution with original pH = 6 and the solution with pH = 10 by adding 0.1 M (NaOH) were prepared. Samples of the solution were drawn out at regular time interval and centrifuged at 3000 rpm for 15 min by using a Rotanta 460 r centrifuge. The supernatants were separated and the color was measured at the maximum absorption wavelength for RB5 dye by means of an ultraviolet-visible absorption spectrophotometer, UV-Vis, (Shimadzu 2600 UV-visible). The powder collected after degradation was analyzed using Fourier transform infrared spectroscopy (FTIR) spectrum to determine the presence of functional groups in the extract. The pellets were prepared in each case with the same quantity of ground sample in KBr and the spectra were normalized for comparison between different samples. Prior to analysis of the dissolved Mn and Al components, samples were filtered through a 0.2 μ-membrane filter. Then, Mn and Al concentrations were analyzed by a flame atomic absorption spectrophotometer (A-2000, Hitachi) according to standard methods.29
The degradation of RB5 and the qualitative analysis of the aromatic by-products were investigated by high performance liquid chromatography (HPLC) coupled with tandem mass spectrometry (LC-MS/MS). The HPLC analyses were carried out using a Beckman Gold chromatograph fitted with a Proshell 120 Pheny Hexyl (4.6 × 150 mm × 2.7 μm) column at room temperature. The determination of the extent of dye abatement was conducted isocratically with the detector selected at λ = 220 and 311 nm using a 90![[thin space (1/6-em)]](https://www.rsc.org/images/entities/char_2009.gif) :
:![[thin space (1/6-em)]](https://www.rsc.org/images/entities/char_2009.gif) 10 (v/v) aqueous solution of ammonium acetate/methanol mixture as the mobile phase. A flow rate of 0.5 cm3 min−1 and injection volume of 0.2 cm3 was always used.
10 (v/v) aqueous solution of ammonium acetate/methanol mixture as the mobile phase. A flow rate of 0.5 cm3 min−1 and injection volume of 0.2 cm3 was always used.
3. Results and discussions
Fig. 1a and b illustrate the morphologies of the BM powder. It is clear that particle sizes show a relatively uniform distribution and some aggregation can be also seen. As noticed in the figure, their surfaces show many corrugations. Fig. 1c displays the size distribution of the powders and presents an average diameter of 4.15 μm. The EDX analysis result shown in Fig. 1d reveals that the as-produced BM particles are composed of only Mn and Al elements, with no significant traces of other elements, and the ratio of Mn to Al was approximately equal to 85![[thin space (1/6-em)]](https://www.rsc.org/images/entities/char_2009.gif) :
:![[thin space (1/6-em)]](https://www.rsc.org/images/entities/char_2009.gif) 15, which is in good agreement with the nominal composition of powder mixture.
15, which is in good agreement with the nominal composition of powder mixture.
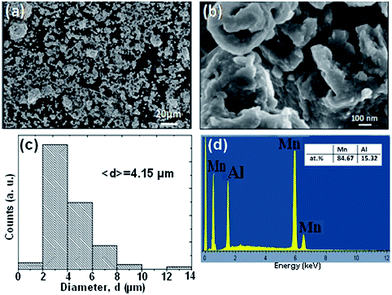 | ||
| Fig. 1 (a and b) Particle morphologies of the BM Mn85Al15 powder. (c) Distribution of particle sizes of the ball milled powders. (d) The nominal compositions as examined by EDX. | ||
Fig. 2 presents the image of RB5 solutions before and after being processed by BM Mn85Al15 powder at different degradation times at 25 °C. The solution is completely decolorized by the powder within 30 min. The UV-Vis spectrum changes as a function of reaction time at temperatures 25, 30, 40 and 50 °C are given in Fig. 3a–d, respectively. Before the treatment by BM powders, the maximum of absorbance located at λmax = 597 nm in the visible region arises from the “–N![[double bond, length as m-dash]](https://www.rsc.org/images/entities/char_e001.gif) N–” azo. As reported by Cao et al.30 and Nam and Tratnyek,31 the intensity of this peak denotes the azo dye concentration in the solution. The other two bands at 230 and 310 nm in the ultraviolet region are ascribed to the benzene and naphthalene rings, respectively, of the dye.32,33 The absorbance at λmax become weaker with degradation time, indicating the cleavage of the azo bands, formation of (–NH2) groups and, therefore, the decomposition of RB5 in the solution. On the other hand, this cleavage was confirmed by the increase of intensity of the absorbance peak at 246 nm. The same results have been reported by Zhang et al.17 in the case of reductive degradation of Acid orange II dye solution by Fe78(Si,B)22 amorphous ribbons.
N–” azo. As reported by Cao et al.30 and Nam and Tratnyek,31 the intensity of this peak denotes the azo dye concentration in the solution. The other two bands at 230 and 310 nm in the ultraviolet region are ascribed to the benzene and naphthalene rings, respectively, of the dye.32,33 The absorbance at λmax become weaker with degradation time, indicating the cleavage of the azo bands, formation of (–NH2) groups and, therefore, the decomposition of RB5 in the solution. On the other hand, this cleavage was confirmed by the increase of intensity of the absorbance peak at 246 nm. The same results have been reported by Zhang et al.17 in the case of reductive degradation of Acid orange II dye solution by Fe78(Si,B)22 amorphous ribbons.
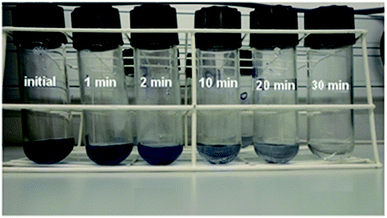 | ||
| Fig. 2 Image of Black 5 solutions processed by BM Mn85Al15 powder before and after degradation times up to 30 min at 25 °C. | ||
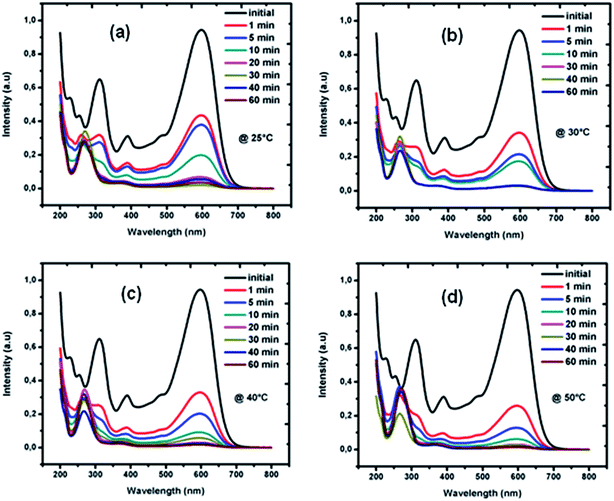 | ||
| Fig. 3 The changes of UV absorption spectra along with the treatment BM Mn85Al15 at different temperatures: (a) 25 °C, (b) 30 °C, (c) 40 °C and (d) 50 °C. | ||
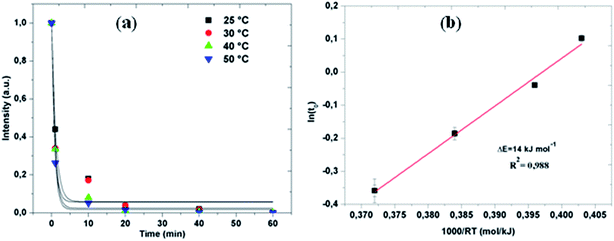
The evaluations of the reaction efficiency at different temperatures, which range from 25 to 50 °C, were shown in Fig. 4. Thus, a very high efficiency in the temperature of 50 °C was maintained by the degradation reaction (Fig. 4a). The decay behavior was fitted by an exponential function, I = I0 + I1e−t/t0,34 where I is the normalized intensity of the absorption peak, I0 and I1 are fitting constants, t is the degradation time, and t0 is the time at which the intensity is diminished to e−1 of the initial state and it was derived by fitting the data points. Considering a thermally activated process for the reaction, we can evaluate the thermal activation energy barrier ΔE with the Arrhenius-type equation, t0 = τ0![[thin space (1/6-em)]](https://www.rsc.org/images/entities/char_2009.gif) exp(ΔE/RT), where τ0 is a time pre-factor and R the gas constant. Fig. 4b presents the Arrhenius plots of ln(t0) as a function of 1/T for the degradation process of azo-day by using BM powder over the temperature range 25–50 °C. The estimated ΔE value is 14 ± 5 kJ mol−1. Considering the fact that the activation energies for ordinary thermal reactions are usually between 60 and 250 kJ mol−1,35 our result implies that the degradation of RB5 by the BM Mn85Al15 required a relatively low energy. The low activation energy combined with the rapid decolorization makes this material one of the most efficient for decolorization at ambient temperature conditions. Comparison of the reaction kinetics with the ones reported using other materials in literature is not easy. The diverse particle-weight/solution-volume ratios, types of dyes or initial concentrations used in other works makes this comparison difficult. Considering similar particle-weight/solution-volume ratios, the decolorization of azo dyes by microscale zero valent iron (ZVI) is significantly less efficient and slower,36 even if aided by reduction of pH, increase of temperature or other additional treatments like photo oxidation.37 Using 0.3 g/150 mL of ZVI particles in 50 mgL−1 RB5 aqueous solution, Rahmani et al.38 reported a reaction time with t0 = 30 min and final decolorization efficiency below 60%. Chompuchan et al.39 found t0 > 100 min using 0.25 g/100 mL of nanoscale ZVI (NZVI) in 100 mg L−1 RB5 aqueous solution.
exp(ΔE/RT), where τ0 is a time pre-factor and R the gas constant. Fig. 4b presents the Arrhenius plots of ln(t0) as a function of 1/T for the degradation process of azo-day by using BM powder over the temperature range 25–50 °C. The estimated ΔE value is 14 ± 5 kJ mol−1. Considering the fact that the activation energies for ordinary thermal reactions are usually between 60 and 250 kJ mol−1,35 our result implies that the degradation of RB5 by the BM Mn85Al15 required a relatively low energy. The low activation energy combined with the rapid decolorization makes this material one of the most efficient for decolorization at ambient temperature conditions. Comparison of the reaction kinetics with the ones reported using other materials in literature is not easy. The diverse particle-weight/solution-volume ratios, types of dyes or initial concentrations used in other works makes this comparison difficult. Considering similar particle-weight/solution-volume ratios, the decolorization of azo dyes by microscale zero valent iron (ZVI) is significantly less efficient and slower,36 even if aided by reduction of pH, increase of temperature or other additional treatments like photo oxidation.37 Using 0.3 g/150 mL of ZVI particles in 50 mgL−1 RB5 aqueous solution, Rahmani et al.38 reported a reaction time with t0 = 30 min and final decolorization efficiency below 60%. Chompuchan et al.39 found t0 > 100 min using 0.25 g/100 mL of nanoscale ZVI (NZVI) in 100 mg L−1 RB5 aqueous solution.
It must be noted here that although the specific surface per gram of material of nano-particle iron is expected to be 100–1000 larger than the expected for the micro-particle material studied here, the degradation kinetics are found similar. Metastable metallic glass particles produced by similar routes as the ones proposed here, like Fe–Mo–Si–B17 and Fe–Nb–Si–B20 showed t0 ∼ 7 min when applying 2 g/150 mL of particles in 100 mg L−1 Direct Blue dye solution. For the present study, the high reaction efficiency of the BM Mn85Al15 powder can be explained by the large specific surface area of the powder particles. It is well known that a relatively large surface area was retained in all catalysts.25,40 This specific surface area measured by the BET method was 0.55 m2 g−1. This property makes MnAl powder promising candidates for degradation of azo dyes.
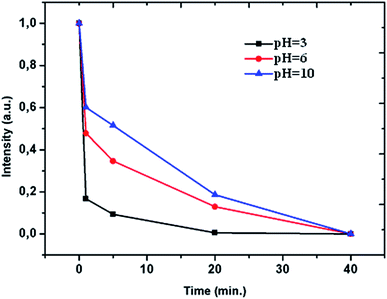
The effect of pH level on the degradation rate of azo-dye by BM Mn85Al15 powder was investigated both in acid pH (3 and 6) and alkaline pH = 10. The results were given in Fig. 5. It can be seen that at pH = 3, the degradation was the fastest in the beginning and at time of 20 min the efficiency of under the three pH conditions were different. Finally, at 40 min all of three conditions arrive at the same degradation. Also, it can be seen that the degradation efficiency increased with decreasing pH value. This phenomenon of degradation may be attributed to the redox reactions in acid solution. Furthermore, during the course of the experiment, there was an effervescence associate to the release of H2 gas. The mechanism proposed in acid medium was:
| Al → Al3+ + 3e− |
| Mn → Mn2+ + 2e− |
| 2H2O → H3O+ + OH− |
| 2H3O+ + 2e− → H2 + 2H2O |
| Al3+ + 3OH− → Al(OH)3 |
R–N![[double bond, length as m-dash]](https://www.rsc.org/images/entities/char_e001.gif) N–R′ + H2 → R–NH–NH–R′ N–R′ + H2 → R–NH–NH–R′ |
| R–NH–NH–R′ + H2 → R–NH2 + R′–NH2 |
The increase in the concentration of H3O+ significantly improves the anode reduction process, and then, the active H2 will attack azo dye molecules and thereby increase the degradation efficiency. Other authors have shown the influence of an acid environment in the process of reduction of the “–N![[double bond, length as m-dash]](https://www.rsc.org/images/entities/char_e001.gif) N–” bonds using different metallic alloys or ZVI as reducing agents. Wang et al.21 reported an acceleration of the degradation rate of azo dye solution by Mg–Zn based metallic glass powders due to an increase of the acidity. On the other hand, Zhang et al.41 concluded that, although weakly acidic and circum-neutral initial pH favored degradation, side effects to the decolorization process of the Acid orange II solution were caused by too strongly acidic initial pH. Chompuchan et al.39 also studied the effect of pH on Reactive Black 5 and Red 198 decolorations by nanoscale zero-valent iron. They reported that at pH = 5, the decolorization efficiencies of both dyes were reached 100% after 120 min treatment. Similarly, Chang et al.42 concluded that reducing pH to 2.1, 3.0 and 4.0 for Acid Black 24 removal using synthesized nanoscale ZVI particles by addition of hydrochloric acid (1.0 mol L−1) resulted in the significant elevation of decolorization to more than 46.5% of the original pH.
N–” bonds using different metallic alloys or ZVI as reducing agents. Wang et al.21 reported an acceleration of the degradation rate of azo dye solution by Mg–Zn based metallic glass powders due to an increase of the acidity. On the other hand, Zhang et al.41 concluded that, although weakly acidic and circum-neutral initial pH favored degradation, side effects to the decolorization process of the Acid orange II solution were caused by too strongly acidic initial pH. Chompuchan et al.39 also studied the effect of pH on Reactive Black 5 and Red 198 decolorations by nanoscale zero-valent iron. They reported that at pH = 5, the decolorization efficiencies of both dyes were reached 100% after 120 min treatment. Similarly, Chang et al.42 concluded that reducing pH to 2.1, 3.0 and 4.0 for Acid Black 24 removal using synthesized nanoscale ZVI particles by addition of hydrochloric acid (1.0 mol L−1) resulted in the significant elevation of decolorization to more than 46.5% of the original pH.
Under alkaline conditions, the degradation was observed when pH value was 10 (∼100% efficiency in 40 min). During the degradation process, the Al atoms lose electrons that reduce H2O giving hydrogen gas and hydroxyl ions, OH−. The hydrogen gas, obtained in the process of reducing water, attacks the “–N![[double bond, length as m-dash]](https://www.rsc.org/images/entities/char_e001.gif) N–” bonds in two stages to obtain aromatic amines. However, a major obstacle to the production of hydrogen is that the aluminum surface is easily passivated, but this phenomenon can be minimized by different experimental parameters such as alkali concentration.42 A large number of Al(OH)3 precipitate will adhere on the surface of Mn–Al alloys and thus prevent the degradation of the RB5, but with increasing of pH value, the increased OH− concentration would lead Al(OH)3 precipitate turn to dissolvable [Al(OH)4]−, thus improving the degradation efficiency.42 The mechanism in basic medium proposed by Soler et al.:43
N–” bonds in two stages to obtain aromatic amines. However, a major obstacle to the production of hydrogen is that the aluminum surface is easily passivated, but this phenomenon can be minimized by different experimental parameters such as alkali concentration.42 A large number of Al(OH)3 precipitate will adhere on the surface of Mn–Al alloys and thus prevent the degradation of the RB5, but with increasing of pH value, the increased OH− concentration would lead Al(OH)3 precipitate turn to dissolvable [Al(OH)4]−, thus improving the degradation efficiency.42 The mechanism in basic medium proposed by Soler et al.:43
| Al → Al3+ + 3e− |
| Mn → Mn2+ + 2e− |
| 2H2O + 2e− → 2OH− + H2 |
| Al3+ + 3OH− → Al(OH)3 |
| Al(OH)3 + OH− → [Al(OH)4]− |
R–N![[double bond, length as m-dash]](https://www.rsc.org/images/entities/char_e001.gif) N–R′ + H2 → R–NH–NH–R′ N–R′ + H2 → R–NH–NH–R′ |
| R–NH–NH–R′ + H2 → R–NH2 + R′–NH2 |
In conclusion, an alkaline environment appears favorable for the degradation of the RB5 solution using the Mn–Al alloy system. After completion of the decolorization reaction, all solutions have a pH above 7 even the solution with an initial acid pH = 3. This result has a very practical meaning as it is not necessary to add an acid to the initially alkaline textile industrial wastewater before treatment. Cationic metals concentrations obtained from absorption spectrometry were 2.30 mg L−1 and <0.59 mg L−1 (detection limit) for Mn and Al, respectively. Thus, Al precipitation as Al(OH)3 was confirmed.
High resolution SEM was used to observe the surface of the powder particles. The obtained micrographs are provided in Fig. 6, which demonstrates that the reaction products are nano-bristles uniformly distributed on all surface of the BM Mn85Al15 particles. Zhang et al.44 found similar results. These nano-bristles are mainly composed of the Al element and many corrosion pits were observed on the alloys surface, which indicates the pitting corrosion on alloy particles took place during the process of RB5 degradation. It has been acknowledged that corrosion of Al-based alloy depends on the damage of passive film like Al2O3. Also, pitting corrosion is thought to be one of the principal mechanisms for the degradation of the RB5. The aluminum oxide acts as an acid or basic agent depending on the environment. The result is the formation of Al(OH)3 and [Al(OH)4]−, respectively. In particular, when the local pH value around the Mn–Al alloy particles increased (pH > 7), the dissolution of Al(OH)3 film is caused by the excess of OH−, consequently the metal surface is exposed directly to water allowing the reaction progress.
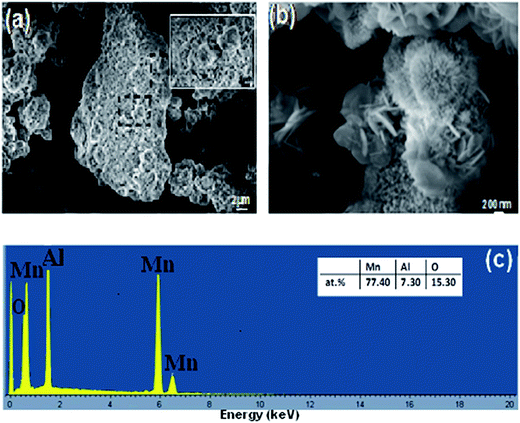 | ||
| Fig. 6 (a and b) Surface morphologies of the BM Mn85Al15 powder particles after degradation of Reactive Black 5 and (c) the nominal compositions as examined by EDX. | ||
Also, the EDX analysis (insert of Fig. 6c) showed that the ratio of the manganese and aluminum dropped down under the strong corrosion environments. The results evidence the alloy corrosion was initiated by pitting corrosion, and with the degradation reaction, anodic Al dissolves into the solution. This can be attributed to the fact that the surface characteristics at the nanoscale yield a high activity in the reaction and therefore they improve the degradation efficiency. Correspondingly, Weng et al.20 found the same results for rapid degradation of azo dye by Fe73Si7B17Nb3 glass powder and they reported that the reaction activity may also be facilitated by the strong residual stress and stored plastic deformation energy. In their other work,21 they found, for the reacted Mg73Zn21.5Ca5.5 glassy powder particles, that the reaction products in form of nano-whiskers were distributed uniformly and loosely on the surface of the particles. Furthermore, Luo et al.45 observed that, for BM Mg65Cu25Y10 powder, reacted with azo dye solution, flower-like products of the reaction cover the whole surface. The EDX analysis (inset of Fig. 6c) indicates that the nano-bristles-like product is mainly composed of the Mn, Al and O elements and the ratio of Mn to Al and O was approximately equal to 78![[thin space (1/6-em)]](https://www.rsc.org/images/entities/char_2009.gif) :
:![[thin space (1/6-em)]](https://www.rsc.org/images/entities/char_2009.gif) 7
7![[thin space (1/6-em)]](https://www.rsc.org/images/entities/char_2009.gif) :
:![[thin space (1/6-em)]](https://www.rsc.org/images/entities/char_2009.gif) 16.
16.
The phase structures of all of the Mn–Al samples before and after degradation reaction were evaluated by XRD technique. The obtained results are presented in Fig. 7. The pattern of the BM powder before degradation reaction shows clear diffraction peaks from β-Mn(Al) solid solution (JCPD 01-089-4086) with space group P4132.46,47 The average crystallite size of 15 ± 2 nm of the β-Mn(Al) solid solution were calculated from X-ray line broadening of the reflections using the well-known Scherrer formula:35
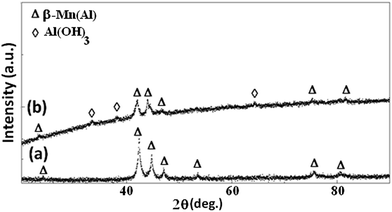 | ||
| Fig. 7 The XRD curves of the (a) BM Mn85Al15 powder before and (b) after degradation of Reactive Black 5. | ||
This internal nanocrystalline structure is expected to increase the grain boundary volume fraction with a subsequent effect of enhancing the solid-state diffusivity during milling and facilitating the formation of β-Mn(Al) solid solution.45 On the other hand, the inspection of the XRD diffraction pattern of the BM powder after the reaction gives a crystallite size of 13 ± 2 nm, and reveals the appearance of three additional shape diffraction peaks, indexed as Al(OH)3 phase (JCPD 00-003-0915) (Fig. 6b). Therefore, the nano-bristles-like products mainly consist of Al(OH)3 phase.44 The FTIR spectrums of Reactive Black 5 powder before and after degradation reaction are given in Fig. 8a and b. In recent work, Yang et al.,40 worked on degradation of the ability of biosorbents derived from dead fungal biomass to remove RB5 from aqueous solution, and found that all shifts in the FTIR spectra indicated that –NH2, carboxylic groups and –OH were the main functional groups that are responsible for binding RB5. Besides, Poursaberi et al.,48 Wang et al.49 and Méndez-Martínez et al.,50 studied the degradation of the RB5 solution by using ionic liquid grafted-magnetic nanoparticles and electrochemical reduction and oxidation methods, respectively, and they found the same functional groups. In the present work, considerable changes were observed in both figures when the 1800–1400 cm−1 and 1200–600 cm−1 regions were compared. The bands at 3444 and 3421 cm−1 (N–H stretching), 1086 and 1042 cm−1 (C–N stretching) and 1584 cm−1 (N–H bending) in Fig. 8b indicate the presence of a primary amine as a result of the reductive cleavage of the “–N![[double bond, length as m-dash]](https://www.rsc.org/images/entities/char_e001.gif) N–” bond. The same results have been found by Méndez-Martínez et al.50 for the solid extract obtained after electrochemical treatment of RB5 solution. Furthermore, this result is in line with the disappearance of the band at 1495 cm−1 (“–N
N–” bond. The same results have been found by Méndez-Martínez et al.50 for the solid extract obtained after electrochemical treatment of RB5 solution. Furthermore, this result is in line with the disappearance of the band at 1495 cm−1 (“–N![[double bond, length as m-dash]](https://www.rsc.org/images/entities/char_e001.gif) N–” stretching) of (Fig. 8a) in the spectrum corresponding to the extract of the reacted sample of Fig. 8b; thus, confirming the abovementioned UV-Vis results (see Fig. 3) concerning the cleavage of the azo bonds. Additionally, the extract exhibits the same antisymmetric and symmetric C–H stretching vibrations at about 2928 and 2853 cm−1, respectively, of the –CH2 groups in the short hydrocarbon chains of the by-products and the RB5 molecule.
N–” stretching) of (Fig. 8a) in the spectrum corresponding to the extract of the reacted sample of Fig. 8b; thus, confirming the abovementioned UV-Vis results (see Fig. 3) concerning the cleavage of the azo bonds. Additionally, the extract exhibits the same antisymmetric and symmetric C–H stretching vibrations at about 2928 and 2853 cm−1, respectively, of the –CH2 groups in the short hydrocarbon chains of the by-products and the RB5 molecule.
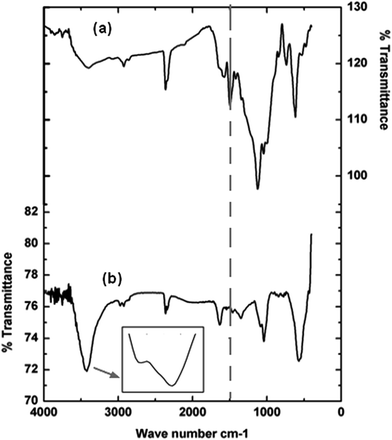 | ||
| Fig. 8 (a) FTIR spectra of RB5 powder before degradation reaction and (b) FTIR spectra of BM Mn85Al15 powder after degradation of Reactive Black 5. | ||
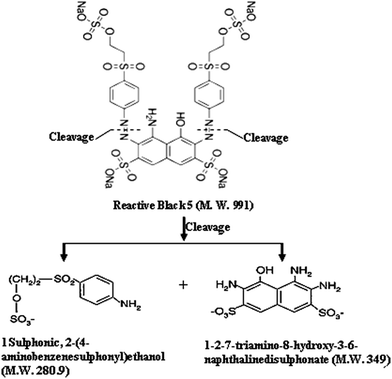
Fig. 9a shows the HPLC chromatogram of the RB5 dye in solution before degradation. It consists of a broad peak eluting between 12.3–12.5 min. The corresponding mass spectra at λ = 311 and 220 nm are presented in Fig. 9b and c, respectively. As shown, it can be observed that the major peaks of the dye RB5 correspond with a molecular weight of 822, 991 and 1061. The peak at 911 has been also reported by Shilpa et al.51 and Patel et al.52 These peaks probably correspond to the dye hydrolysis of the dye (molecular weight 991) and all them disappear after decolorization (it can be seen in Fig. 10) due to cleavage of azo bonds. Fig. 10 shows the LC-MS analyses of the extracted solution after degradation reaction showing several peaks at retention times 9.1, 9.6, 10.1, 10.7, 11.1, 11.7, 14.6, 14.9, 15.1, 16.6 and 16.9 min. No peak corresponding to retention time corresponding to that of the parent dye compound was observed. Moreover, the analyses of the major peaks eluting between 9.1–16.9 min demonstrate the presence of two signals at 349 and 280.1 m/z related to amine end products, namely, 1-2-7-triamino-8-hydroxy,3-6-naphthalinedisulphonate and 1-sulphonic,2-(4-aminobenzenesulphonyl)ethanol, as shown in Fig. 11. These results suggest that the formation of aromatic amines result from the decolorization dye that proceeds via the reductive cleavage of azo bonds. This can be detected from the appearance of signals at 246.2, 202.1 m/z, corresponding to aromatic amines produced after the partial or complete cleavage of the “–N![[double bond, length as m-dash]](https://www.rsc.org/images/entities/char_e001.gif) N–” bonds. Patel et al.52 also confirmed the reductive cleavage of azo bonds in the dye molecule by using the Mg–Pd system. After complete decolorization, they found two signals at 349 and 280.9 m/z ascribed to amine end products. Furthermore, Plum et al.53 and Gosetti et al.54 found similar results for the anaerobic biodegradation of RB5 dye and ascorbic acid mediated degradation of sunset yellow FCF, respectively.
N–” bonds. Patel et al.52 also confirmed the reductive cleavage of azo bonds in the dye molecule by using the Mg–Pd system. After complete decolorization, they found two signals at 349 and 280.9 m/z ascribed to amine end products. Furthermore, Plum et al.53 and Gosetti et al.54 found similar results for the anaerobic biodegradation of RB5 dye and ascorbic acid mediated degradation of sunset yellow FCF, respectively.
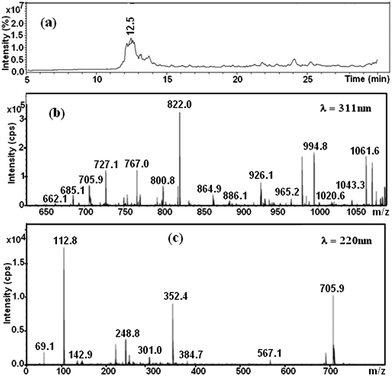 | ||
| Fig. 9 (a) HPLC elution profile of the native Black 5 dye and mass spectrums of the peak from 12.5 min at (b) λ = 311 nm and (c) λ = 220 nm. | ||
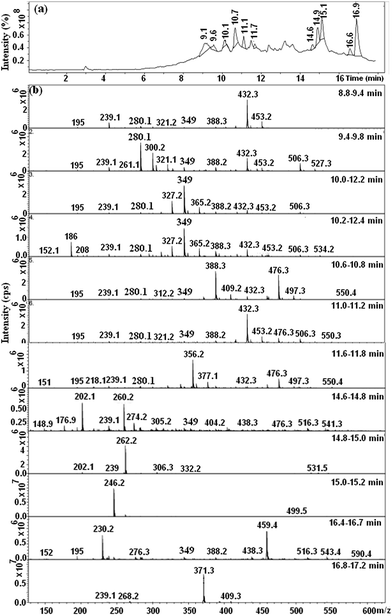 | ||
| Fig. 10 (a) HPLC elution profiles after degradation of the RB5 dye and (b) mass spectrums of peaks from 8.8 to 17.2 min. | ||
4. Conclusions
The BM powder Mn85Al15 was successfully fabricated by melt spinning and ball milling methods. Its efficiency and reaction kinetics in degrading organic chemicals were systematically investigated by evaluating their decolorization capability in a Reactive Black 5 aqueous solution. The BM powder exhibits excellent degradation efficiency. It can completely decompose the “–N![[double bond, length as m-dash]](https://www.rsc.org/images/entities/char_e001.gif) N–” bonds. The higher efficiency of BM powder was associated with its large surface area of many nanoscale corrugations. Furthermore, the thermal activation energy barrier ΔE is low, (14 ± 5 kJ mol−1) and the maximum efficiency was observed at pH = 3 (∼99% in 20 min). The low activation energy and the rapid degradation kinetics observed in this system make it promising as a low-cost, efficient material for textile-waters discoloration treatments.
N–” bonds. The higher efficiency of BM powder was associated with its large surface area of many nanoscale corrugations. Furthermore, the thermal activation energy barrier ΔE is low, (14 ± 5 kJ mol−1) and the maximum efficiency was observed at pH = 3 (∼99% in 20 min). The low activation energy and the rapid degradation kinetics observed in this system make it promising as a low-cost, efficient material for textile-waters discoloration treatments.
Acknowledgements
Financial support of MPCUdG2016/045 project is acknowledged. E. P. acknowledges financial support from MINECO (FIS2014-54734-P) and Generalitat de Catalunya (2014SGR581).References
- N. K. Amin, J. Hazard. Mater., 2009, 165, 52–62 CrossRef CAS PubMed
.
- T. Yahagi, M. Degawa, Y. Seino, T. Matsushima, M. Nagao, T. Sugimura and Y. Hashimoto, Cancer Lett., 1975, 1, 91–96 CrossRef CAS PubMed
.
- A. Asghar, A. A. Abdul Raman and W. M. A. Wan Daud, J. Cleaner Prod., 2015, 87, 826–838 CrossRef CAS
.
- T. A. Khan, S. Dahiya and I. Ali, Appl. Clay Sci., 2012, 69, 58–66 CrossRef CAS
.
- W. J. Tseng and R. D. Lin, J. Colloid Interface Sci., 2014, 428, 95–100 CrossRef CAS PubMed
.
- X. D. Qin, Z. W. Zhu, G. Liu, H. M. Fu, H. W. Zhang, A. M. Wang, H. Li and H. F. Zhang, Sci. Rep., 2015, 5, 18226 CrossRef CAS PubMed
.
- W. Wang, Y. Cheng, T. Kong and G. Cheng, J. Hazard. Mater., 2015, 299, 50–58 CrossRef CAS PubMed
.
- S. Xie, P. Huang, J. J. Kruzic, X. Zeng and H. A. Qian, Sci. Rep., 2016, 6, 21947 CrossRef CAS PubMed
.
- F. Wu, N. S. Deng and H. L. Hua, Chemosphere, 2000, 41, 1233–1238 CrossRef CAS
.
- J. Fan, Y. H. Guo, J. J. Wang and M. H. Fan, J. Hazard. Mater., 2009, 166, 904–910 CrossRef CAS PubMed
.
- M. Kumar and S. Chakraborty, J. Hazard. Mater., 2006, 135, 112–121 CrossRef CAS PubMed
.
- C. Noubactep, J. Hazard. Mater., 2010, 181, 1170–1174 CrossRef CAS PubMed
.
- J. Gotpagar, S. Lyuksyutov, R. Cohn, E. Grulke and D. Bhattacharyya, Langmuir, 1999, 15, 8412–8420 CrossRef CAS
.
- N. Ruiz, S. Seal and D. Reinhart, J. Hazard. Mater., 2000, 80, 107–117 CrossRef CAS PubMed
.
- J. S. Cao, L. P. Wei, Q. G. Huang, L. S. Wang and S. K. Han, Chemosphere, 1999, 38, 565–571 CrossRef CAS PubMed
.
- S. Agarwal, S. R. Al-abed and D. D. Dionysiou, Environ. Sci. Technol., 2007, 41, 3722–3727 CrossRef CAS PubMed
.
- C. Q. Zhang, H. F. Zhang, M. Q. Lv and Z. Q. Hu, J. Non-Cryst. Solids, 2010, 356, 1703–1706 CrossRef CAS
.
- C. Q. Zhang, Z. W. Zhu, H. F. Zhang and Z. Q. Hu, Chin. Sci. Bull., 2011, 56, 3988–3992 CrossRef CAS
.
- B. Lin, X. F. Bian, P. Wang and G. P. Luo, Mater. Sci. Eng., B, 2012, 177, 92–95 CrossRef CAS
.
- Y. H. Liou, S. L. Lo, C. J. Lin, C. Y. Hu, W. H. Kuan and S. C. Weng, Environ. Sci. Technol., 2005, 39, 9643–9648 CrossRef CAS PubMed
.
- J. Q. Wang, Y. H. Liu, M. W. Chen, G. Q. Xie, D. V. Louzguine-Luzgin, A. Inoue and J. H. Perepezko, Adv. Funct. Mater., 2012, 22, 2567–2570 CrossRef CAS
.
- J. Q. Wang, Y. H. Liu, M. W. Chen, D. V. Louzguine-Luzgin, A. Inoue and J. H. Perepezko, Sci. Rep., 2012, 2, 418 Search PubMed
.
- B. B. Sapkota and S. R. Mishra, J. Nanosci. Nanotechnol., 2013, 13, 6588–6596 CrossRef CAS PubMed
.
- X. K. Luo, R. Li, Z. Q. Liu, L. Huang, M. J. Shi, T. Xu and T. Zhang, Mater. Lett., 2012, 76, 96–99 CrossRef CAS
.
- X. K. Luo, R. Li, L. Huang and T. Zhang, Corros. Sci., 2013, 67, 100–108 CrossRef CAS
.
- J. Erlebacher, M. J. Aziz, A. Karma, N. Dimitrov and K. Sieradzki, Nature, 2001, 410, 450–453 CrossRef CAS PubMed
.
- L. Lutterotti and S. Gialanella, Acta Mater., 1998, 46, 101–110 CrossRef CAS
.
- H. M. Rietveld, J. Appl. Crystallogr., 1969, 2, 65–71 CrossRef CAS
.
- APHA AWWA, Standard methods for examination of water and wastewater, American Public Health Association/American Water Works Association/Water Environment Federation, Washington, DC, 20th edn, 1998, pp. 3–17 Search PubMed
.
- J. Cao, L. Wei, Q. Huang, L. Wang and S. Han, Chemosphere, 1999, 38, 565–571 CrossRef CAS PubMed
.
- S. Nam and P. G. Tratnyek, Water Res., 2000, 34(6), 1837–1845 CrossRef CAS
.
- F. Wu, N. Deng and H. Hua, Chemosphere, 2000, 4, 1233–1238 Search PubMed
.
- M. Stylidi, D. I. Kondarides and X. E. Verykios, Appl. Catal., B, 2003, 40, 271–286 CrossRef CAS
.
- H. Y. Shu, M. C. Chang, H. H. Yu and W. H. Chen, J. Colloid Interface Sci., 2007, 314(1), 89–97 CrossRef CAS PubMed
.
- J. X. Chen and L. Z. Zhu, Catal. Today, 2007, 126(3–4), 463–470 CrossRef CAS
.
- S. Samiee, E. Goharshadi and P. Nancarrow, J. Taiwan Inst. Chem. Eng., 2016, 67, 406–417 CrossRef CAS
.
- W. Feng, D. Nansheng and H. Helin, Chemosphere, 2000, 41, 1233–1238 CrossRef CAS PubMed
.
- A. R. Rahmani, M. Zarrabi, M. R. Samarghandi, A. Afkhami and H. R. Ghaffari, Iran. J. Chem. Chem. Eng., 2010, 7, 87–94 Search PubMed
.
- C. Chompuchan, T. Satapanajaru, P. Suntornchot and P. Pengthamkeerati, Int. J. Metall. Mater. Sci. Eng., 2009, 3(1), 7–11 Search PubMed
.
- Y. Y. Yang, Z. L. Li, G. Wang, X. P. Zhao, D. E. Crowley and Y. H. Zhao, PLoS One, 2012, 7, 1–8 CrossRef
.
- C. Q. Zhang, Z. W. Zhu, H. F. Zhang and Z. Q. Hu, J. Environ. Sci., 2012, 24(6), 1021–1026 CrossRef CAS
.
- M. C. Chang, H. Y. Shu, H. H. Yu and Y. C. Sung, J. Chem. Technol. Biotechnol., 2006, 81, 1259–1266 CrossRef CAS
.
- L. Soler, J. Macanás, M. Muñoz and J. Casado, J. Power Sources, 2007, 169(1), 144–149 CrossRef CAS
.
- L. Zhang, X. Gao, Z. Zhang, M. Zhang, Y. Cheng and J. Su, Sci. Rep., 2016, 6(1797), 1–13 Search PubMed
.
- X. Luo, R. Li, J. Zong, Y. Zhang, H. Li and T. Zhang, Appl. Surf. Sci., 2014, 305, 314–320 CrossRef CAS
.
- S. Ibrahim, A. M. Shamah, Y. M. Abbas, F. F. Hanna, L. K. Marei and A. Hannora, Egypt J. Solid., 2005, 28, 315–323 Search PubMed
.
- H. Nakamuray, K. Yoshimotoyx, M. Shigay, M. Nishiz and K. Kakuraiz, J. Phys.: Condens. Matter, 1997, 9, 4701–4728 CrossRef
.
- T. Poursaberi and M. Hassanisadi, Clean: Soil, Air, Water, 2013, 41, 1208–1215 CrossRef CAS
.
- Y. Wang, J. Wang, H. Zou and Y. Xie, RSC Adv., 2016, 6, 15394–15401 RSC
.
- A. J. Méndez-Martínez, M. M. Dávila-Jiménez, O. Ornelas-Dávila, M. P. Elizalde-González, U. Arroyo-Abad, I. Sirésand and E. Brillas, Electrochim. Acta, 2012, 59, 140–149 CrossRef
.
- S. Shilpa and R. Shikha, J. Environ. Sci., 2015, 4, 44–53 CAS
.
- R. Patel and S. Suresh, J. Hazard. Mater., 2006, 137, 1729–1741 CrossRef CAS PubMed
.
- A. Plum, G. Braun and A. Rehorek, J. Chromatogr. A, 2003, 987, 395–402 CrossRef CAS PubMed
.
- F. Gosetti, V. Gianotti, S. Polati and M. C. Gennaro, J. Chromatogr. A, 2005, 1090, 107–115 CrossRef CAS PubMed
.
| This journal is © The Royal Society of Chemistry 2017 |

