 Open Access Article
Creative Commons Attribution 3.0 Unported Licence
Experimental and kinetic studies of coal–CO2 gasification in isothermal and pressurized conditions
Lang Liu *ab,
Yan Cao*b,
Qingcai Liuc and
Jian Yangc
aGuizhou Institute of Technology, Chemical Engineering Institute, Guiyang, Guizhou 550003, China. E-mail: l.liu.git@qq.com
bInstitute for Combustion Science and Environmental Technology, Chemistry Department, Western Kentucky University, Bowling Green, KY 42101, USA. E-mail: yan.cao@wku.edu
cCollege of Material Science & Engineering, Chongqing University, Shapingba, Chongqing 400044, China
First published on 12th January 2017
Abstract
This study is to explicate the reaction mechanisms and kinetics of high-pressure char CO2 gasification via a joint experimental and model simulation approach. The high-pressure char–CO2 gasification reactions were studied experimentally using a high pressure thermo-gravimetric analyzer (HP-TGA). The results showed that the char CO2 gasification rate experienced an initially slow increase until the carbon conversion reached 0.6 (Zone I), when a rapid increase in the carbon conversion increased to 0.9 (Zone II). Further gasification reaction, corresponding to a carbon conversion efficiency above 0.9 (Zone III), finally, presented a sharp decrease in kinetics. For more accurate interpretation of the experimental char–CO2-gasification kinetics and mechanisms, we found a proven kinetic model could be derived based on the random pore model and mixed model, which specifically predicate the studied gasification reaction and its critical kinetics parameters of the Zone I and II, respectively. The developed kinetics model, assembling major parameters (including char structures, pressure order, reaction order, activation energy and pre-exponential factor) was found to be in good agreement with the experimental results, covering wide realistic gasification operation conditions. This study revealed an optimal carbon conversion range with rational gasification kinetics, which can be estimated based on an accurate kinetics model.
1. Introduction
Chemical looping combustion and gasification (CLC&G) have been suggested to be one of the most promising technologies of the inherent separation of CO2 with a reduced energy penalty. Oxygen carriers, replacing air, are used as an oxygen source, thus preventing mixing of nitrogen into the CO2 stream. Recently, several investigations have focused on the use of solid fuel (such as coal) as the potential fuels in the CLC&G system.1–6 There are two potential reaction paths between the oxygen carrier and coal: a direct reaction between oxygen carriers and solid fuels, and an indirect reaction between the oxygen carriers and gaseous intermediates (syngas) from the gasification of solid fuels. Indirect reduction has been identified as the major reaction path between oxygen carriers and solid fuels because of the low contact efficiency between coal and oxygen carriers, solid–solid reactions occur in the direct reaction path. Therefore, the char gasification is the rate-determining process in the coal-direct chemical looping combustion and gasification. Therefore, it is important to investigate and further improve to the kinetics of the char gasification in the CLC&G system.The general approach to improve the kinetics of the char gasification is the high temperature and pressurized operations.7 Many factors have been proved to affect kinetics of coal char gasification, including char ranks, particle sizes, temperatures, the partial pressures of the reactant gases and the total system pressure, as well as gasification agents (likely O2, H2O and/or CO2).8–12 The water is the mostly used gasification agent, which is more reactive than CO2. However, water is also resource-limited and energy-intensive than CO2. The exploration to use CO2 as gasification agent may contribute to reduce the dependence of water usage in the coal gasification process, and thus is significant in the industry gasification application. Recently, experimentally the CO2 gasification mechanisms have been investigated,13–20 and their regular empirical reaction models have been addressed, such as the volume model,21 the hybrid model22 and the random pore model.19,23–26 Among of these kinetic models, the random pore model seemed the most practical one, addressing the growth and coalescence of the char structure during the char gasification process. However, it is feasible to describe the maximum reaction rate at low conversion levels, but difficult to explain the intrinsic reaction rate throughout the char gasification. For example, Roberts et al.13,16,27,28 studied factors such as temperature, pressure, the gasification agent and CO inhibition, on the intrinsic reaction rate of the char gasification. They assumed the intrinsic reaction rate can be found and studied when the char carbon conversion was around 0.1. The intrinsic reaction rate of the gasification is one when a chemical-reaction controlling condition is applied. Models that are used to predict high temperature char gasification behavior usually have a chemical reaction component that accounts for the variation in intrinsic reaction rate with operating temperature and pressure. This component is usually combined with the analysis of the effects of the surface chemical reaction rate and pore diffusion limitations to arrive at an overall gasification rate over a wide range of temperatures.
In our previous paper,29 the high-pressure char–CO2 gasification reactions were studied experimentally using a high pressure thermo-gravimetric analyzer (HP-TGA). The results showed that the gasification rate initially experienced a slow increase, and followed by a rapid increase, and finally a decrease corresponding to increasing the carbon conversion efficiency. Also, the structural and crystalline features of gasified chars at different conversions efficiencies are well characterized using BET, XRD, Raman spectroscopy, FTIR and SEM. It was found that the char structure changes of interest were generally accepted as having major impacts on kinetics of char gasification, especially for the slow CO2 gasification process. Authors, in this manuscript, attempted to demonstrate this type of interaction between char kinetics and physical and chemical properties of char. But, the complete kinetics models regarding the kinetics of the selected coal have not been presented in our previous paper.
This paper was focused on the chemical reaction component of such models, and how it can be practically applied while still accurately describing the intrinsic reactivity behavior of chars throughout the gasification process over a wide range of operating temperature and pressure.
The primary objective of this paper was to develop a practical combined model to present the intrinsic reaction kinetics of the char gasification using CO2 as the gasification agent under the elevated temperatures and pressures by. Experiments have been carried out in a pressurized thermo-gravimetric analyzer. The temperature range was controlled isothermally between 950 to 1150 °C, and pressure between up to 3.0 MPa.
2. Experimental and model method development
2.1 Materials
A Kentucky Bituminous coal was used in the experiments; the proximate analyses and ultimate analysis of the selected coal are listed in the Table 1, and the coal particles were sieved to around 200 μm in this study. The experiments were carried out consecutively in the pressurized thermo-gravimetric analyzer (TGA-HP150S), which has been described in our previous studies.29,30 In the experiment, 500 mg coal char was added in a crucial boat, firstly pressured to the designed pressure, heated in N2 at 1000 mL min−1 to a reaction temperature with the rate of 20 °C min−1, and then isothermal for half an hour under the nitrogen atmosphere. After the char preparation process, the gas was switched to CO2 with the concentration of 25% and 100% by mole at 1000 mL min−1. The TGA collected the mass of the samples at different times automatically during the char gasification process.| Proximate analysis | Ultimate analysis (dry basis) | ||||||||
|---|---|---|---|---|---|---|---|---|---|
| Moisture | Fixed carbon | Volatiles | Ash | C | H | N | O | S | |
| Coal | 5.06 | 49.46 | 35.02 | 10.46 | 65.52 | 4.52 | 1.43 | 13.94 | 3.57 |
According to the data from the thermo-gravimetric analyzer, the carbon conversion efficiency (x(t)) of char defined as the ratio of the gasified char at any time t to the initial char can be calculated as
 | (1) |
The intrinsic reaction rates (ρ) were calculated as
 | (2) |
2.2 Kinetic analysis
| C + CO2 ↔ C(O) + CO, k1, k2 | (3) |
| C(O) → CO, k3 | (4) |
The intrinsic reaction rates (ρ) were described by the Langmuir–Hinshelwood rate equation:
 | (5) |
In the experiments, PCO2 ≫ PCO and the influence of CO on the reaction is little. So the partial pressure of CO can be ignored in our experiment, and the eqn (5) was simplified to become
 | (6) |
So, the value for k1/k3 (the intercept divided by the gradient) can be got by charting 1/ρ versus 1/PCO2.
The overall reaction rate is24
 | (7) |
 | (8) |
ψ is the structural parameter characteristic of the initial char structure and defined as
 | (9) |
The structural parameter (ψ) has been determined via BET results and image analysis,24,36 and via experimental reaction rate results. However, as for the non-uniform pore size distribution char, BET measurements and image analysis were not accurate enough because of the approximations required to describe the non-uniformity of the pore sizes as well as the accuracy of the pore size estimates within the micro-pore range.19 Lu et al.37 estimated this parameter from the maximum of experimental reaction rate curves obtained from conversion results. These estimates, however, depend on the accuracy of the numerical estimation of the maxima are limited to a very narrow carbon conversion range. This problem was overcome by regression with the unknown structural parameter based on experimental results by other authors.19
In this paper, this parameter was estimated by the method as follow.
Rearrangement of the equation provides the following
 | (10) |
If we defined  x′ = ln(1 − x), while
 | (11) |
We can get
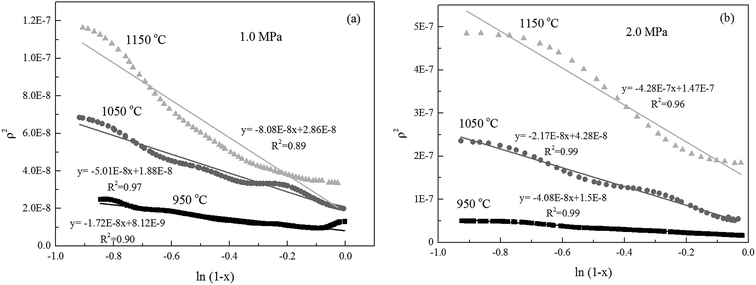
| ρ2 = ks2 − ks2ψx′ | (12) |
With regression analysis, ψ can be calculated by using the linear regression model between ρ2 and ks2. This is likely one of the reasons for ensuring that conversion levels are constant when undertaking investigations of char gasification intrinsic reaction kinetics, in particular when the determination of specific and intrinsic rate constants is required.16 Roberts et al.13,16,27 investigated the intrinsic reaction rates reasonably using the specific reaction rates when the carbon conversion efficiency was 0.1. In this study, the carbon conversion efficiency below 0.1 was the initial intrinsic-rate-controlling stage, and thus was applied to analyze the initial intrinsic kinetics of the selected char.
| ρ = kIIPAn(1 − x)m−1 | (13) |
While,
 | (14) |
If we defined
 | (15) |
We can get
ln![[thin space (1/6-em)]](https://www.rsc.org/images/entities/char_2009.gif) ρ = ln ρ = ln![[thin space (1/6-em)]](https://www.rsc.org/images/entities/char_2009.gif) kr + (m − 1)ln(1 − x) kr + (m − 1)ln(1 − x)
| (16) |
3. Results and discussion
3.1 Experimental results
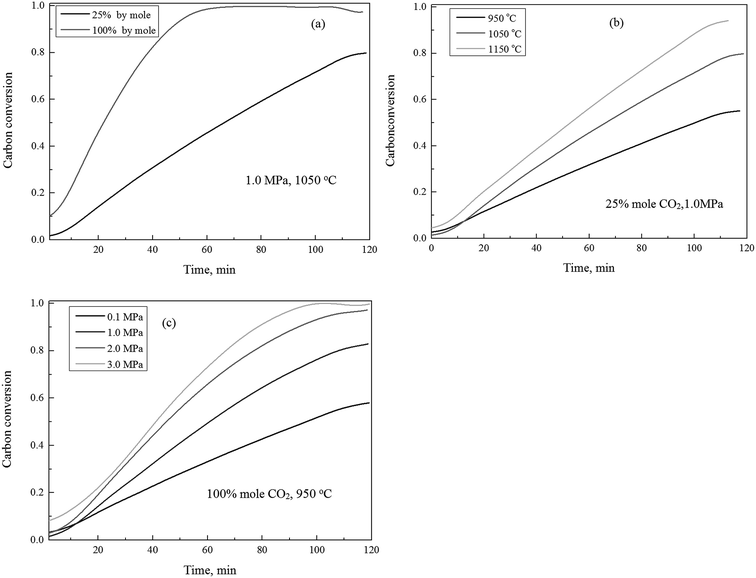
The gasification reactivity of the char using CO2 as gasification agent, in response to variation of the concentrations of carbon dioxide, temperatures and pressures, were shown in Fig. 1. Fig. 1(a) shows the carbon conversion efficiency versus time as the CO2 concentration varied between 25% and 100% (by mole ratio) at 1.0 MPa and 1050 °C. It can be observed that the carbon conversion efficiency was sensitive in response to the variation of CO2 concentrations. The increase of concentration of CO2 leads the increase of the carbon conversion throughout the char gasification process.The effect of temperature on the char gasification was pretty straightforward, as shown in Fig. 1(b). The elevation of gasification temperatures generally resulted in the increase of the carbon conversion efficiency under constant pressures and CO2 concentrations throughout the char gasification process. As shown in Fig. 1(c), the effect of pressure on char gasification was similar to that of temperature, the increase of the gasification pressures resulted in the increase of the carbon conversion efficiency throughout the complete char conversion, which was consistent to published studies.19,38
Fig. 2 shows the gasification rate versus the carbon conversion efficiency using 100% CO2 as gasification agent at selected operating conditions. It was observed that the gasification rate initially experienced a slow increase (Zone I), and followed by a rapid increase (Zone II), and finally a decrease (Zone III) corresponding to increasing the carbon conversion efficiency. The char CO2 gasification rates differed at these three stages should be associated with major rate controlling factors individually or jointly, such as rates of pore diffusions for reactants and gas products, the surface chemical adsorption, and intrinsic reaction. It was well known that the char structural parameters, such as specific surface area and atomic structure, subject to significant changes during the carbon conversion of the gasified char under a wide gasification conditions.16,39–41 Our previous studies29 presented, that changes of both the surface area and pore volume of the gasified char played major roles on the gasification reaction rate during the char–CO2 gasification. In the initial stage of the char gasification, the surface of char was revealed coarse with many small embossed parts, identified partially as small surface bulge and partially the initial underdeveloped pores structures. The initial pore opening on the char surface, surly resulted in that more pores underneath char surface were accessible by the gasification agent to let the process of pore openings move on. The outcomes lead more char participation in gasification process and the gasification rates speed-up until the carbon conversion efficiency reaching to around 0.9. The pore structures of the gasified char and its development solely dominated the gasification rate, while the intrinsic surface reaction was also involved. As presented later this study, the kinetic of Zone I and II can be well modeled by random pore model and mixed model, respectively. In the final stage of gasification as the carbon conversion efficiency above 0.9, the pore of the char particles started to collapse and disappeared and the reaction rate was controlled by the surface chemical reaction. Another evidence29 from Raman spectroscopy study supported the domination effect of the surface chemical reaction, that was the graphitization of carbon residue in the gasified char. Therefore, the char gasification when the carbon conversion efficiency above 0.9 was not suggested.
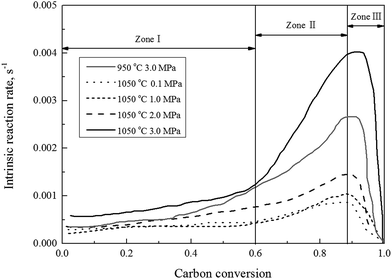 | ||
| Fig. 2 The gasification rate versus the carbon conversion efficiency using 100% CO2 at selected operating conditions. | ||
3.2 Kinetic model of char gasification
| Temperature | Carbon conversion | k1/k3 | Correlation coefficient |
|---|---|---|---|
| 950 °C | 10% | 1.263 | 0.99 |
| 20% | 0.968 | 0.95 | |
| 30% | 0.927 | 0.94 | |
| 40% | 0.868 | 0.951 | |
| 50% | 0.811 | 0.95 | |
| 60% | 0.750 | 0.96 | |
| 70% | 0.762 | 0.96 | |
| 80% | 0.766 | 0.97 | |
| 90% | 0.781 | 0.96 | |
| 1050 °C | 10% | 0.78 | 0.99 |
| 20% | 0.81 | 0.99 | |
| 30% | 0.82 | 0.98 | |
| 40% | 0.71 | 0.98 | |
| 50% | 0.69 | 0.98 | |
| 60% | 0.74 | 0.98 | |
| 70% | 0.77 | 0.97 | |
| 80% | 0.65 | 0.95 | |
| 90% | 0.76 | 0.98 | |
| 1150 °C | 10% | 0.616 | 0.98 |
| 20% | 0.539 | 0.97 | |
| 30% | 0.522 | 0.98 | |
| 40% | 0.452 | 0.96 | |
| 50% | 0.538 | 0.98 | |
| 60% | 0.527 | 0.98 | |
| 70% | 0.455 | 1 | |
| 80% | 0.474 | 0.94 | |
| 90% | 0.525 | 0.97 |
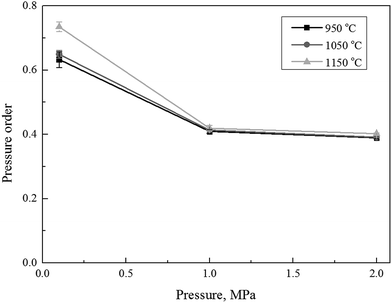
The obtained data, listed in Table 2, were consequently used in eqn (8) to calculate the extent of pressure order (n). The calculated pressure order (n), with respect to the partial pressure of the reactant gas at the different carbon conversion efficiency during the char gasification, was shown in Fig. 3. The calculated pressure order of the selected char in this study was found almost constant at about 0.4 under operational pressures of 1.0 and 2.0 MPa, but increased to 0.63–0.73 as the operational pressure dropped to 0.1 MPa. This was roughly in agreement to a pressure order in 0.5 (±0.04) obtained by Everson R. C. et al.19 and 0.53 by Lu and Do.37 The difference of pressure order parameters should be largely attributed to sources of char in different studies. The expanded literature studies revealed there was actually no consensus in previous studies regarding the pressure orders of very different coal samples and their corresponding chars at different operating conditions. The reported pressure order parameter of chat gasification was largely varied within a range between 0.2 and 0.8.19 However, it's true that the pressure order did decrease under an increase of operational pressures.43 Fig. 3 also implied that the temperature had little influence on the pressure order of the char gasification when the operational pressure was controlled constantly at 1.0 and 2.0 MPa.
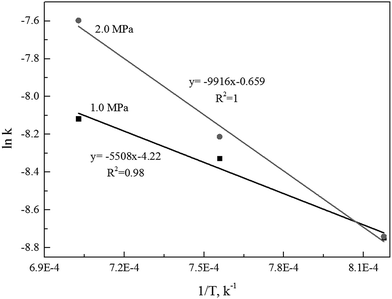
The linear regression model could be applied to determine the activation energy (E) and frequency factor (A0). Fig. 5 shows the curves of the linear regression of gasification reaction rate. The analyzed values of kinetics parameters were summarized in Table 3. Table 3 clearly presented that both the activation energy and frequency factor increased when operation pressures increased.
| Pressure, MPa | Temperature, °C | Reaction rate constant, k | Structural parameter, ψ | Activation energy, EI (kJ mol−1) | Frequency factor, AI (s−1 MPa−n) | Pressure order, n |
|---|---|---|---|---|---|---|
| 1.0 MPa | 950 | 3.43 × 10⁻⁵ | 2.11 | 45.8 | 0.015 | 0.42 |
| 1050 | 5.21 × 10⁻⁵ | 2.66 | ||||
| 1150 | 6.43 × 10⁻⁵ | 2.82 | ||||
| 2.0 MPa | 950 | 3.57 × 10⁻⁵ | 2.72 | 82.4 | 0.52 | 0.41 |
| 1050 | 6.06 × 10⁻⁵ | 2.91 | ||||
| 1150 | 1.12 × 10⁻⁴ | 2.91 | ||||
| Zone II: ρ = kIIPAn(1 − x)m, (0.6 < x ≤ 0.9) | ||||||
|---|---|---|---|---|---|---|
| Pressure, MPa | Temperature, °C | Reaction rate constant, kII | Reaction order, m | Activation energy, EII (kJ mol−1) | Frequency factor, AII (s−1 MPa−n) | Pressure order, n |
| 1.0 MPa | 950 | 1.12 × 10⁻⁴ | 0.53 | 35.93 | 0.011 | 0.42 |
| 1050 | 2.09 × 10⁻⁴ | 0.53 | ||||
| 1150 | 2.44 × 10⁻⁴ | 0.39 | ||||
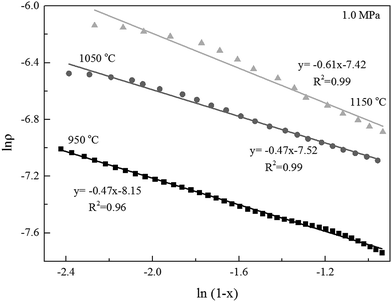
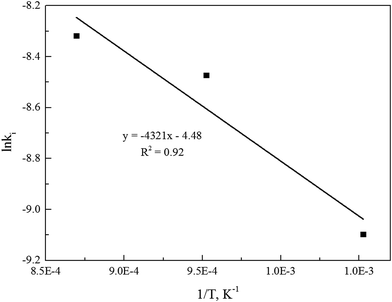
Alternatively, the mixed model described in the Experimental section was used to estimate kinetics of the Zone II (0.6 < x < 0.9) of the char gasification at 1.0 MPa. The charts of ln![[thin space (1/6-em)]](https://www.rsc.org/images/entities/char_2009.gif) ρ versus ln(1 − x) were shown in Fig. 6, the results of the calculations, providing kr and reaction order values of the char gasification at different operational conditions. Fig. 7 showed Arrhenius plots of gasification rates in the Zone II. Because continuous gasification rates were obtained with the TGA, the gasification rate when carbon conversion efficiency between 0.6 and 0.9, where the reaction rate could be controlled by pore diffusion. Table 3 summarized the estimated kinetic parameters of the Zone II.
ρ versus ln(1 − x) were shown in Fig. 6, the results of the calculations, providing kr and reaction order values of the char gasification at different operational conditions. Fig. 7 showed Arrhenius plots of gasification rates in the Zone II. Because continuous gasification rates were obtained with the TGA, the gasification rate when carbon conversion efficiency between 0.6 and 0.9, where the reaction rate could be controlled by pore diffusion. Table 3 summarized the estimated kinetic parameters of the Zone II.
An overall kinetic model of the char gasification under the isothermal and pressurized conditions could be determined, after aforementioned factors (including pressure order, structural parameter, reaction order, and activation energy and frequency factor) were derived from the experimental results based on gasification mechanism and proper kinetics model. The kinetic parameters of the intrinsic reaction kinetics of the char gasification at 1.0 MPa, has been summarized in Table 3.
4. Conclusions
The kinetics of the char–CO2 gasification reactions at high pressures were studied experimentally using a pressurized thermo-gravimetric analyzer (HP-TGA). The results showed that the gasification rate experienced an initially slow increase when the carbon conversion below 0.6 (Zone I), then a rapid increase when the carbon conversion between 0.6 and 0.9 (Zone II) and finally a decrease when carbon conversion above 0.9 (Zone III) corresponding to the carbon conversion efficiency. The combination of the L–H model, the nth order model, the random pore model and mixed model were initially used to simulate the intrinsic reaction kinetics of the char–CO2 gasification.The results implied that it was incompatible to use a combined model to thoroughly present the complete conversion of the char–CO2 gasification, but seemed useful to determine the intrinsic reaction kinetics of the char gasification by two different combined models at Zone I and II. For more accurate interpretation of kinetics of the char gasification, based on the random pore model and mixed model were developed by the predicated intrinsic reaction parameters, which was found in a good agreement with the TGA data under different operating conditions. Also, the structural parameter of char, reaction order, the pressure order, the activation energies and the intrinsic pre-exponential factor were determined.
Acknowledgements
This study was supported by the U.S. Department of Agriculture (5040-12630-005-00D), the 2014–2016 NSF RSP&RSP EPSCoR program (the National Science Foundation under Cooperative Agreement No. 1355438), and the support from the Science and Technology Foundation of Guizhou Province (No. qian ke he J zi [2015]2059) and the NSF-CHE-MRI under the Award ID of 1338072.References
- L. Zeng, F. He, F. Li and L.-S. Fan, Coal-direct chemical looping gasification for hydrogen production: reactor modeling and process simulation, Energy Fuels, 2012, 26, 3680–3690 CrossRef CAS.
- Y. Cao, B. Casenas and W.-P. Pan, Investigation of chemical looping combustion by solid fuels. 2: Redox reaction kinetics and product characterization with coal, biomass, and solid waste as solid fuels and CuO as an oxygen carrier, Energy Fuels, 2006, 20, 1845–1854 CrossRef CAS.
- Y. Cao and W.-P. Pan, Investigation of chemical looping combustion by solid fuels. 1: Process analysis, Energy Fuels, 2006, 20, 1836–1844 CrossRef CAS.
- C. Linderholm and M. Schmitz, Chemical-looping combustion of solid fuels in a 100 kW dual circulating fluidized bed system using iron ore as oxygen carrier, J. Environ. Chem. Eng., 2016, 4, 1029–1039 CrossRef CAS.
- L. Liu, Q. Liu, Y. Cao and J. Yang, Investigation of sintered iron ore fines as an oxygen carrier in chemical looping combustion, J. Therm. Anal. Calorim., 2016, 1–11 Search PubMed.
- C. Yan, W. Yang, J. T. Riley and W. P. Pan, A novel biomass air gasification process for producing tar-free higher heating value fuel gas, Fuel Process. Technol., 2006, 87, 343–353 CrossRef.
- F. Li, Q. Yan, J. Huang, J. Zhao, Y. Fang and J. Wang, Lignite-char gasification mechanism in mixed atmospheres of steam and CO2 at different pressures, Fuel Process. Technol., 2015, 138, 555–563 CrossRef CAS.
- D. Sutton, B. Kelleher and J. R. Ross, Review of literature on catalysts for biomass gasification, Fuel Process. Technol., 2001, 73, 155–173 CrossRef CAS.
- W. Zhu, W. Song and W. Lin, Catalytic gasification of char from co-pyrolysis of coal and biomass, Fuel Process. Technol., 2008, 89, 890–896 CrossRef CAS.
- X. Guo, Z. Dai, X. Gong, X. Chen, H. Liu, F. Wang and Z. Yu, Performance of an entrained-flow gasification technology of pulverized coal in pilot-scale plant, Fuel Process. Technol., 2007, 88, 451–459 CrossRef CAS.
- F. Scala, Fluidized bed gasification of lignite char with CO2 and H2O: a kinetic study, Proc. Combust. Inst., 2015, 35, 2839–2846 CrossRef CAS.
- K. Jayaraman and I. Gökalp, Thermal characterization, gasification and kinetic studies of different sized Indian coal and char particles, International Journal of Advances in Engineering Sciences & Applied Mathematics, 2014, 6, 31–40 Search PubMed.
- D. Roberts and D. Harris, A kinetic analysis of coal char gasification reactions at high pressures, Energy Fuels, 2006, 20, 2314–2320 CrossRef CAS.
- J. Huang, Y. Fang, H. Chen and Y. Wang, Coal gasification characteristic in a pressurized fluidized bed, Energy Fuels, 2003, 17, 1474–1479 CrossRef CAS.
- P. Li, Q. Yu, Q. Qin and W. Lei, Kinetics of CO2/Coal Gasification in Molten Blast Furnace Slag, Ind. Eng. Chem. Res., 2012, 51, 15872–15883 CrossRef CAS.
- D. Roberts and D. Harris, High-Pressure Char Gasification Kinetics: CO Inhibition of the C–CO2 Reaction, Energy Fuels, 2011, 26, 176–184 CrossRef.
- J. Ochoa, M. Cassanello, P. Bonelli and A. Cukierman, CO2 gasification of Argentinean coal chars: a kinetic characterization, Fuel Process. Technol., 2001, 74, 161–176 CrossRef CAS.
- S. Kajitani, S. Hara and H. Matsuda, Gasification rate analysis of coal char with a pressurized drop tube furnace, Fuel, 2002, 81, 539–546 CrossRef CAS.
- R. C. Everson, H. W. Neomagus, R. Kaitano, R. Falcon and V. M. du Cann, Properties of high ash coal–char particles derived from inertinite-rich coal: II gasification kinetics with carbon dioxide, Fuel, 2008, 87, 3403–3408 CrossRef CAS.
- M. Malekshahian and J. M. Hill, Kinetic analysis of CO2 gasification of petroleum coke at high pressures, Energy Fuels, 2011, 25, 4043–4048 CrossRef CAS.
- S. Kasaoka, Y. Sakata and C. Tong, Kinetic Evaluation of the Reactivity of Various Coal Chars for Gasification with Carbon Dioxide in Comparison with Steam, Int. Chem. Eng., 1984, 25, 1 Search PubMed.
- C. Shuai, Y.-Y. Bin, S. Hu, J. Xiang, L.-S. Sun, S. Su, K. Xu and C.-F. Xu, Kinetic models of coal char steam gasification and sensitivity analysis of the parameters, J. Fuel Chem. Technol., 2013, 41, 558–564 CAS.
- J.-L. Zhang, G.-W. Wang, J.-G. Shao and H.-B. Zuo, A Modified Random Pore Model for the Kinetics of Char Gasification, BioResources, 2014, 9, 3497–3507 Search PubMed.
- S. Bhatia and D. Perlmutter, A random pore model for fluid-solid reactions: I isothermal, kinetic control, AIChE J., 1980, 26, 379–386 CrossRef CAS.
- I. Ahmed and A. Gupta, Kinetics of woodchips char gasification with steam and carbon dioxide, Appl. Energy, 2011, 88, 1613–1619 CrossRef CAS.
- I. Sircar, A. Sane, W. Wang and J. P. Gore, Experimental and modeling study of pinewood char gasification with CO2, Fuel, 2014, 119, 38–46 CrossRef CAS.
- D. Roberts and D. Harris, Char gasification with O2, CO2, and H2O: effects of pressure on intrinsic reaction kinetics, Energy Fuels, 2000, 14, 483–489 CrossRef CAS.
- D. Roberts, D. Harris and T. Wall, On the effects of high pressure and heating rate during coal pyrolysis on char gasification reactivity, Energy Fuels, 2003, 17, 887–895 CrossRef CAS.
- L. Liu, Y. Cao and Q. Liu, Kinetics studies and structure characteristics of coal char under pressurized CO2 gasification conditions, Fuel, 2015, 146, 103–110 CrossRef CAS.
- L. Liu, Q. Liu, Y. Cao and W. P. Pan, The isothermal studies of char–CO2 gasification using the high-pressure thermo-gravimetric method, J. Therm. Anal. Calorim., 2015, 120, 1877–1882 CrossRef CAS.
- J. Strange and P. Walker Jr, Carbon–carbon dioxide reaction: Langmuir–Hinshelwood kinetics at intermediate pressures, Carbon, 1976, 14, 345–350 CrossRef CAS.
- S. Kajitani, Y. Zhang, S. Umemoto, M. Ashizawa and S. Hara, Co-gasification Reactivity of Coal and Woody Biomass in High-Temperature Gasification, Energy Fuels, 2009, 24, 145–151 CrossRef.
- G. R. Gavals, A random capillary model with application to char gasification at chemically controlled rates, AIChE J., 1980, 26, 577–585 CrossRef.
- K. J. Hüttinger and J. S. Nill, A method for the determination of active sites and true activation energies in carbon gasification: (II) experimental results, Carbon, 1990, 28, 457–465 CrossRef.
- D. G. Roberts, D. J. Harris and T. F. Wall, in High-pressure intrinsic char gasification kinetics: an application of a modified nth order rate equation, International Pittsburgh Coal Conference, 2001 Search PubMed.
- G.-S. Liu, A. Tate, G. Bryant and T. Wall, Mathematical modeling of coal char reactivity with CO2 at high pressures and temperatures, Fuel, 2000, 79, 1145–1154 CrossRef CAS.
- G. Lu and D. Do, A kinetic study of coal reject-derived char activation with CO2, H2O, and air, Carbon, 1992, 30, 21–29 CrossRef CAS.
- D. G. Roberts, E. M. Hodge, D. J. Harris and J. F. Stubington, Kinetics of char gasification with CO2 under regime II conditions: effects of temperature, reactant, and total pressure, Energy Fuels, 2010, 24, 5300–5308 CrossRef CAS.
- H. Lorenz, E. Carrea, M. Tamura and J. Haas, The role of char surface structure development in pulverized fuel combustion, Fuel, 2000, 79, 1161–1172 CrossRef CAS.
- E. Cetin, B. Moghtaderi, R. Gupta and T. F. Wall, Influence of pyrolysis conditions on the structure and gasification reactivity of biomass chars, Fuel, 2004, 83, 2139–2150 CrossRef CAS.
- M. Zanetti, T. Kashiwagi, L. Falqui and G. Camino, Cone calorimeter combustion and gasification studies of polymer layered silicate nanocomposites, Chem. Mater., 2002, 14, 881–887 CrossRef CAS.
- N. M. Laurendeau, Heterogeneous kinetics of coal char gasification and combustion, Prog. Energy Combust. Sci., 1978, 4, 221–270 CrossRef CAS.
- D. G. Roberts, D. J. Harris and T. F. Wall, in High-pressure intrinsic char gasification kinetics: an application of a modified nth order rate equation, International Pittsburgh Coal Conference, 2001 Search PubMed.
| This journal is © The Royal Society of Chemistry 2017 |

