 Open Access Article
Creative Commons Attribution 3.0 Unported Licence
Highly sensitive and reliable SERS probes based on nanogap control of a Au–Ag alloy on silica nanoparticles†
Xuan-Hung Pham‡
a,
Minwoo Lee‡b,
Seongbo Shim
a,
Sinyoung Jeong§b,
Hyung-Mo Kima,
Eunil Hahma,
Sang Hun Leec,
Yoon-Sik Leec,
Dae Hong Jeong b and
Bong-Hyun Jun
 *a
*a
aDepartment of Bioscience and Biotechnology, Konkuk University, Seoul 143-701, Republic of Korea. E-mail: bjun@konkuk.ac.kr
bDepartment of Chemistry Education, Seoul National University, Seoul 151-742, Republic of Korea
cSchool of Chemical and Biological Engineering, Seoul National University, Seoul 151-742, Republic of Korea
First published on 20th January 2017
Abstract
We developed highly sensitive surface-enhanced Raman scattering (SERS) probes based on SiO2@Au@Ag nanoparticles (NPs) using the Ag growth onto Au NP seeds method. The SiO2@Au@Ag NPs were synthesized by reducing Ag ions under mild conditions (ascorbic acid) and using the structure-directing agent polyvinylpyrrolidone (PVP). SERS activities of the NPs were tuned by adjusting AgNO3 concentration, resulting in the growth of the Ag shell on the surface of the Au NP seeds and the formation of narrow gaps between two Ag NPs on the surface of the probes. The NPs exhibited strong Raman signals originating from a highly enhanced E-field at the gaps. The SiO2@Au@Ag NPs exhibited a low limit of detection (LOD) value of 2.4 nM for ATP, which proves that they are highly sensitive probes. Moreover, reproducible Raman signals of the SiO2@Au@Ag NPs toward ATP were obtained in batch-to-batch experiments which is very promising for potential use in on-site detection.
1. Introduction
Surface-enhanced Raman scattering (SERS) has attracted considerable interest for bioanalytical and imaging applications and in environmental monitoring as a non-destructive, ultrasensitive, and selective analytical technique.1–7 SERS enhancement occurs through both a short-range chemical mechanism (CM) and a long-range electromagnetic mechanism (EM) of metal substrates, such as Au or Ag.2 EM, which is a dominant SERS enhancement mechanism, is caused by localized surface plasmon resonance (LSPR) under excitation of light on or near the surface of metallic nanoparticles (NPs), resulting in an enhanced local electromagnetic field.8 Thus, the metal nanostructure and the SERS material components play important roles in generating the strong SERS signals.2,8 To improve SERS activity, nanomaterials of various sizes, structures, and components, such as nanospheres, nanoshells, nanorods, and multibranched NPs, have been developed and used as SERS probes.4,9–12 However, SERS signals from single NPs might not always have sufficient sensitivity.2,4Bimetallic Au and Ag NPs have attracted extensive interest in SERS because the LSPR of Au–Ag alloy NPs enhances EM, which plays an important role in SERS. Au–Ag alloy NPs offer several advantages, including enhanced SERS signal broad band absorption of light due to bimetallic materials, and dynamic modulation of electronic properties without altering overall size.13 Moreover, they possess the long-term stability and biocompatibility due to Au and give extraordinary enhancement of Raman intensities due to Ag nanostructure.13 Especially, using the seed mediated growth method, by adjusting the Ag source amount, the growth of Ag shell thickness on the Au seeds can be reliably controlled.11,12,14–16 A SERS probe based on aggregation of metal (Au and/or Ag) NP clusters has been fabricated for enhanced SERS signals. Signals from a NP-cluster probe are dramatically enhanced up to 1010 compared to that of a single NP-based SERS probe because the presence of the junction between two NPs, which are commonly called “hot spots”, arouse LSPR on or near the aggregated NPs.2,17 Several strategies have been used to obtain aggregated NP clusters and they are cataloged into two; one is to induce nanoaggregates without template by using salt18 or by Raman reporters.19 However, precise and reproducible control of the aggregated NP clusters has been difficult due to the formation of heterogeneity in their local structure.19,20 The other is to generate nanoaggregate structures using a template, such as silica particles or polymer beads, to deposit much smaller Au or Ag NPs onto their surfaces.20–30 In this strategy, the silica NPs are widely used as a template for metal NPs as they are inert, and their sizes are easily controllable. So far, although the assembly of Au and/or Ag NPs onto silica NPs has been reported by several groups,4,15,23–27,31–39 the density of the Au and/or Ag NPs and the gaps between two NPs which can provide a stronger LSPR property are not studied well.40
In this study, we report an easy method to prepare nanogaps containing Au–Ag NPs on silica NPs (SiO2@Au@Au NPs) for the sensitive detection of chemicals as strong and reliable SERS probe. The SiO2@Au@Ag NPs were synthesized by using the Au seed mediated Ag growth method. This approach allowed us to perform the controlled synthesis of Ag shell on Au NPs surfaces of silica NP. The variation of SERS activities of the SiO2@Au@Ag NPs in relation to nanogaps in the presence of 4-aminobenzophenol (4-ATP) was obtained. The variation of SERS spectra of the SiO2@Au@Ag NPs with various ATP to demonstrate their potential as sensitive chemical detection probes. Furthermore, we also confirmed a relationship between the SERS signal and the distance of Ag NPs on the surface of silica NPs by simulation.
2. Results and discussion
2.1 Preparation of SiO2@Au@Ag NPs
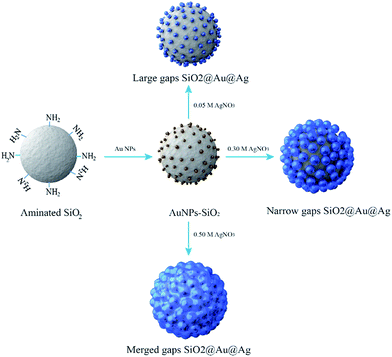
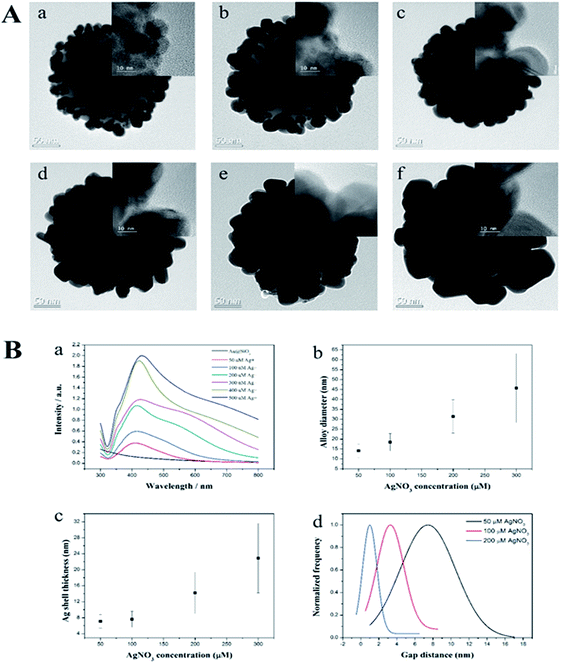
The procedures to synthesize the SiO2@Au@Ag NPs are illustrated in Fig. 1. Amine-functionalized silica NPs (ca. 150 nm in diameter) were used as a dielectric core. Colloidal Au NPs (2–3 nm) were prepared by reducing gold(III) chloride with tetrakis(hydroxymethyl)-phosphonium chloride (THPC), according to the method reported by Duff et al. with slight modifications.41 The Au NPs were incubated with aminated silica NPs for 12 h by gently shaking at room temperature (Fig. S1†). The surfaces of the aminated silica NPs were covered with ∼2300 unit of Au NPs. The amine functional group plays a crucial role in attaching Au NPs through strong electrostatic attractions and thus, facilitating Ag shell growth on Au NPs on the silica surface. The Ag shell was deposited selectively on Au NPs by reducing a silver precursor (AgNO3) on the silica surface in the presence of ascorbic acid and polyvinylpyrrolidone (PVP). PVP is a stabilizer and a structure-directing agent that played a crucial role in covering the Ag shell on the Au NPs on the silica surface under the mild reducing conditions (Fig. S2†). PVP adsorbed onto Au NPs facilitated the reduction of Ag ions onto the SiO2@Au NPs.42,43Next, we determined the effect of the size of the Ag NPs and their gaps on the SiO2@Au NPs in relation to SERS signal by adjusting the concentration of AgNO3 in the solution. The quantity of the SiO2@Au NPs was fixed at 0.2 mg and the AgNO3 concentration was varied from 50 to 500 μM. A representative transmission electron microscopic (TEM) image is shown in Fig. 2A. When the AgNO3 was increased from 50 to 300 μM, the size of the Au@Ag alloy NPs became larger on the surface of the SiO2@Au NPs as seen in Fig. 2B(a). In particular, the alloy diameter measured from high resolution (HR)-TEM and analyzed by ImageJ software, increased to 14.1 ± 3.4 (50 μM), 18.4 ± 4.4 (100 μM), 31.4 ± 8.4 (200 μM) and 45.7 ± 17.4 nm (300 μM). To provide more information of Ag coating, the thickness of the Ag shell was calculated by subtracting the radius of the Au NPs from the radius of the Au@Ag NPs. Here, we assumed that the Au@Ag alloy NPs were spheres, each Au@Ag NP contained one Au NP and the Au NPs maintained their size. The thickness of the Ag shell was determined to be 7.0 ± 1.7 to 22.9 ± 8.7 nm when AgNO3 concentration increase from 50 μM to 300 μM in Fig. 2B(c). In contrast, the nanogap between Ag NPs on the surface of the SiO2@Au NPs decreased with increasing AgNO3 concentration from 50 to 300 μM. The gaps between two Au@Ag alloy NPs was decreased from 7.4 ± 6.1 to 1 ± 1.6 nm and the Ag shell was partly merged at >200 mM AgNO3, leading the decrement of the “hot spot” on the surface of the SiO2@Au@Ag NPs in Fig. 2B(d). However, the size of Ag NPs on the SiO2@Au NPs surfaces became larger and irregularly shaped at higher concentrations of AgNO3 (>300 μM).
The UV-Vis absorption spectra of the SiO2@Au@Ag NPs shown in Fig. 2B(d) were well matched with the TEM images. SiO2@Au NPs did not show the typical UV peak of Au NPs at 500–520 nm because of low absorbance of the 2–3 nm sized Au NPs.41 After depositing the Ag onto the SiO2@Au NPs at 50 μM of AgNO3, a single plasmonic absorption band at ∼410 nm was observed which is ascribed to the unique optical property of separated Ag NPs on the SiO2@Au surfaces. However, this band was red-shifted to 430 nm, and the wavelength broadened from 400 to 800 nm as AgNO3 concentration was increased from 50 to 300 μM, indicating that Ag shell on the surfaces of Au NPs on the silica NPs44 created hot-spot structures on the SiO2@Au@Ag NPs. This absorption may be due to the diversity in the size of the Ag clusters, which produces a continuous spectrum of resonant multimode.44,45 However, when AgNO3 concentration increased to more than 400 μM, absorbance increased dramatically compared to that of the SiO2@Au@Ag NPs synthesized with 300 μM of AgNO3. This might be due to the partial merging of Ag NPs to larger Ag NPs on the surface of the SiO2@Au@Ag NPs as shown in Fig. 2B. Therefore, the SiO2@Au@Ag NPs prepared from 2.5 nm Au NPs exhibited a longitudinal UV-vis spectrum with a coupling of inner Au NPs core and outer Ag shell that is similar to the absorbance pattern of individual Ag NPs of large size (100–150 nm).44 Elemental mapping with energy dispersive X-ray spectroscopy (EDX) was applied to confirm the presence of the Ag on the SiO2@Au@Ag prepared with 300 μM AgNO3 in Fig. S3.† The atomic element compositional analysis of the SiO2@Au@Ag NPs confirmed 28.3% Si, 42.5% O, 0.8% Au, and 28.4% Ag (Fig. S4†). Au atoms were observed on the surface of the core silica NPs, whereas high density Ag atoms were detected at the outer layer of the SiO2@Au@Ag, indicating that a thick Ag shell covered the Au NPs on silica NPs.
2.2 SERS activity of the SiO2@Au@Ag NPs
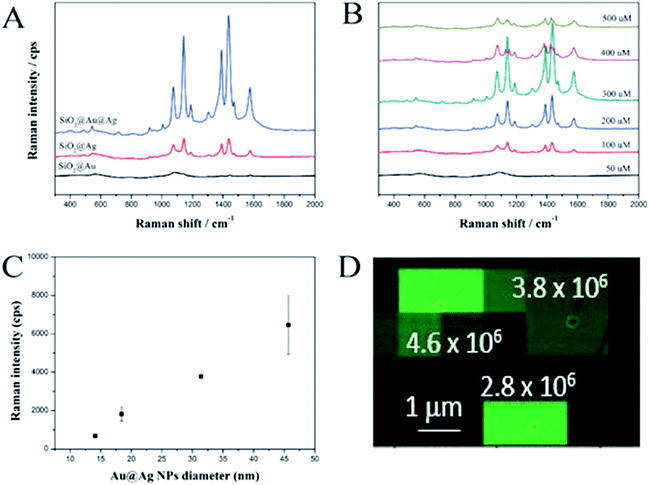
The SERS-activities of these materials were investigated using 4-aminothiophenol (ATP) as a Raman chemical. To demonstrate the advantage of the SiO2@Au@Ag NPs, we synthesized SiO2@Ag NPs according to the method reported by Kang et al.25 Both the SiO2@Ag and SiO2@Au@Ag NPs were incubated with ATP to immobilize the Raman chemical on the surface of the probes. The Raman signals were recorded using a micro Raman system after dropping and air-drying the solution (10 μL) onto a glass substrate and the SERS measurement results are shown in Fig. 3A. The SERS signal of the SiO2@Au NPs was weak and unclear because of low optical absorption of the Au NPs compared to that of the Ag NPs.46 Typical ATP bands were obtained clearly for both the SiO2@Ag and SiO2@Au@Ag due to the electromagnetic enhancement of the decorated Ag NPs. Dominant and distinct ATP peaks were at 1142 and 1432 cm−1 were assigned to C–H in-plane and out-of-plane bending vibrations while the peak at 1390 cm−1 was due to N-phenyl stretching. The peaks at 1575 and 1078 cm−1 were attributed to ring C–C and C–S stretching, respectively.47 Interestingly, the SERS signal of the SiO2@Au@Ag NPs at 1078 cm−1 was ∼3185 cps with 10 mM ATP, which was 3.5-fold stronger than the SERS signal of SiO2@Ag NPs even though SiO2@Ag NPs possessed many nanogaps among Ag NPs as shown in Fig. S5.† Similarly, these values were 3.8-, 4.0-, 4.5-, and 3.5-fold stronger at 1142, 1390, 1432, and 1575 cm−1, respectively. This result demonstrates the importance of pre-depositing Au NPs onto the SiO2 surface to ensure the growth of Ag shell and amplify the SERS signal.In addition, the effect of AgNO3 concentration on the SERS signals of the SiO2@Au@Ag NPs with 10 mM ATP was investigated (Fig. 3B). Signal intensity was proportional to AgNO3 concentration from 50 to 300 μM and was the highest at 300 μM, such as ∼3185 cps (1078 cm−1); 3297 cps (1142 cm−1); 4320 cps (1142 cm−1); 4515 cps (1142 cm−1); and 2677 cps (1575 cm−1). These results are consistent with the TEM images shown in Fig. 2A. The gaps between Ag NPs was about 7.4 ± 6.1 nm at 50 μM AgNO3, which did not strongly enhance the signals of ATP molecules on the surfaces of the SiO2@Au@Ag NPs. When the AgNO3 concentration was increased to 300 μM, the nanogaps became <1.0 nm, which can create “hot-spots”, and induce a strong enhancement of the electromagnetic field surrounding the SiO2@Au@Ag NPs. However, the SERS signals of the SiO2@Au@Ag NPs synthesized at higher concentrations of AgNO3 (400 and 500 μM) were decreased dramatically because there was no nanogap in the Ag shell. Moreover, the shape of Ag NPs became irregular. Therefore, the optimal AgNO3 concentration was 300 μM.
Additionally, we measured SERS intensity of a single SiO2@Au@Ag NPs labelled with 4-fluoro thiophenol (4-FBT) to evaluate the enhancement factor and reproducibility of SERS signal. The SiO2@Au@Ag NPs solution (0.02 mg mL−1 in EtOH) was drop-cast on a patterned slide glass to easily monitor the SiO2@Au@Ag NPs using scanning electron microscopy (SEM). After mapping the SERS signals of the SiO2@Au@Ag NPs, the SERS intensity maps were overlaid on the corresponding SEM image to measure the intensity of the SERS signal from a single SiO2@Au@Ag NPs in the entire SERS intensity map as mentioned in Fig. 3. The signal of 4-FBT peak at 1099 cm−1 was used to record the SERS intensity and calculate the enhancement factor (EF) (see Fig. S7, ESI†). As results, the area of strong signals on the SERS intensity map corresponded to the position of the single SiO2@Au@Ag NPs in the SEM image, indicating that the SERS signal from a single particle was strong enough to be detectable. Additionally, we calculated the SERS EFs for 75 single SiO2@Au@Ag NPs and their mean SERS EF value was 4.2 × 10⁶.
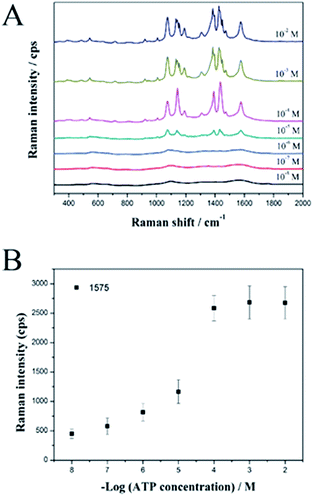
Finally, we used the SiO2@Au@Ag NPs as active SERS probes for label-free detection of ATP in a model study. The SiO2@Au@Ag NPs were mixed with various concentrations of ATP in ethanol solution. Fig. 4A shows the strong SERS signals of ATP at each concentration (10−2 to 10−8 M), confirming that the SiO2@Au@Ag NPs are an active SERS substrate to detect ATP.
Specifically, the intensities of the Raman bands at 1078, 1142, 1390, 1432, and 1575 cm−1 increased as ATP concentration increased. Fig. 4B shows the linear correlation between peak intensity and ATP concentration. In support of the sensitive nature of the NP-based label-free detection, we calculated the theoretical LOD for the SiO2@Au@Ag system to detect ATP at the 1575 cm−1 peak, which is based on the standard deviation of the response and the slope of the calibration curve at levels approximating the LOD according to the formula: LOD = 3.3(SD/S). The theoretical LOD of the SiO2@Au@Ag NPs was 2.4 nM, which is much lower than the SiO2@Ag NPs with a LOD of 6 μM.27
We also performed batch-to-batch reproducibility experiments. The SERS signals of ATP on SiO2@Au@Ag NPs obtained from three different batches were calculated at 1575 cm−1. As shown in Fig S8,† the signals were only varied from 2500–3000 cps (∼14.2% deviation) with a high reproducible Raman signals of the SiO2@Au@Ag NPs.
2.3 Simulation of theoretical Au NPs E-field distributions on the Au@Ag NPs dimer for identifying SERS enhancement
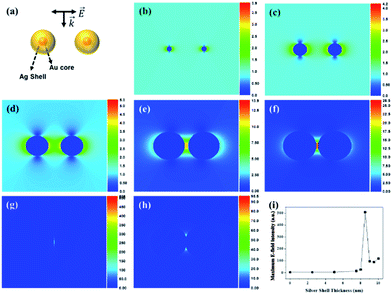
To support the dependency of SERS enhancement on the quantity of Ag in the SiO2@Au@Ag NPs with different nanogaps, we carried out a discrete dipole approximation (DDA) simulation for the theoretical E-field calculation of Ag, Au and Au@Ag NPs dimer in Fig. 5 and S9.† The core diameter of Au NPs of Au@Ag NPs dimer was set to 3 nm and Ag shell thickness of the Au@Ag NPs dimer was set to 2.5–10 nm. The Au@Ag NPs dimer was merged after Ag shell thickness was 9 nm. The theoretical E-field distribution of each structure and the maximum E-field intensity of each structure are shown in Fig. 5. As the Ag shell thickness increased gradually to 8.5 nm, the interparticle gap of the Au@Ag NPs dimer became smaller, and the theoretical E-field intensity increased because of plasmon coupling between the Au@Ag NPs.48 On the other hand, as the Ag shell thickness became more than 9 nm, the Au@Ag NPs dimers merged and the theoretical E-field intensity decreased.For identification of the contribution of Au seeds in SiO2@Au@Ag NPs, theoretical maximum E-field intensity of Au@Ag NPs was compared with those of Ag and Au NPs dimer as shown in Fig S9.† The Au@Ag NPs dimer and Ag NPs dimer exhibited stronger intensity than Au NPs dimer as the particle distance become shorter, but the maximum E-field intensity of Au@Ag NPs dimer was not so different compared with that of Ag NPs dimer. However, in terms of particle size controlling, Au–Ag alloy NPs on SiO2 surface was more controllable than Ag NPs on SiO2 surface.
Thus, the DDA simulation data supported well the SERS enhancement depending on the structural morphology changes of SiO2@Au@Ag NPs with increasing AgNO3 concentration.
3. Experimental
3.1 Materials
Tetraethylorthosilicate (TEOS), 3-mercaptopropyl trimethoxysilane (MPTS), 3-aminopropyltriethoxysilane (APTS), silver nitrate (AgNO3), tetrakis(hydroxymethyl)phosphonium chloride (THPC), gold(III) chloride trihydrate (HAuCl4), ascorbic acid (AA), 4-aminobenzenethiol (4-ATP), polyvinyl pyrrolidone (PVP), thiram were purchased from Sigma-Aldrich (St. Louis, MO, USA) and used without further purification. Ethyl alcohol (EtOH), and aqueous ammonium hydroxide (NH4OH, 27%) was purchased from Daejung (Siheung, Korea).3.2 Preparation of aminated silica nanoparticle (NP) templates
Approximately 150 nm sized silica NPs were prepared using the Stöber method.49 Absolute EtOH (40 mL), NH4OH (3 mL), and 1.6 mL TEOS (1.6 mL) were added to a round bottle. The solution was stirred vigorously at 700 rpm for 20 h at 25 °C. The silica NPs were centrifuged at 8500 rpm for 15 min and washed several times with EtOH. The silica NPs (50 mg mL−1, 4 mL) were dispersed in 4 mL absolute EtOH, and 250 μL APTS and 40 μL NH4OH were added to the colloidal solution to obtain aminated silica NPs. The mixture was stirred vigorously for 6 h at 25 °C, followed by stirring at 70 °C for 1 h. The aminated silica NPs were obtained after centrifugation, and washed several times with EtOH to remove excess reagent.3.3 Preparation of the SiO2@Au NPs
The colloidal Au NPs were prepared by reducing gold(III) chloride, using THPC (tetrakis(hydroxymethyl)-phosphonium chloride) as a reducing agent. The THPC capped Au NPs were prepared by a method reported of Duff et al.41 The solution was stored at 4 °C for 3 days before use. Au NPs (1 mM, 10 mL) and the aminated SiO2 solution (1 mg mL−1, 1 mL) was mixed, sonicated for 30 min, and incubated in a shaker overnight.33 Au NPs-embedded silica NPs were obtained by centrifugation and washed several times with EtOH to remove unbound Au NPs. SiO2@Au NPs were redispersed into absolute EtOH to obtain 1 mg mL−1 SiO2@Au NPs solution.3.4 Preparation of the SiO2@Au@Ag NPs
Au–Ag core–shell NPs were prepared in an aqueous medium by depositing Ag source with ascorbic acid on gold NPs in the presence of PVP. Briefly, 0.2 mg of SiO2@Au NPs were dispersed into 9.8 mL of water containing 10 mg PVP and kept still for 30 min. Silver nitrate (10 mM, 20 μL) was added to the solution, followed by 10 mM ascorbic acid (20 μL). This solution was incubated for 15 min to reduce Ag+ to Ag metal. These steps were repeated to obtain the desired Ag concentrations (50, 100, 200, 300, 400, and 500 μM of AgNO3). The SiO2@Au@Ag NPs were obtained by centrifugation at 8500 rpm for 15 min and washed several times with EtOH to remove excess reagent. The SiO2@Au@Ag NPs were redispersed in 1.0 mL absolute EtOH to obtain 0.2 mg mL−1 SiO2@Au@Ag NPs solution (based on SiO2).3.5 Incorporating Raman reporter materials into the SiO2@Au@Ag NPs
A 4-ATP solution (1 mL, 10 mM in EtOH) was added to the SiO2@Au@Ag NPs (0.2 mg), and the suspension was stirred vigorously for 2 h at 25 °C. The colloids were centrifuged and washed several times with EtOH. The NPs were redispersed in 1.0 mL absolute EtOH to obtain 0.2 mg mL−1 SiO2@Au@Ag NPs modified with ATP (based on SiO2).3.6 SERS measurement of the SiO2@Au@Ag NPs
SiO2@Au@Ag NPs modified with ATP were spread on a glass slide by the drop-casting method and SERS signals were measured using a confocal micro-Raman system (LabRam 300, JY-Horiba, Tokyo, Japan) equipped with an optical microscope (BX41, Olympus, Tokyo, Japan). The SERS signals were collected in a back-scattering geometry using ×10 objective lens (0.90 NA, Olympus) and a spectrometer equipped with a thermoelectric cooled CCD detector. A 532 nm diode-pumped solid-state laser (CL532-100-S; Crystalaser) was used as the photo-excitation source, with 10 mW laser power at the sample. The strong Rayleigh scattered light was rejected using a long-pass filter. Selected sites were measured randomly, and all SERS spectra were integrated for 5 s. The spot size of the laser beam was about 2 μm.3.7 E-Field distribution calculation using the DDA calculation for identifying SERS enhancement
The E-fields of Au and the Au@Ag NPs dimer were calculated using the DDA package (DDSCAT 7.1) to investigate the SERS enhancement of SiO2@Au@Ag NPs.50 The diameter of an Au NP was 3 nm based on the TEM size analysis of SiO2@Au NPs, and Ag shell thickness on the Au@Ag NPs was 2.5–10 nm. The interdipole distance was 0.25 nm, and the dielectric constant was obtained from Palik.51 The medium was set as vacuum with a refractive index of 1.00 + 0i. Wavelength was 532 nm.4. Conclusions
In conclusion, we have successfully developed highly sensitive SERS probes based on the SiO2@Au@Ag NPs using the Au NPs mediated Ag growth method. The SERS activities of the SiO2@Au@Ag NPs were tuned by adjusting the AgNO3 concentration, resulting in the formation of nanogaps between two Ag NPs on the surface of the SiO2@Au@Ag NP. Strong Raman signals obtained were originated from a highly enhanced E-field at the nanogaps (<1 nm) between two Ag NPs of the SiO2@Au@Ag NPs. In addition, the SiO2@Au@Ag NPs exhibited LOD of 2.4 nM for ATP. Moreover, Raman signals of ATP with SiO2@Au@Ag NPs showed a high reproducibility (∼14.2% of deviation) in batch-to-batch experiments. The SiO2@Au@Ag NPs can be utilized as a highly sensitive SERS substrate and used for detection of trace amounts of chemicals in various fields.Conflict of interest
We have no conflicts of interest.Acknowledgements
This work was supported by the Bio & Medical Technology Development Program of the National Research Foundation (NRF) & funded by the Korean government (MSIP & MOHW) (2016-A423-0045).References
- S. Schlücker, Angew. Chem., Int. Ed., 2014, 53, 4756–4795 CrossRef PubMed.
- Y. Wang, B. Yan and L. Chen, Chem. Rev., 2013, 113, 1391–1428 CrossRef CAS PubMed.
- M. Culha, B. Cullum, N. Lavrik and C. K. Klutse, Nanotechnology, 2012, 2012, 15 Search PubMed.
- B.-H. Jun, G. Kim, S. Jeong, M. S. Noh, X.-H. Pham, H. Kang, M.-H. Cho, J.-H. Kim, Y.-S. Lee and D. H. Jeong, Bull. Korean Chem. Soc., 2015, 36, 963–978 CAS.
- S. Nie and S. R. Emory, Science, 1997, 275, 1102–1106 CrossRef CAS PubMed.
- K. Sivashanmugan, J.-D. Liao, B. H. Liu, C.-K. Yao and S.-C. Luo, Sens. Actuators, B, 2015, 207, 430–436 CrossRef CAS.
- Y. Hu, J. Liao, D. Wang and G. Li, Anal. Chem., 2014, 86, 3955–3963 CrossRef CAS PubMed.
- M. R. Jones, K. D. Osberg, R. J. Macfarlane, M. R. Langille and C. A. Mirkin, Chem. Rev., 2011, 111, 3736–3827 CrossRef CAS PubMed.
- M. J. Banholzer, J. E. Millstone, L. Qin and C. A. Mirkin, Chem. Soc. Rev., 2008, 37, 885–897 RSC.
- C. E. Talley, J. B. Jackson, C. Oubre, N. K. Grady, C. W. Hollars, S. M. Lane, T. R. Huser, P. Nordlander and N. J. Halas, Nano Lett., 2005, 5, 1569–1574 CrossRef CAS PubMed.
- J. B. Jackson and N. J. Halas, Proc. Natl. Acad. Sci. U. S. A., 2004, 101, 17930–17935 CrossRef CAS PubMed.
- J. B. Jackson and N. J. Halas, J. Phys. Chem. B, 2001, 105, 2743–2746 CrossRef CAS.
- W. R. Erwin, A. Coppola, H. F. Zarick, P. Arora, K. J. Miller and R. Bardhan, Nanoscale, 2014, 6, 12626–12634 RSC.
- Q. Wu, C. Zhang and F. Li, Mater. Lett., 2005, 59, 3672–3677 CrossRef CAS.
- J.-H. Kim, W. W. Bryan and T. Randall Lee, Langmuir, 2008, 24, 11147–11152 CrossRef CAS PubMed.
- Z.-j. Jiang and C.-y. Liu, J. Phys. Chem. B, 2003, 107, 12411–12415 CrossRef CAS.
- J. D. Driskell, R. J. Lipert and M. D. Porter, J. Phys. Chem. B, 2006, 110, 17444–17451 CrossRef CAS PubMed.
- L. O. Brown and S. K. Doorn, Langmuir, 2008, 24, 2277–2280 CrossRef CAS PubMed.
- X. Su, J. Zhang, L. Sun, T.-W. Koo, S. Chan, N. Sundararajan, M. Yamakawa and A. A. Berlin, Nano Lett., 2005, 5, 49–54 CrossRef CAS PubMed.
- B.-H. Jun, J.-H. Kim, H. Park, J.-S. Kim, K.-N. Yu, S.-M. Lee, H. Choi, S.-Y. Kwak, Y.-K. Kim, D. H. Jeong, M.-H. Cho and Y.-S. Lee, ACS Comb. Sci., 2007, 9, 237–244 CAS.
- K. Kim, H. B. Lee, H. K. Park and K. S. Shin, J. Colloid Interface Sci., 2008, 318, 195–201 CrossRef CAS PubMed.
- J.-M. Li, W.-F. Ma, C. Wei, J. Guo, J. Hu and C.-C. Wang, J. Mater. Chem., 2011, 21, 5992–5998 RSC.
- H. Kang, T. Kang, S. Kim, J.-H. Kim, B.-H. Jun, J. Chae, J. Park, D.-H. Jeong and Y.-S. Lee, J. Nanosci. Nanotechnol., 2011, 11, 579–583 CrossRef CAS PubMed.
- H. Kang, J. Yim, S. Jeong, J.-K. Yang, S. Kyeong, S.-J. Jeon, J. Kim, K. D. Eom, H. Lee, H.-I. Kim, D. H. Jeong, J.-H. Kim and Y.-S. Lee, ACS Appl. Mater. Interfaces, 2013, 5, 12804–12810 CAS.
- H. Kang, J.-K. Yang, M. S. Noh, A. Jo, S. Jeong, M. Lee, S. Lee, H. Chang, H. Lee, S.-J. Jeon, H.-I. Kim, M.-H. Cho, H.-Y. Lee, J.-H. Kim, D. H. Jeong and Y.-S. Lee, J. Mater. Chem. B, 2014, 2, 4415–4421 RSC.
- H. Chang, H. Kang, J.-K. Yang, A. Jo, H.-Y. Lee, Y.-S. Lee and D. H. Jeong, ACS Appl. Mater. Interfaces, 2014, 6, 11859–11863 CAS.
- J.-K. Yang, H. Kang, H. Lee, A. Jo, S. Jeong, S.-J. Jeon, H.-I. Kim, H.-Y. Lee, D. H. Jeong, J.-H. Kim and Y.-S. Lee, ACS Appl. Mater. Interfaces, 2014, 6, 12541–12549 CAS.
- J.-H. Kim, J.-S. Kim, H. Choi, S.-M. Lee, B.-H. Jun, K.-N. Yu, E. Kuk, Y.-K. Kim, D. H. Jeong, M.-H. Cho and Y.-S. Lee, Anal. Chem., 2006, 78, 6967–6973 CrossRef CAS PubMed.
- C. Wang, Y. Chen, T. Wang, Z. Ma and Z. Su, Adv. Funct. Mater., 2008, 18, 355–361 CrossRef CAS.
- J.-M. Li, W.-F. Ma, C. Wei, L.-J. You, J. Guo, J. Hu and C.-C. Wang, Langmuir, 2011, 27, 14539–14544 CrossRef CAS PubMed.
- K. Wang, X. Zhang, C. Niu and Y. Wang, ACS Appl. Mater. Interfaces, 2014, 6, 1272–1278 CAS.
- M. Chen, Y. N. Kim, H. M. Lee, C. Li and S. O. Cho, J. Phys. Chem. C, 2008, 112, 8870–8874 CAS.
- S. L. Westcott, S. J. Oldenburg, T. R. Lee and N. J. Halas, Langmuir, 1998, 14, 5396–5401 CrossRef CAS.
- J. Xue, C. Wang and Z. Ma, Mater. Chem. Phys., 2007, 105, 419–425 CrossRef CAS.
- B. Sadtler and A. Wei, Chem. Commun., 2002, 1604–1605, 10.1039/b204760h.
- H. Hiramatsu and F. E. Osterloh, Langmuir, 2003, 19, 7003–7011 CrossRef CAS.
- C. Graf, S. Dembski, A. Hofmann and E. Rühl, Langmuir, 2006, 22, 5604–5610 CrossRef CAS PubMed.
- L. Lu, H. Zhang, G. Sun, S. Xi, H. Wang, X. Li, X. Wang and B. Zhao, Langmuir, 2003, 19, 9490–9493 CrossRef CAS.
- S. Pang, T. Yang and L. He, TrAC, Trends Anal. Chem., 2016, 85, 73–82 CrossRef CAS.
- S. Lee, H. Chon, M. Lee, J. Choo, S. Y. Shin, Y. H. Lee, I. J. Rhyu, S. W. Son and C. H. Oh, Biosens. Bioelectron., 2009, 24, 2260–2263 CrossRef CAS PubMed.
- D. G. Duff, A. Baiker and P. P. Edwards, Langmuir, 1993, 9, 2301–2309 CrossRef CAS.
- D. A. Genov, A. K. Sarychev and V. M. Shalaev, J. Nonlinear Opt. Phys. Mater., 2003, 12, 419–440 CrossRef.
- D.-F. Zhang, L.-Y. Niu, L. Jiang, P.-G. Yin, L.-D. Sun, H. Zhang, R. Zhang, L. Guo and C.-H. Yan, J. Phys. Chem. C, 2008, 112, 16011–16016 CAS.
- N. G. Bastús, F. Merkoçi, J. Piella and V. Puntes, Chem. Mater., 2014, 26, 2836–2846 CrossRef.
- A. Biswas, H. Eilers, F. Hidden, O. C. Aktas and C. V. S. Kiran, Appl. Phys. Lett., 2006, 88, 013103 CrossRef.
- K. Kneipp, H. Kneipp and J. Kneipp, Acc. Chem. Res., 2006, 39, 443–450 CrossRef CAS PubMed.
- D. D. A. Grube, T. Kiely and L. Wu, U. S. Environ. Prot. Agency, 2011 Search PubMed.
- D.-K. Lim, K.-S. Jeon, H. M. Kim, J.-M. Nam and Y. D. Suh, Nat. Mater., 2010, 9, 60–67 CrossRef CAS PubMed.
- W. Stöber, A. Fink and E. Bohn, J. Colloid Interface Sci., 1968, 26, 62–69 CrossRef.
- B. T. Draine and P. J. Flatau, J. Opt. Soc. Am. A, 1994, 11, 1491–1499 CrossRef.
- E. D. Palik, Handbook of Optical Constants of Solids, Academic press, 1991 Search PubMed.
Footnotes |
| † Electronic supplementary information (ESI) available. See DOI: 10.1039/c6ra26213a |
| ‡ These authors contributed equally to the work. |
| § Present address: Wellman Center for Photomedicine, Harvard Medical School, Massachusetts General Hospital, 149 13th Street, Charlestown, Massachusetts 02129, USA. |
| This journal is © The Royal Society of Chemistry 2017 |

