 Open Access Article
Creative Commons Attribution 3.0 Unported Licence
Fluorometric “Turn-On” glucose sensing through the in situ generation of silver nanoclusters†
Yang Chen*a,
Yuanqing Sunab,
Rongjun Songa,
Shanliang Songb,
Yue Zhaob,
Xudong Yangb,
Cong Yuc and
Quan Lin*b
aCollege of Science, Northeast Forestry University, Harbin, 150040, P. R. China. E-mail: ychen@nefu.edu.cn
bState Key Laboratory of Supramolecular Structure and Materials, College of Chemistry, Jilin University, Changchun, 130012, P. R. China. E-mail: linquan@jlu.edu.cn
cState Key Laboratory of Electroanalytical Chemistry, Changchun Institute of Applied Chemistry, Chinese Academy of Sciences, Changchun, 130022, P. R. China
First published on 5th January 2017
Abstract
Fluorometric “turn-on” glucose detection is presented that is based on the Fenton reaction which can trigger the generation of Ag nanoclusters (Ag NCs). Oxidation of D-glucose by glucose oxidase generates H2O2. Reactive radicals are formed from the Fenton reaction of H2O2 and Fe2+. These radicals initiate the polymerization of methacrylic acid to form poly(methacrylic acid) which is used as a template to generate fluorescent Ag NCs in situ by illumination with UV light. The increase in Ag NCs fluorescence intensity can be used to quantify glucose concentration. The sensing approach employed here provides a new strategy for the determination of glucose selectively.
Introduction
Fluorescent metal nanoclusters (NCs), especially those made of gold and silver, are a class of nanomaterials consisting of only several to tens of atoms. The size of the NCs is typically ∼1 nm, which is comparable to the Fermi wavelength of electrons.1a The strong quantum confinement of free electrons show obvious effects on these ultra-small particles, and new physical and chemical properties emerge.1b Owing to their ultra-small size, the NCs give rise to discrete electronic energy levels and unique geometric structures, which are significantly different from the larger nanoparticles (NPs).1 As a result, metal NCs exhibit unique molecular-like properties, such as well-defined molecular structures and strong fluorescence.1 These NCs have received great attentions in recent years due to their unique optical, electrical, and chemical properties. They exhibit excellent features such as strong photoluminescence, size-dependent tunable emission, high photoluminescence quantum yield, excellent photo-stability, and good biocompatibility.2 The emissive NCs offer a new platform for the construction of various novel biosensors.3Silver nanoclusters are generally fluorescent upon photoexcitation. They have been widely used in many fields, such as biosensing, bioimaging, antibacterial agent, and cancer radiotherapy.4,5 Template-based synthesis is an efficient and facile method to prepare highly fluorescent Ag NCs. The frequently used templates are nucleic acids, polymers, peptides, proteins, and free thiol containing molecules.6 Common routes for the synthesis of water dispersible fluorescent Ag NCs employ the reduction of silver salt precursors containing a suitable template through a chemical, photochemical, or sonochemical reduction procedure.7
Glucose is an important carbohydrate in biology. It is a basic necessity of human and plays vital roles in body metabolism. Cells use it as energy source and a metabolic intermediate in most organisms. The concentration of glucose is maintained within a proper range through the interplay of several endocrine and neural glucostatic systems.8 An abnormal level of glucose can cause severe diseases such as diabetes. Therefore, glucose detection is of great importance in life science and clinical analysis.9 And the construction of an efficient glucose sensor is of great significance.
A variety of methods have been proposed for the accurate estimation of glucose concentration, such as the electrochemical, chemiluminescent, colorimetric, surface-enhanced Raman scattering, and fluorometric assays.10 Among these methods, fluorometric methods have been well established.10e,11 Recently, selective detection of glucose level using fluorescent metal nanoclusters has drawn considerable attentions.4a,12 However, most of the methods employed existing NCs. In addition, a signal-off detection mode was used. The fluorescence of the NCs was usually quenched by H2O2 that generated from the enzymatic oxidation of glucose, which could considerably increase the likelihood of false positive signals associated with the signal-off detection.
Herein, we report that for the first time, a fluorometric “turn-on” glucose assay is constructed based on the in situ generation of Ag NCs which use the Fenton reaction product poly(methacrylic acid) (PMAA) as a template. The increase in emission intensity of the NCs solution provides a facile way for the sensing of glucose. Our method exhibits several remarkable characteristics: (1) highly fluorescent Ag NCs were generated in situ; (2) avoided the use of organic functional molecules, which considerably simplified the sensing procedures; (3) avoided the introduction of boric acid functionalities to the nanomaterials; (4) a fluorometric “turn-on” detection of glucose was constructed. This fluorescent nanocluster-based label-free method provides a new platform for selective and cost-effective detection of glucose.
Experimental
Materials
Methacrylic acid (MAA) was purchased from J&K Chemical Technology (Beijing, China). D-Glucose monohydrate, glucose oxidase (GOx), dialysis membrane (1000 MWCO) were purchased from Sangon Biotech Co., Ltd. (Shanghai, China). Ferrous sulfate heptahydrate (FeSO4·7H2O) was purchased from Beijing Chemical Works (Beijing, China). Silver nitrate (AgNO3) was purchased from Sinpharm Chemical Reagent Co., Ltd. (Beijing, China). The ultra-pure water used throughout the experiments was purified with a Milli-Q A10 filtration system (Millipore, Billerica, MA, USA). MAA was purified through vacuum distillation at 60 °C and stored in a refrigerator (−20 °C) before use. All other reagents were of analytical grade and used without further purification.Characterization
Emission spectra were recorded on a Fluoromax-4 spectrofluorometer (Horiba Jobin Yvon Inc., USA). Excitation wavelength was 480 nm and the emission spectra were corrected against photomultiplier tube (PMT) response. Excitation and emission slit widths were both of 5 nm. UV-Vis absorption spectra were collected using a Cary 50 Bio Spectrophotometer (Varian Inc., CA, USA). Quartz cuvettes with 10 mm path length and 2 mm window width were used for fluorescence and UV-Vis measurements. X-ray photoelectron spectroscopy (XPS) spectra were obtained using a VG Thermo ESCALAB 250 spectrometer (VG Scientific) operated at 120 W. Transmission electron microscopy (TEM) measurements were performed on a FEI TECNAI G2 high-resolution transmission electron microscope (the Netherlands) operated at an accelerating voltage of 200 kV. Samples were prepared by placing a drop of the Ag NCs solution onto a carbon-coated copper grid and then dried at room temperature. UV light source was from the UVP GelDoc-It TS Imaging System (Upland, CA, USA). All spectra were taken at an ambient temperature of 22 °C unless otherwise specified.Fenton reaction triggered generation of Ag NCs for glucose sensing
A typical experimental procedure is as follows: different volumes of D-glucose were mixed with 20 μL GOx (0.1 mg mL−1), 20 μL citrate buffer (100 mM, pH 5.5), and a certain amount of water. The samples were incubated at 37 °C for 2 h. Final concentrations: 5 μg mL−1 GOx. Final sample volume: 400 μL.40 μL MAA (5 M), 10 μL FeSO4 (50 mM), and 50 μL citrate buffer (100 mM, pH 3.0) were added to the 400 μL sample mixtures. The sample solutions were left standing for 30 min. Final concentrations: 400 mM MAA, 1 mM FeSO4. Final sample volume: 500 μL. The solutions were then dialyzed against water overnight.
200 μL of the aforementioned polymerization solution, 80 μL AgNO3 (100 mM), 40 μL HAc-NaAc buffer (100 mM, pH 4.5), and 80 μL water were mixed together. The solutions were then irradiated under UV light (302 nm, 8W × 4) for 4 min. Fluorescence spectra were measured immediately after the irradiation. Final sample volume: 400 μL.
All the experiments were repeated three times.
Results and discussion
The detection strategy is schematically depicted in Scheme 1. The enzymatic oxidation of D-glucose in the presence of O2 could generate H2O2, which can oxidize Fe2+ in the Fenton reagent. The Fenton reaction leads to the generation of radicals, which initiate the polymerization of MAA. The polymerization product PMAA can be used as a template to prepare the fluorescent Ag NCs under UV illumination. The oxidation of glucose leads to these series of reactions and fluorescent Ag NCs are generated as a result. The changes in emission intensity of the Ag NCs are directly related to glucose concentration.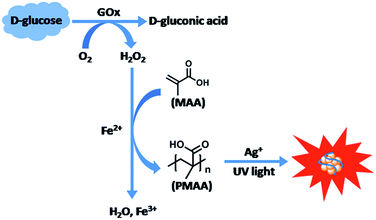 | ||
| Scheme 1 Schematic illustration of the Fenton reaction triggered generation of fluorescent Ag NCs for glucose sensing. | ||
Literature reports have showed that the enzymatic oxidation of glucose can generate H2O2,4a,9 which can in turn generate reactive radicals.10c,13 In order to demonstrate that the fluorescent Ag NCs can only be generated in the presence of the polymerization product PMAA under our experimental conditions, control experiments were carried out. The results show that a commercial PMAA (Mw = 6500) can be used as a template to prepare the fluorescent Ag NCs (Fig. S1, ESI†). Fig. S2† shows that no fluorescent Ag NCs formation was observed in the absence of glucose. When GOx, MAA and Ag+ were mixed, hardly any NCs fluorescence was observed. This is because that no H2O2 was generated, which could not induce the Fenton reaction, and no PMAA formed as a result. Similar result was obtained in the absence of GOx. Glucose and GOx alone also cannot induce the formation of the fluorescent Ag NCs. Sample 4 shows that no NCs emission was observed without the addition of the MAA monomer. Similar result was observed in sample 5. It indicates that MAA itself cannot induce the formation of the Ag NCs. The fluorescent Ag NCs were prepared when only the MAA polymerization was initiated through the Fenton reaction.
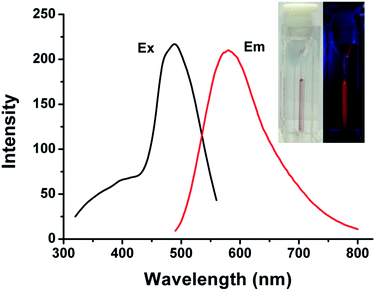
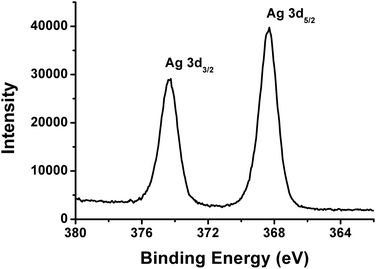
Fluorescent silver nanoclusters were prepared through the photochemical reduction procedure. The brown solution of the Ag NCs emits intense orange fluorescence under 365 nm UV light (Fig. 1, inset photos). The fluorescent Ag NCs show an emission with peak maximum at 585 nm under 480 nm excitation (Fig. 1). The size distribution of the resultant fluorescent Ag NCs was characterized by TEM. As shown in Fig. 2, the average size of the NCs is 1.64 nm. No large Ag particles or aggregates were detected by TEM. The absorption band of the Ag NCs is located at 510 nm (Fig. S3†). The absence of large Ag nanoparticles led to pure NCs absorption spectrum without surface plasmon bands in the 400–450 nm region.14 X-ray photoelectron spectroscopy (XPS) study was carried out to analyze the valence states of Ag (Fig. 3). The binding energy values of Ag(3d5/2) and Ag(3d3/2) are 368.3 eV and 374.3 eV, respectively, which indicate that Ag(I) was reduced to Ag(0) after UV illumination.15
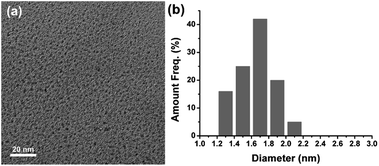 | ||
| Fig. 2 (a) TEM image of the Ag NCs, and (b) the corresponding size distribution of the Ag NCs. Conditions: 600 μM glucose, 400 mM MAA, 4 min irradiation time. | ||
We have investigated the optimum assay conditions such as the MAA concentration and the illumination time in order to get the best sensing performance. MAA of various concentrations (0–500 mM) were tested, and the possible formation of the Ag NCs was estimated by measurement of the changes in emission spectra (Fig. S4†). The results show that at lower concentrations of MAA (≤100 mM), very weak Ag NCs emission was observed. With the increase of MAA concentration, the NCs emission increased, and the emission intensity reached a maximum value when 400–500 mM of MAA was used. The optimized MAA concentration of 400 mM was therefore used at current investigation.
The changes in emission spectra of the Ag NCs with UV illumination time are displayed in Fig. S5.† Prior to UV illumination, the fluorescence spectrum shows no obvious emission. With the increase of the illumination time, increased emission intensity of the Ag NCs was observed. Strongest emission was observed at 4 minutes illumination. Prolonged UV illumination led to decreased emission of the Ag NCs, which may be a result of the formation of larger non-fluorescent Ag nanoparticles.7b,14b,15a Four minutes UV illumination was therefore selected for the preparation of the Ag NCs.
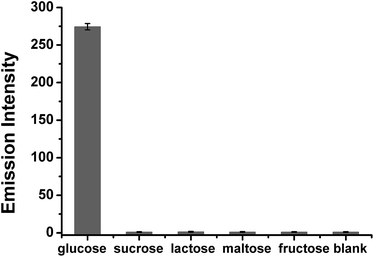
Glucose determination experiments were conducted under the optimized assay conditions. Fig. 4 shows that with the increase of the glucose concentration, increased Ag NCs emission was observed. The emission intensity changes of the Ag NCs were in direct proportion to the logarithm of the glucose concentration in the range of 225–1100 μM. However, we face the challenge to extend our sensing system to real samples. As free radicals are not stable, they may be quenched in the complicated system, and the monomer MAA cannot be initiated as a result. To address the selectivity of the assay, four sugars (sucrose, lactose, maltose, and fructose) were tested (Fig. 5). The results show that none of them had the ability to induce the formation of the Ag NCs. Thus our assay is quite selective for glucose.
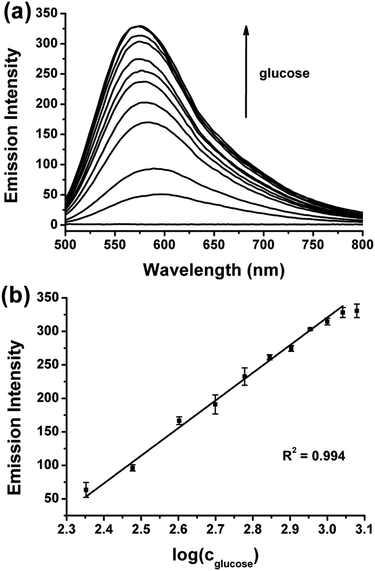 | ||
| Fig. 4 (a) Changes in emission spectrum as a function of glucose concentration (λex = 480 nm), (b) changes in maximum emission intensity of (a) versus glucose concentration. | ||
Conclusions
A fluorometric “turn-on” detection of glucose based on the Fenton reaction triggered generation of Ag NCs is developed. The enzymatic oxidation of glucose in the presence of O2 could generate H2O2. The polymerization of MAA could be initiated by the radicals that generated from the Fenton reaction. The product PMAA was used as template for the preparation of the fluorescent Ag NCs. The changes in emission intensity of the Ag NCs were directly related to the amount of glucose in the solution. The assay offers a new nanoscale platform for the determination of glucose. We envision that this detecting system could be used in glucose sensing related biochemical and biomedical research, which is of great significance in the early diagnosis of diseases.Acknowledgements
This work was supported by the National Natural Science Foundation of China (51373061 and 51603018), and the Fundamental Research Funds for the Central Universities (2572015BX01).Notes and references
- (a) J. Zheng, P. R. Nicovich and R. M. Dickson, Annu. Rev. Phys. Chem., 2007, 58, 409 CrossRef CAS PubMed; (b) K. Zheng, X. Yuan, N. Goswami, Q. Zhang and J. Xie, RSC Adv., 2014, 4, 60581 RSC.
- (a) L. Shang, S. Dong and G. U. Nienhaus, Nano Today, 2011, 6, 401 CrossRef CAS; (b) N. Goswami, Q. Yao, Z. Luo, J. Li, T. Chen and J. Xie, J. Phys. Chem. Lett., 2016, 7, 962 CrossRef CAS PubMed; (c) X. Song, N. Goswami, H. Yang and J. Xie, Analyst, 2016, 141, 3126 RSC; (d) K. Zheng, X. Yuan, K. Kuah, Z. Luo, Q. Yao, Q. Zhang and J. Xie, Chem. Commun., 2015, 51, 15165 RSC.
- (a) Y. Chen, H. Zhou, Y. Wang, W. Li, J. Chen, Q. Lin and C. Yu, Chem. Commun., 2013, 49, 9821 RSC; (b) Y. Chen, Y. Wang, C. Wang, W. Li, H. Zhou, H. Jiao, Q. Lin and C. Yu, J. Colloid Interface Sci., 2013, 396, 63 CrossRef CAS PubMed; (c) Y. Chen, W. Li, Y. Wang, X. Yang, J. Chen, Y. Jiang, C. Yu and Q. Lin, J. Mater. Chem. C, 2014, 2, 4080 RSC; (d) Y. Yu, B. Y. L. Mok, X. J. Loh and Y. N. Tan, Adv. Healthcare Mater., 2016, 5, 1844 CrossRef CAS PubMed.
- (a) X. Liu, F. Wang, A. Niazov-Elkan, W. Guo and I. Willner, Nano Lett., 2013, 13, 309 CrossRef CAS PubMed; (b) F. Cao, E. Ju, C. Liu, F. Pu, J. Ren and X. Qu, Chem. Commun., 2016, 52, 5167 RSC; (c) X. Ran, Z. Wang, Z. Zhang, F. Pu, J. Ren and X. Qu, Chem. Commun., 2016, 52, 557 RSC; (d) Z. Huang, Y. Tao, F. Pu, J. Ren and X. Qu, Chem.–Eur. J., 2012, 18, 6663 CrossRef CAS PubMed.
- (a) K. Zheng, M. I. Setyawati, T. P. Lim, D. T. Leong and J. Xie, ACS Nano, 2016, 10, 7934 CrossRef CAS PubMed; (b) L. Zhang, Y. He, N. Goswami, J. Xie, B. Zhang and X. Tao, Chemosphere, 2016, 153, 322 CrossRef CAS PubMed; (c) N. Goswami, K. Zheng and J. Xie, Nanoscale, 2014, 6, 13328 RSC; (d) Z. Luo, K. Zheng and J. Xie, Chem. Commun., 2014, 50, 5143 RSC.
- I. Díez and R. H. A. Ras, Nanoscale, 2011, 3, 1963 RSC.
- (a) S. Sun, H. Wang and X. Yan, Chem. Commun., 2011, 47, 3817 RSC; (b) L. Shang and S. Dong, Chem. Commun., 2008, 1088 RSC; (c) H. Xu and K. S. Suslick, ACS Nano, 2010, 4, 3209 CrossRef CAS PubMed.
- F. Rolland, J. Winderickx and J. M. Thevelein, Trends Biochem. Sci., 2001, 26, 310 CrossRef CAS PubMed.
- S. P. Nichols, A. Koh, W. L. Storm, J. H. Shin and M. H. Schoenfisch, Chem. Rev., 2013, 113, 2528 CrossRef CAS PubMed.
- (a) X. Wang, X. Dong, Y. Wen, C. Li, Q. Xiong and P. Chen, Chem. Commun., 2012, 48, 6490 RSC; (b) P. Yang, S. Jin, Q. Xu and S. Yu, Small, 2013, 9, 199 CrossRef CAS PubMed; (c) C. Xu, J. Ren, L. Feng and X. Qu, Chem. Commun., 2012, 48, 3739 RSC; (d) K. V. Kong, Z. Lam, W. K. O. Lau, W. K. Leong and M. Olivo, J. Am. Chem. Soc., 2013, 135, 18028 CrossRef CAS PubMed; (e) X. Wang, J. Hu, G. Zhang and S. Liu, J. Am. Chem. Soc., 2014, 136, 9890 CrossRef CAS PubMed.
- (a) L. Sang and H. Wang, Anal. Chem., 2014, 86, 5706 CrossRef CAS PubMed; (b) P. Shen and Y. Xia, Anal. Chem., 2014, 86, 5323 CrossRef CAS PubMed; (c) C. Zhang, Y. Yuan, S. Zhang, Y. Wang and Z. Liu, Angew. Chem., Int. Ed., 2011, 50, 6851 CrossRef CAS PubMed.
- (a) Y. C. Shiang, C. C. Huang and H. T. Chang, Chem. Commun., 2009, 3437 RSC; (b) L. Jin, L. Shang, S. Guo, Y. Fang, D. Wen, L. Wang, J. Yin and S. Dong, Biosens. Bioelectron., 2011, 26, 1965 CrossRef CAS PubMed; (c) Y. Li, Q. Ma, Z. Liu, X. Wang and X. Su, Anal. Chim. Acta, 2014, 840, 68 CrossRef CAS PubMed; (d) X. Xia, Y. Long and J. Wang, Anal. Chim. Acta, 2013, 772, 81 CrossRef CAS PubMed; (e) T. Wen, F. Qu, N. B. Li and H. Q. Luo, Anal. Chim. Acta, 2012, 749, 56 CrossRef CAS PubMed; (f) X. Wu, R. Li and Z. Li, RSC Adv., 2014, 4, 9935 RSC.
- (a) Y. Sun and T. L. Huang, J. Polym. Res., 1995, 2, 47 CrossRef CAS; (b) G. Cirillo, F. Puoci, M. Curcio, O. I. Parisi, F. Iemma, U. G. Spizzirri and N. Picci, Colloid Polym. Sci., 2010, 288, 689 CrossRef CAS; (c) A. Waly, N. Y. Abou-Zeid, E. A. El-Alfy and A. Hebeish, Angew. Makromol. Chem., 1982, 103, 61 CrossRef CAS.
- (a) I. Díez, M. Pusa, S. Kulmala, H. Jiang, A. Walther, A. S. Goldmann, A. H. E. Müller, O. Ikkala and R. H. A. Ras, Angew. Chem., Int. Ed., 2009, 48, 2122 CrossRef PubMed; (b) J. Zhang, S. Xu and E. Kumacheva, Adv. Mater., 2005, 17, 2336 CrossRef CAS.
- (a) X. Wang, S. Xu and W. Xu, Nanoscale, 2011, 3, 4670 RSC; (b) C. Wang, Y. Wang, L. Xu, D. Zhang, M. Liu, X. Li, H. Sun, Q. Lin and B. Yang, Small, 2012, 8, 3137 CrossRef CAS PubMed.
Footnote |
| † Electronic supplementary information (ESI) available: Experimental details and supplementary figures. See DOI: 10.1039/c6ra26303h |
| This journal is © The Royal Society of Chemistry 2017 |

