 Open Access Article
An ultrasensitive near-infrared satellite SERS sensor: DNA self-assembled gold nanorod/nanospheres structure†
Nan Yanga,
Ting-Ting Youb,
Xiu Lianga,
Chen-Meng Zhanga,
Li Jiangc and
Peng-Gang Yin *a
*a
aKey Laboratory of Bio-Inspired Smart Interfacial Science and Technology of Ministry of Education, School of Chemistry and Environment, Beihang University, Beijing 100191, China. E-mail: pgyin@buaa.edu.cn
bSchool of Physics and Nuclear Energy Engineering, Beihang University, Beijing 100191, China
cChina Jiliang University, College of Optical and Electronic Technology, China
First published on 30th January 2017
Abstract
Coupled plasmonic assemblies have recently attracted tremendous research interest in the field of Surface Enhanced Raman Scattering (SERS) due to their unique optical and biocompatible properties. Using DNA to connect different parts of assembled plasmonic nanostructures has been a simple but useful method to achieve the expected nanocomposites. This work prepared a satellite SERS substrate based on gold nanorod/gold nanosphere structures, in the hope of providing a novel SERS sensor for biomedicine related applications. A seed growth method was adopted to fabricate gold nanorods, using a region specific method to connect the gold nanorod core with the gold nanosphere satellites. The fabricated nanocomposites were further self-assembled with p-mercaptobenzoic acid (p-MBA) molecule layers as Raman reporters for SERS experiments. The obtained satellite nanostructure could produce “hot spots” between the gold nanorods and gold nanospheres to improve the SERS sensitivity and also to function as a key factor to tune the localized surface plasmon resonance (LSPR) absorption band to the near-infrared region. Finally, the optimized satellite SERS sensor was applied in the detection of Crystal Violet (CV) with a limit of detection as low as 10−11 M, proving that the self-assembled nanocomposite could act as an effective substrate for single molecule detection.
Introduction
Noble metal nanostructures have fascinating optical properties due to localized surface plasmon resonances (LSPRs) and have found wide application in SERS, which has become a great analytical technique with high sensitivity and practical usage in vivo/vitro for biological requirements.1–5 Metallic nanostructures, especially gold, silver, and copper nanostructures, are often used as substrates which can strongly enhance the Raman signal due to electromagnetic enhancement.1,4,5 Synthesis of gold nanoparticles has been studied for a long time, while non-spherical nanoparticles have only been developed in the past decade compared to most spherical gold nanoparticles.6 In the ultraviolet spectrum, gold nanospheres (AuNSs) have only a single peak at around 520 nm. However, gold nanorods (AuNRs) have two kinds of peak called transverse and longitudinal bands, which are caused by the differences between length and width.7,8 The peaks are tunable depending on the aspect ratio of the AuNRs. The most attractive part is that we can control the transverse band to make it occur in the visible region while the longitudinal band occurs in the near-infrared (NIR) region, which broadens their application in biotechnologies.9–12 In order to form hot-spots to produce extraordinary enhancement, large numbers of coupled plasmonic assemblies have been designed.1,12 For instance, Xu and his co-workers found that the satellite structures assembled by noble metal nanoparticles can form numerous in-built electromagnetic hot-spots to produce a remarkable enhancement in the Raman signal as well as to provide great stability for various kinds of detection.5,13–15 Some nanoscale forces have been used to fabricate core–satellite nanoassemblies, such as DNA hybridization, functional polymer linking, covalent forces, metal ion–organic ligand complexation, electrostatic attraction and hydrogen bonding.16 Using DNA as a building block to assemble plasmonic nanostructures has been a powerful approach, but great challenges still exist in the complex synthetic process.16–20 The unique base-pairing property of DNA can realize specific geometric control in the synthetic process.21 Therefore DNA based self-assemblies have promising biocompatibility and can be used as biosensors, catalysts, optical devices, for imaging and therapeutical aspects.22–24In this work, we synthesize monodispersed AuNRs with a high aspect ratio using a seed mediated growth method, and assembled the fabricated nanorods with AuNSs by DNA to form an AuNR/AuNSs satellite structure. The nanocomposites allow for very orderly fabrication and sensitivity with a simple preparation method and fast detection progress. Therefore these can be applied as SERS sensors and exhibit a great enhancement effect for reporter as 4-MBA, R6G and CV, making them a promising candidate for single-molecule detection.
Experimental methods
Materials
Chloroauric acid (HAuCl4) and crystal violet (CV) used for this study were purchased from Sigma-Aldrich (Shanghai, China). All oligonucleotides used were purchased from Takara Biotechnology (Dalian, China). p-Mercaptobenzoic acid (p-MBA) was purchased from Tokyo chemical industry Co. Cetyltrimethyl Ammonium Bromide (CTAB) was purchased from Lanyi Factory Co. (Beijing, China). Sodium oleate (NaOL) was purchased from Hushi laborator equipment Co. (Shanghai, China). Silver nitrate (AgNO3) and sodium borohydride (NaBH4) were purchased from Guanghua Chemical Factory Co. (Guangdong, China). Ascorbic acid (AA) was purchased from Xilong Factory Co. (Guangdong, China). All syntheses used Ultrapure MilliQ water. All the glassware was cleaned with aqua regia and rinsed with MilliQ water multiple times and then dried before use.Synthesis of the AuNRs
The seed mediated growth method was adopted to synthesize monodispersed AuNRs with a high aspect ratio.25In order to clean the AuNRs more thoroughly, it's better to use warm water to wash the CTAB out. The AuNRs were isochoric at 10 ml.
Synthesis of the AuNS
G. Frens's standard procedure was employed to synthesize the AuNS.26 2 ml of 50 mM chloroauric acid was added to 98 ml of Ultrapure MilliQ water to give a final concentration of 1 mM. Then the diluted chloroauric acid was heated to boiling before 2 ml of 194 mM trisodium citrate was added. After approximately 70 s the solution changed to a brilliant red. Then it was continuously boiled for 20 min to form spherical particles completely. The mixture solution was cooled to room temperature with gentle shaking. Then the monodispersed AuNS with a size of 16 nm was obtained.Self-assembly of AuNR and AuNSs
0.5 ml of AuNRs was diluted to 10 ml with Ultrapure MilliQ water. Then 1 μL DNA oligomers ASY1 with a sequence of TTA TAA CTA TTC CTA AAA AAA AAA A C(6)SH was added to 300 μL of diluted AuNRs. Single-strand DNA-modified AuNRs (AuNR-ASY1) were obtained after incubation at room temperature for 12 h. 0.5 ml of AuNPs was diluted to 10 ml with Ultrapure MilliQ water. Then 2 μL of DNA oligomers ASY2 with a sequence of TAG GAA TAG TTA TAA AAA AAA AAA A C(6)SH was added to 600 μL of diluted AuNS. Single-strand DNA-modified AuNSs (AuNS-ASY2) were obtained after incubation at room temperature for 12 h. The AuNR-ASY1 and AuNS-ASY2 were heated for 15 min at 60 °C. Then 50 μL of AuNR-ASY1 was mixed with 100 μL of AuNS-ASY2 in 20 μL of Ultrapure MilliQ water, which could make the DNA oligomers more pliable and base pairing easier.27 Then 4-mercaptobenzoic acid (4-MBA) was modified with an AuNR/AuNSs satellite SERS sensor until a concentration of 10−3 M 4-MBA was reached.Characterization
TEM images were obtained using a JEM-2100F transmission electron microscope operated at 200 kV. The UV-vis spectrophotometer and fittings were provided by SHIMADZU (Japan) Co., Ltd. Raman spectra were recorded with a JY HR800 Raman spectrometer (HORIBA Jobin Yvon), equipped with a 50× objective (NA = 0.5) and a He–Ne laser with 633 nm wavelength; the laser power values measured in the experiments were obtained from a power meter (mW at the samples with a spot area of approximately 1.4 μm2). The Raman band of a silicon wafer at 520.8 cm−1 was used to calibrate the spectrometer.Results and discussion
Morphology characterization
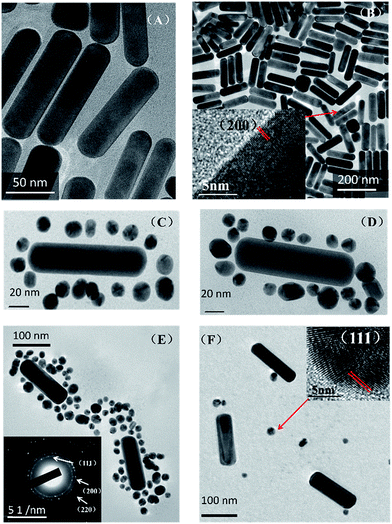
Transmission electron microscopy (TEM) images (Fig. 1) demonstrate the assembly of the AuNR and AuNSs. From TEM images Fig. 1(A) and (B), we can see that the average size of the AuNR is [127 ± 5/34 ± 1] with an aspect ratio of 3.74. And the average size of the AuNS is 16 nm. Fig. 1(B) shows the High-resolution TEM (HRTEM) of AuNRs. The lattice distance is 2.05 Å, corresponding to a lattice distance of (200) surfaces of Au. The TEM images (C and D) show clearly that the AuNS are attached on the oligomer template surrounding the AuNRs and form the so-called satellite structure (Scheme 1). Selected area electron diffraction (SAED) of AuNR/AuNSs satellite nanocomposites is shown in Fig. 1(E). We can clearly distinguish the (111), (200) and (220) surfaces of the Au crystal. A representative TEM image containing a higher number of satellite nanostructures is provided in ESI Fig. S1.† Fig. 1(F) shows the AuNRs mixed with AuNS in the absence of DNA which proves the effective regiospecific connected function. And the HRTEM indicated the (111) surface of Au on account of the lattice distance being 2.3 Å. We can identify (111), (200), (200) and (311) surfaces of Au by comparison of the X-ray diffraction (XRD) in Fig. 2(A) with standard PDF card (04-0784). Energy Dispersive Spectrometer (EDS) analysis (Fig. 2(B)) indicated that gold was present, which was attributed to AuNRs and AuNSs. The AuNRs with a high aspect ratio can assemble more easily than AuNS due to the decrease in the space steric hindrance. The mechanism is similar to the one-step regiospecific reactions in organic chemistry for which the AuNS could be considered an analog of atoms or chemical groups.28 Murray's group demonstrated that the concentration of CTAB can influence the formation of AuNRs by adsorbing along certain directions and restraining crystal growth in those areas selectively.25 In Xu's work, an assembly mechanism was proposed that CTAB prefer to adhere along the (100) and (111) facets, which exist at the sides and ends of the AuNRs, respectively.29,30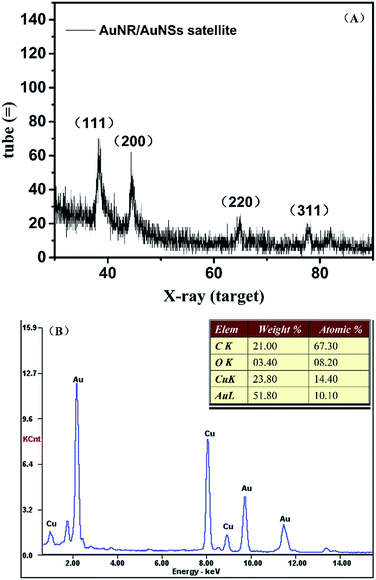 | ||
| Fig. 2 (A) X-ray diffraction and (B) energy dispersive spectrometer analysis of AuNR/AuNSs satellite nanocomposites. | ||
So the facet of AuNRs with a (100) or (111) plane has higher energy and can more easily attach to the DNA oligomers which allows them to assemble with AuNS and form the satellite structure.29–31
Morphology optimization
The amount of DNA used during the assembly process plays an important role in optimizing the morphology of the satellite structure.19,31 Three different DNA concentrations (75 μM, 75 nM, 75 pM) were used in our work while the ratio between AuNR and AuNS is fixed at 0.5. Fig. 3(A) shows the TEM of prepared AuNR/AuNSs satellite nanocomposites with a DNA concentration of 75 μM.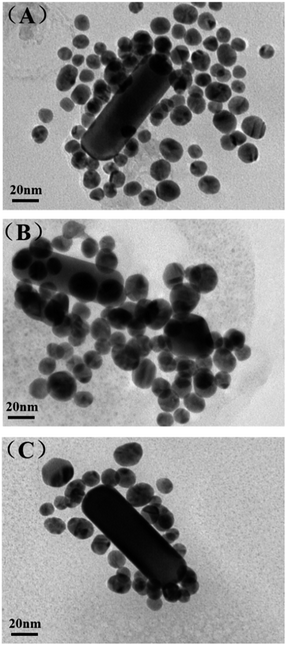 | ||
| Fig. 3 TEM images of AuNR/AuNSs satellite nanocomposites with different DNA concentrations: (A) 75 μM; (B) 75 nM; (C) 75 pM. | ||
We find the assembled structure far from satisfactory with randomly distributed AuNS easily aggregating together due to the high ionic strength that affects the monodispersal of gold nanoparticles. The TEM image of AuNR/AuNSs satellite nanocomposites with a DNA concentration of 75 nM (Fig. 3(B)) indicated an improvement in morphology which still needs further optimizing. So we further reduced the concentration of DNA to 75 pM and the satellite structure was successfully obtained with AuNR tightly surrounded by AuNSs, as shown in Fig. 3(C). Thus, the optimal DNA concentration was finally estimated and adopted for all experiments in this work. The SERS spectra of AuNR/AuNS satellite nanocomposites with different DNA concentrations are shown in ESI Fig. S2.†
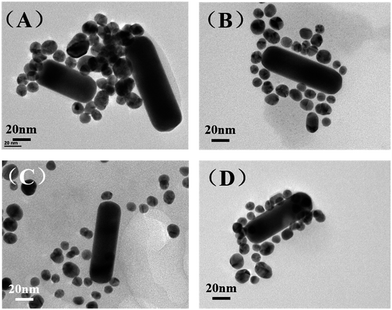
In the following section, we will discuss the influence of AuNR/AuNSs ratios and heat conditions in the assembly procedure. Fig. 4(A) and (B) show TEM images of prepared AuNR/AuNSs satellite nanocomposites with two different AuNR/AuNSs ratios (1 and 0.5) (SERS spectra are shown in ESI Fig. S3†). When the ratio was set to 1, AuNSs failed to completely cover the AuNR all around, while the satellite structure is adequately formed with an AuNR/AuNSs ratio of 0.5 (50 μL AuNR-ASY1 and 100 μL of AuNS-ASY2) in a self-assembly process. Different heat conditions are shown in Fig. 4(C) and (D) (SERS spectra are shown in ESI Fig. S4†). It's obvious that the satellite structure is more well-organized after heating, because heating can increase flexibility of the DNA oligomers which makes them more pliable and makes base pairing easier.32–34
Optical characterization
UV absorption spectroscopy is an easy but useful way to prove the combination of gold nanoparticles and DNA oligomers as well as their base-pairing. The strong absorption and scattering of AuNRs in the NIR region is fascinating for its potential biological applications. So we tested the UV absorption spectroscopy of the optimized AuNR/AuNSs satellite nanocomposites and the change after connecting with DNA oligomers of monodispersed AuNS and AuNR. As displayed in Fig. 5(A), the characteristic peak of the monodispersed AuNS appears at 522 nm which is in accordance with the average size of 16 nm shown in TEM. Those two strong plasmon peaks at 515 and 832 nm belong to transverse and longitudinal bands of the AuNR (Fig. 5(B)). Obviously, the typical peaks will experience a red shift due to the increase in the local refractive index after combination with the DNA oligomers. Therefore, the transverse band of the AuNRs is shifted from 515 to 519 nm while the longitudinal plasmon band shifted from 832 to 839 nm. Meanwhile, the AuNS show the same shift trend as that from 522 to 525 nm. The length of DNA is subtle, so the relevant peak change is inconspicuous. However, when the base-pairing matches the AuNR and AuNS together, we can find an obvious red shift from 515 to 525 nm and 832 to 868 nm concomitantly, due to the split in the energy level of the plasmon oscillations produced by AuNR/AuNSs satellite nanocomposite coupling modes.35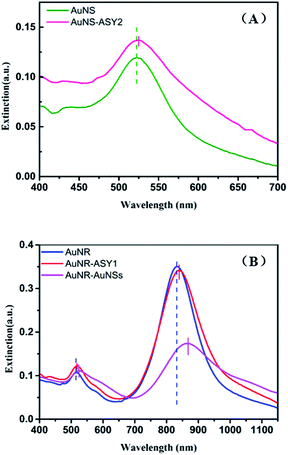 | ||
| Fig. 5 UV-vis spectra (A) AuNS (green line), AuNS-ASY2 (pink line); (B) AuNR (blue line), AuNR-ASY1 (red line) and AuNR/AuNSs satellite nanocomposites (pink line). | ||
SERS performance
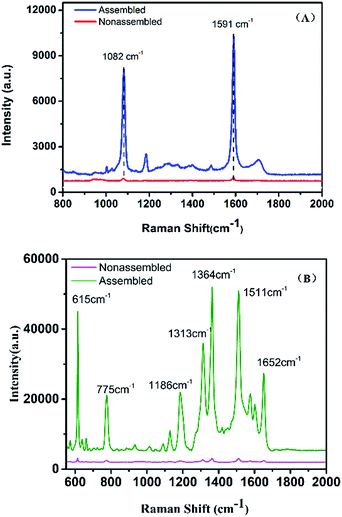
To prove the sensitivity and the reproducibility of the AuNR/AuNSs satellite assembly, the SERS performance of the substrates was tested using 4-mercaptobenzoic acid (4-MBA) and Rhodamine 6G (R6G) as Raman probes. The collected spectra in Fig. 6 indicate that the SERS signals obtained from the satellite assembly of AuNR/AuNSs were stronger than those from individual AuNRs.Remarkable differences in spectral intensity are observed between SERS from AuNR/AuNSs satellite nanocomposites and monodispersed AuNRs. In Fig. 6(A), the predominant bands are located at 1082 and 1591 cm−1, corresponding to C(benzene ring)–S stretching vibration and C–C stretching vibration on the benzene ring, which is only 0.5 K counts for the monodispersed AuNRs and increases to 6 K for the nanocomposites. In addition, the bands at 1184 and 1707 cm−1 in the SERS spectrum of nanocomposite substrates which correspond to β CH and νC![[double bond, length as m-dash]](https://www.rsc.org/images/entities/char_e001.gif) O have almost disappeared in the spectrum obtained from AuNRs, suggesting a superior SERS sensibility of the successfully fabricated hybrids. The intensity of the Raman peak at 615 cm−1, which is assigned to aromatic bending increases from 0.6 K to 30 K for AuNRs assembled with AuNSs. The Raman intensities of aromatic C–H bending at 775 and 1186 cm−1, aromatic C–C stretching at 1364, 1511 and 1652 cm−1 also increased from 0.6 K to 40 K.
O have almost disappeared in the spectrum obtained from AuNRs, suggesting a superior SERS sensibility of the successfully fabricated hybrids. The intensity of the Raman peak at 615 cm−1, which is assigned to aromatic bending increases from 0.6 K to 30 K for AuNRs assembled with AuNSs. The Raman intensities of aromatic C–H bending at 775 and 1186 cm−1, aromatic C–C stretching at 1364, 1511 and 1652 cm−1 also increased from 0.6 K to 40 K.
As for a substrate stability assessment test, we used R6G as a reporter and tested AuNR/AuNSs satellite nanocomposites after a week (ESI Fig. S7†), and the intensity was steady which proved a considerable stability. We also measured the uniformity of our satellite substrates in ESI Fig. S6.† From the principal Raman peaks of 4-MBA at 1082 and 1591 cm−1 in 5 SERS spectra, we found that the Raman signal intensities are relatively unified with a relative standard deviation (RSD) of 6.9%.
At a particular frequency of the light, the free electrons of the metal nanoparticle undergo a collective coherent oscillation in the presence of the oscillating electromagnetic field, which is termed the localized surface plasmon resonance (LSPR) oscillation.36 The junctions in the AuNR/AuNSs assembly can produce intensive electromagnetic fields compared to individual monodispersed AuNS or AuNRs, which are the dominant factor in the enhancement of the Raman signal. The closely spaced particles give rise to strong electromagnetic coupling and resonances in these satellite structures which can be described by plasmon hybridization.37 Moreover, heating of the assembled nanoparticles can provide brilliant plasmon-assisted catalysis properties.
SERS sensor for CV detection
When a roughened noble metal surface adsorbs some organic molecules such as rhodamine 6G and crystal violet, it results in an enhancement of the normal Raman signal due to the dipole of the molecule's incident field.38–40 Crystal violet (CV) has some distinctive fluorescence characteristics from the visible to near-infrared region in the spectrum which make its Raman signal difficult to detect, making it a good reporter molecule to test the SERS sensitivity of various substrates.41 Under optimized conditions, the gold nanogap formed in the assembling process via DNA hybridization provides sufficient hotspots to enhance the local electromagnetic field around the probe molecules due to the LSPR effect, and the detection limit of the nanocomposite substrates for CV was predicted to be lower than 1 × 10⁻¹¹ M (Fig. 7) which confirms the enormous enhancement and sensitivity of the satellite AuNR/AuNSs sensor. The EF of the SERS substrate was estimated by employing the formula:where ISERS and INRS are normalized Raman peak intensities of the reporter molecule chemisorbed on the SERS substrate and in the reference solution, respectively. NSERS and NNRS are the number of reporter molecules exposed to the incident laser on the SERS substrate and in the reference solution. The concentration of CV is 10−4 M for NRS and 10−7 M on the SERS substrate. According to the calculated result of 1622 cm−1 peak, the EF was estimated to be 1.05 × 10⁵ (SERS spectra of the analyte molecule are provided in ESI Fig. S5†).
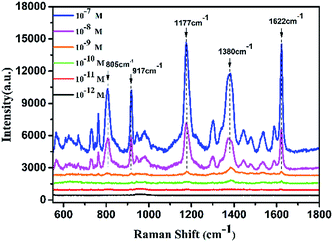 | ||
| Fig. 7 SERS spectra of CV adsorbed on AuNR/AuNSs satellite nanocomposites. The laser power was 15 mW and the acquisition time was 5 s. | ||
Conclusions
In summary, we have successfully synthesized AuNR/AuNSs satellite structures through the base pairing feature of DNA oligonucleotides, which was confirmed by characterization with TEM, UV-vis and Raman spectra. The prepared DNA-gold nanorods/nanospheres satellite structures were applied as SERS sensors with significant sensitivity and practicability. In addition, the specific optical property of the satellite structures with an LSPR peak located in the near-infrared region broadens the application in biotechnological techniques. This gold nanorods/nanosphere satellite structure exhibited great sensitivity and reproducibility for the detection of CV by SERS with a limit of detection as low as 10−11 M, proving it to be a promising technology for molecular detection in the future.Acknowledgements
This work was supported by the National Natural Science Foundation of China (51272013 & 51572009).Notes and references
- P. K. Jain, X. Huang, I. H. Elsayed and M. A. Elsayed, Acc. Chem. Res., 2008, 41, 1578–1586 CrossRef CAS PubMed.
- R. A. Alvarez-Puebla, A. Agarwal, P. Manna, B. P. Khanal, P. Aldeanueva-Potel, E. Carbó-Argibay, N. Pazos-Pérez, L. Vigderman, E. R. Zubarev and N. A. Kotov, Proc. Natl. Acad. Sci. U. S. A., 2011, 108, 8157–8161 CrossRef CAS PubMed.
- R. Bardhan, S. Lal, A. Joshi and N. J. Halas, Acc. Chem. Res., 2011, 44, 936–946 CrossRef CAS PubMed.
- D. Lin, J. Pan, H. Huang, G. Chen, S. Qiu, H. Shi, W. Chen, Y. Yu, S. Feng and R. Chen, Sci. Rep., 2014, 4, 4751 Search PubMed.
- J. Feng, X. Wu, W. Ma, H. Kuang, L. Xu and C. Xu, Chem. Commun., 2015, 51, 14761–14763 RSC.
- M. Grzelczak, J. Perez-Juste, P. Mulvaney and L. M. Liz-Marzan, Chem. Soc. Rev., 2008, 37, 1783–1791 RSC.
- M. Hu, J. Chen, Z. Y. Li, L. Au, G. V. Hartland, X. Li, M. Marquez and Y. Xia, Chem. Soc. Rev., 2006, 35, 1084–1094 RSC.
- L. M. Liz-Marzán, Langmuir, 2006, 22, 32–41 CrossRef PubMed.
- Q. Jiang, Y. Shi, Q. Zhang, N. Li, P. Zhan, L. Song, L. Dai, J. Tian, D. Yang and Z. Cheng, Small, 2015, 11, 5134–5141 CrossRef CAS PubMed.
- M. Sun, L. Xu, M. Wei, X. Wu, K. Hua, L. Wang and C. Xu, Adv. Mater., 2016, 28, 898–904 CrossRef CAS PubMed.
- X. Qian, X. H. Peng, D. O. Ansari, Q. Yin-Goen, G. Z. Chen, D. M. Shin, L. Yang, A. N. Young, M. D. Wang and S. Nie, Nat. Biotechnol., 2008, 26, 83–90 CrossRef CAS PubMed.
- A. Samanta, K. K. Maiti, K. S. Soh, X. Liao, M. Vendrell, U. S. Dinish, S. W. Yun, R. Bhuvaneswari, H. Kim and S. Rautela, Angew. Chem., Int. Ed., 2011, 50, 6089–6092 CrossRef CAS PubMed.
- L. Xu, C. Hao, H. Yin, L. Liu, W. Ma, L. Wang, H. Kuang and C. Xu, J. Phys. Chem. Lett., 2013, 4, 2379–2384 CrossRef CAS PubMed.
- X. Wu, F. Gao, L. Xu, H. Kuang, L. Wang and C. Xu, RSC Adv., 2015, 5, 97898–97902 RSC.
- J. Feng, G. Cui, L. Xu, X. Wu, W. Ma, H. Kuang and C. Xu, Biosens. Bioelectron., 2016, 81, 138–142 CrossRef CAS PubMed.
- W. Xiong, D. Sikdar, L. W. Yap, M. Premaratne, X. Li and W. Cheng, Nanoscale, 2015, 7, 3445–3452 RSC.
- Y. C. Cao, R. Jin and C. A. Mirkin, Science, 2002, 297, 1536–1540 CrossRef CAS PubMed.
- R. Elghanian, J. J. Storhoff, R. C. Mucic, R. L. Letsinger and C. A. Mirkin, Science, 1997, 277, 1078–1081 CrossRef CAS PubMed.
- D. Shi, C. Song, Q. Jiang, Z. G. Wang and B. Ding, Chem. Commun., 2013, 49, 2533–2535 RSC.
- J. J. Storhoff, A. D. Lucas, V. Garimella, Y. P. Bao and U. R. Müller, Nat. Biotechnol., 2004, 22, 883–887 CrossRef CAS PubMed.
- L. Xu, Y. Zhu, W. Ma, W. Chen, L. Liu, H. Kuang, L. Wang and C. Xu, J. Phys. Chem. C, 2011, 115, 3243–3249 CAS.
- J. I. L. Chen, Y. Chen and D. S. Ginger, J. Am. Chem. Soc., 2010, 132, 9600–9601 CrossRef CAS PubMed.
- S. J. Hurst, A. K. Lyttonjean and C. A. Mirkin, Anal. Chem., 2006, 78, 8313–8318 CrossRef CAS PubMed.
- D. Li, G. Zheng, X. Ding, J. Wang, J. Liu and L. Kong, Colloids Surf., B, 2013, 110, 485–488 CrossRef CAS PubMed.
- X. Ye, Z. Chen, J. Chen, Y. Gao and C. B. Murray, Nano Lett., 2013, 13, 765–771 CrossRef CAS PubMed.
- G. Frens, Nature Phys. Sci., 1973, 241, 20–22 CrossRef CAS.
- A. Bini, M. Minunni, S. Tombelli, S. Centi and M. Mascini, Anal. Chem., 2007, 79, 3016–3019 CrossRef CAS PubMed.
- D. D. Li, J. Wang, G. C. Zheng, J. H. Liu and W. H. Xu, Nanotechnology, 2013, 24, 241–247 Search PubMed.
- T. E. Rohr, T. Cotton, N. Fan and P. J. Tarcha, Anal. Biochem., 1989, 182, 388–398 CrossRef CAS PubMed.
- X. Guo, W. Ye, H. Sun, Q. Zhang and J. Yang, Nanoscale, 2013, 5, 12582–12588 RSC.
- L. Xu, H. Kuang, C. Xu, W. Ma, L. Wang and N. A. Kotov, J. Am. Chem. Soc., 2011, 134, 1699–1709 CrossRef PubMed.
- L. D. Li, Z. B. Chen, H. T. Zhao, L. Guo and X. Mu, Sens. Actuators, B, 2010, 149, 110–115 CrossRef CAS.
- Y. Peng, L. Li, X. Mu and L. Guo, Sens. Actuators, B, 2013, 177, 818–825 CrossRef CAS.
- L. Li, H. Zhao, Z. Chen, X. Mu and L. Guo, Anal. Bioanal. Chem., 2010, 398, 563–570 CrossRef CAS PubMed.
- Y. A. Urzhumov and G. Shvets, Solid State Commun., 2008, 146, 208–220 CrossRef CAS.
- P. K. Jain, K. S. Lee, I. H. ElSayed and M. A. ElSayed, J. Phys. Chem. B, 2006, 110, 7238–7248 CrossRef CAS PubMed.
- E. Prodan, C. Radloff, N. J. Halas and P. Nordlander, Science, 2003, 302, 419–422 CrossRef CAS PubMed.
- M. Moskovits, J. Chem. Phys., 1978, 69, 4159–4161 CrossRef CAS.
- S. Nie and S. R. Emory, Science, 1997, 275, 1102–1106 CrossRef CAS PubMed.
- K. A. Bosnick, J. Jiang and L. E. Brus, J. Phys. Chem. B, 2002, 106, 8096–8099 CrossRef CAS.
- K. Ueno, J. Mod. Opt., 2014, 61, 1231–1235 CrossRef.
Footnote |
| † Electronic supplementary information (ESI) available. See DOI: 10.1039/c6ra27185e |
| This journal is © The Royal Society of Chemistry 2017 |

