
 Open Access Article
 This Open Access Article is licensed under a Creative Commons Attribution-Non Commercial 3.0 Unported Licence
Daldinone derivatives from the mangrove-derived endophytic fungus Annulohypoxylon sp.†
Yang Liuab,
Fabian Stuhldreierc,
Tibor Kurtánd,
Attila Mándid,
Sathishkumar Arumugame,
Wenhan Lin f,
Björn Storkc,
Sebastian Wesselborgc,
Horst Weberg,
Birgit Henrichh,
Georgios Daletos*a and
Peter Proksch*a
f,
Björn Storkc,
Sebastian Wesselborgc,
Horst Weberg,
Birgit Henrichh,
Georgios Daletos*a and
Peter Proksch*a
aInstitute of Pharmaceutical Biology and Biotechnology, Heinrich Heine University, Universitaetsstrasse 1, D-40225 Duesseldorf, Germany. E-mail: georgios.daletos@uni-duesseldorf.de; proksch@uni-duesseldorf.de
bKey Laboratory of Marine Drugs, The Ministry of Education of China, School of Medicine and Pharmacy, Ocean University of China, Qingdao 266003, P. R. China
cInstitute of Molecular Medicine I, Medical Faculty, Heinrich Heine University, Universitaetsstrasse 1, D-40225 Duesseldorf, Germany
dDepartment of Organic Chemistry, University of Debrecen, P. O. B. 20, 400, 4002 Debrecen, Hungary
eCentre of Advanced Study in Marine Biology, Annamalai University, Parangipettai 608502, Tamilnadu, India
fState Key Laboratory of Natural and Biomimetic Drugs, Beijing University, Beijing 100191, P. R. China
gInstitute of Pharmaceutical and Medicinal Chemistry, Heinrich Heine University, Universitaetsstrasse 1, D-40225 Duesseldorf, Germany
hInstitute of Medical Microbiology and Hospital Hygiene, University Clinic of the Heinrich Heine University, D-40225 Duesseldorf, Germany
First published on 17th January 2017
Abstract
Two new benzo[j]fluoranthene metabolites, daldinones H, J (1 and 3), and the likewise undescribed artefact, daldinone I (2), along with six known compounds (4–9) were isolated from the endophytic fungus Annulohypoxylon sp. that was obtained from the Mangrove plant Rhizophora racemosa collected in Cameroon. The structures of the new compounds were elucidated by 1D and 2D NMR as well as by HRESIMS and ECD spectra analysis. Co-cultivation of this fungus with the actinomycetes Streptomyces lividans or with Streptomyces coelicolor resulted in an up to 38-fold increase of 1-hydroxy-8-methoxynaphthalene (9), while no significant induction was detected when the fungus was co-cultivated either with Bacillus subtilis or with Bacillus cereus. Compound 2 exhibited strong to moderate cytotoxicity against Ramos and Jurkat J16 cells with IC50 values of 6.6 and 14.1 μM, respectively. Mechanistic studies indicated that compound 2 induces apoptotic cell death caused by induction of intrinsic apoptosis. Moreover, 2 potently blocks autophagy, a potential pro-survival pathway for cancer cells. Feeding experiments with 1,8-dihydroxynaphthalene (DHN) led to an enhanced accumulation of daldinone B (6), which supported the proposed biogenetic pathway.
Introduction
Endophytes are microorganisms that colonize asymptomatically the intercellular and/or intracellular parts of healthy plants1,2 and play an important role in drug discovery.3 In recent years, the increased re-isolation of known substances from fungi has turned the interest of natural product chemists to hitherto less investigated ecological niches such as Mangrove swamps for bioprospecting of fungi.4–6 Mangroves inhabit (sub)tropical coastal regions and are exposed to various stress factors, such as intense light and high salinity followed by tidal range alterations.7,8 Endophytic fungi have developed unique metabolic mechanisms, therefore providing nutrients and/or chemical defense to their hosts.9 Mangrove-derived endophytic fungi have been shown to produce a plethora of new compounds with some of them showing pronounced biological activities as exemplified by the tetrahydroxanthone derivative phomoxanthone A that was recently isolated by our group from a Mangrove endophyte and showed strong anticancer activity against cisplatin resistant cancer cells in addition to immunostimulant activity.6,10During our ongoing search for new bioactive secondary metabolites from endophytic fungi,11–13 an endophytic fungus was isolated from the Mangrove plant Rhizophora racemosa, collected in Cameroon. 18S–28S rDNA and β-tubulin sequencing were used to identify this fungus as a member of the genus of Annulohypoxylon,14 which we therefore named as Annulohypoxylon sp. CA-2013 isolate YL. Annulohypoxylon, which has been named Hypoxylon sect. Annulata before, is considered a new genus separated from Hypoxylon based on a report of Hsieh.15 Annulohypoxylon is believed to show the same evolutionary lineage as the genera Hypoxylon and Daldinia.16 Previous chemical investigations of taxa of Annulohypoxylon sp. yielded several metabolites including cohaerins A–K,15–17 daldinone A,17 truncatone,18 and truncaquinones A and B.17,19
Subsequent fractionation of the fungal extract following fermentation on solid rice medium afforded two new benzo[j]fluoranthene-based metabolites, daldinones H and J (1 and 3, respectively), and a hitherto undescribed artefact, daldinone I (2) that originated by rapid conversion of 1 during chromatographic isolation. In addition, six known compounds were identified, including daldinone C (4), hypoxylonol C (5), daldinone B (6), 3,4-dihydro-3,4,6,8-trihydroxy-l(2H)-naphthalenone (7), (R)-scytalone (8), and 1-hydroxy-8-methoxynaphthalene (9) (Fig. 1), which had been previously isolated from members of the order Xylariales. Co-cultivation of Annulohypoxylon sp. with the actinomycete Streptomymces lividans or with Streptomyces coelicolor resulted in an up to 38-fold increase of 9. However, when co-culturing the fungus with either Bacillus subtilis or with Bacillus cereus, no significant induction in the accumulation of fungal metabolites was observed. Compound 2 showed pronounced cytotoxicity against Ramos and Jurkat J16 cell lines with IC50 values of 6.6 and 14.1 μM, respectively, due to induction of intrinsic apoptosis. Moreover, 2 potently blocks autophagy, a potential pro-survival pathway for cancer cells. Feeding of 1,8-dihydroxynaphthalene to the fungal culture resulted in a pronounced increase of daldinones H (1) and B (6), which corroborated the previously proposed biogenetic pathway.
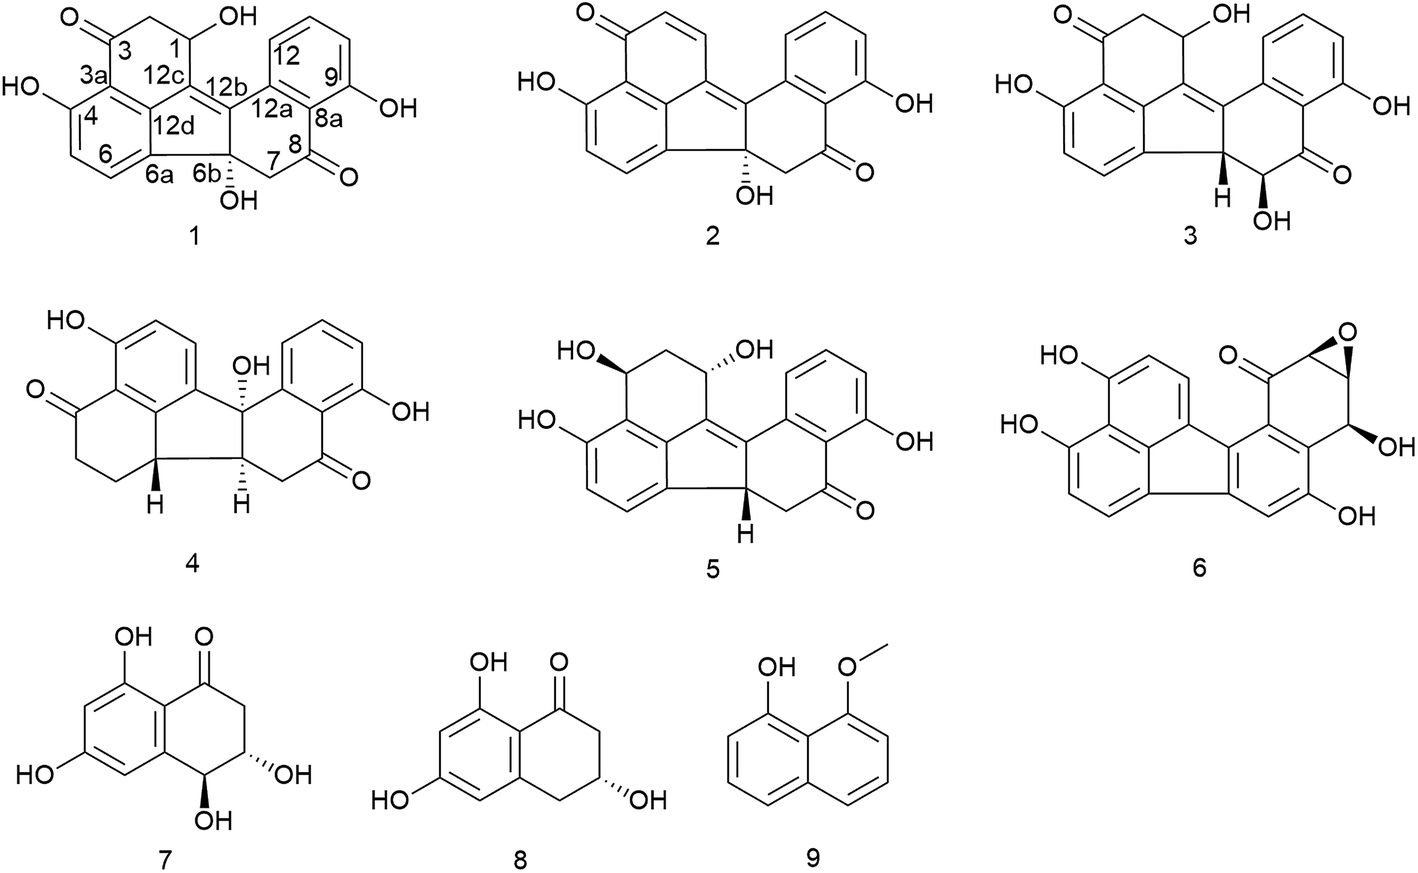 | ||
| Fig. 1 Structures of isolated compounds from Annulohypoxylon sp. | ||
Results and discussion
The EtOAc extract of the fungus following cultivation on solid rice medium was partitioned between n-hexane and 90% aqueous MeOH. The resulting MeOH phase afforded two new benzo[j]fluoranthene secondary metabolites (1 and 3), and the likewise hitherto undescribed artefact (2) that rapidly originated from 1 during chromatographic isolation.Compound 1 was isolated as a red, amorphous powder. Its molecular formula was established as C20H14O6 based on the prominent ion peak observed at m/z 351.0865 [M + H]+ in the HRESIMS spectrum, corresponding to 14 degrees of unsaturation. The 1H and COSY spectra revealed aromatic signals representative for a 1,2,3-trisubstituted benzene ring at δH 6.98 (H-10), 7.64 (H-11), and 7.51 (H-12), two ortho-coupled protons at δH 6.77 (H-5, J = 8.1 Hz) and 7.64 (H-6, J = 8.1 Hz), two sets of methylene groups at δH 3.39/2.74 (H2-7), and 3.14/2.94 (H2-2), as well as an oxymethine proton at δH 5.16 (H-1). In the HMBC spectrum of 1, the correlations from H-5 to C-3a, C-6a, and C-4, from H-6 to C-4 and C-12d, from H-2 to C-1, C-3, C-12c, and C-3a, and from H-1 to C-3, C-12c, and C-12d, suggested the presence of a vermelone20 moiety in the molecule (Fig. 2). The HMBC spectrum verified the presence of a second vermelone subunit as deduced by the correlations observed from H-10 to C-8a, C-9, and C-12, from H-11 to C-9 and C-12a, from H-12 to C-8a, C-10, C-12a, and C-12b, as well as from H-7 to C-6b, C-8, C-12b, and C-8a. The connection of the two substructures at C-6a and C-6b was established on the basis of the HMBC correlation from H-6 to C-6b (Fig. 2). These functionalities accounted for 13 of the 14 degrees of unsaturation, thus leaving only C-12b to C-12c for connection between the two units, rationalizing the remaining degree of unsaturation. Hence, 1 was identified as a new natural product and was named daldinone H.
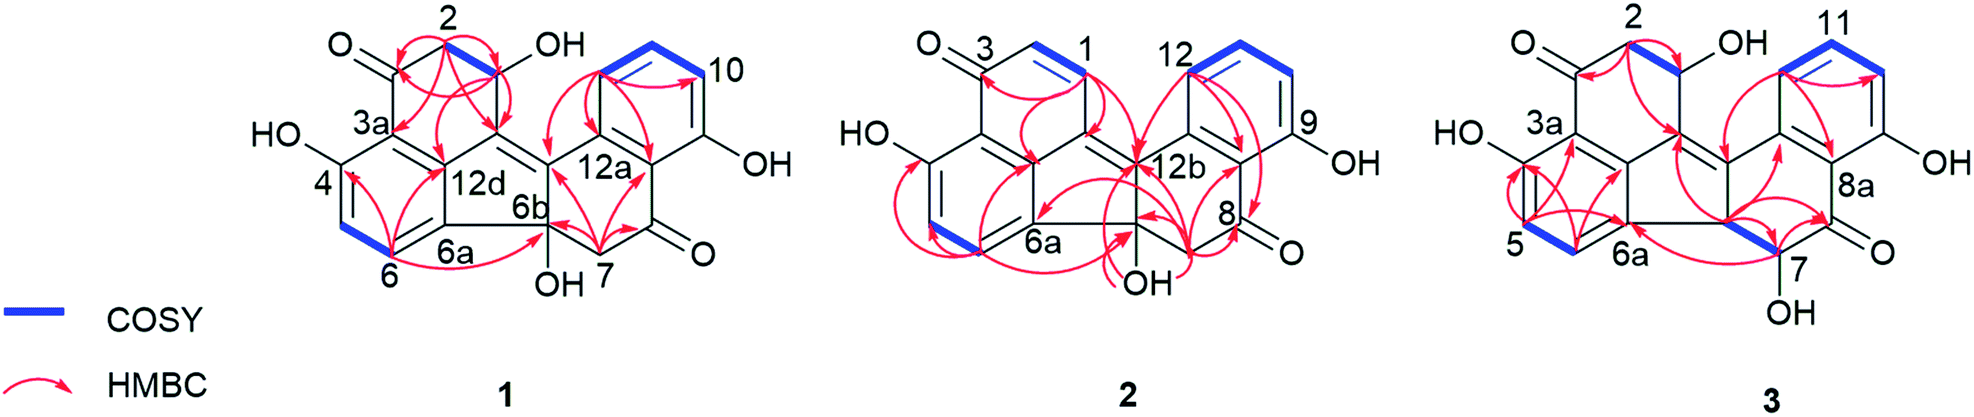 | ||
| Fig. 2 COSY and selected HMBC correlations of 1–3. | ||
The relative configuration of the two chirality centers of 1 could not be determined due to the lack of characteristic NOE correlations. For the stereochemical studies, ECD measurement and calculations were carried out, which first required the HPLC separation of 1 from its dehydration product 2, since 1 was isolated as a 1![[thin space (1/6-em)]](https://www.rsc.org/images/entities/char_2009.gif) :1 mixture with 2. Compounds 1 and 2 could be base-line separated using Chiralpack IA column and the HPLC-ECD spectrum of 1 was recorded, which was used for comparison in the ECD calculations. A pure sample of 2 was available and TDDFT-ECD calculation determined its absolute configuration as (6bR), which suggested (6bR) absolute configuration for its precursor 1 as well (vide infra).
:1 mixture with 2. Compounds 1 and 2 could be base-line separated using Chiralpack IA column and the HPLC-ECD spectrum of 1 was recorded, which was used for comparison in the ECD calculations. A pure sample of 2 was available and TDDFT-ECD calculation determined its absolute configuration as (6bR), which suggested (6bR) absolute configuration for its precursor 1 as well (vide infra).
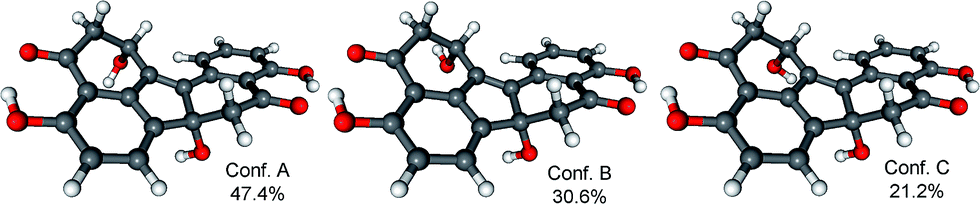
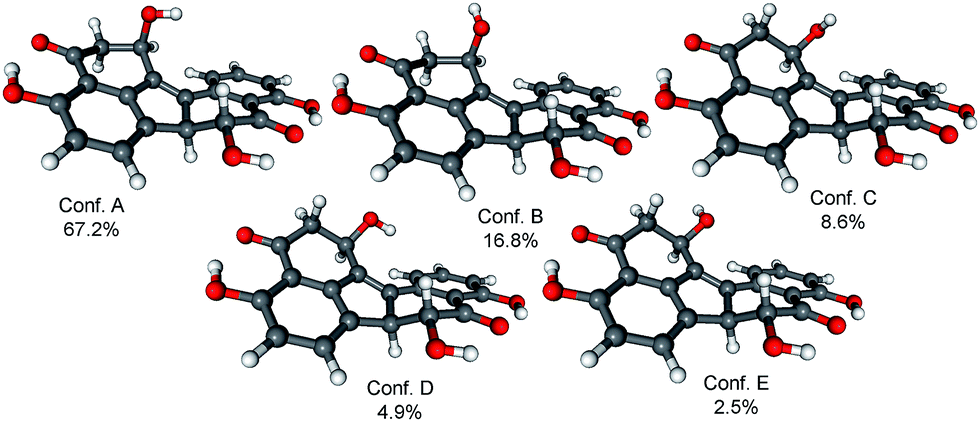
In order to determine the absolute configuration of 1, the TDDFT-ECD protocol21,22 was applied on the (1R,6bR) and (1S,6bR) diastereomers of 1. The Merk Molecular Force Field (MMFF) conformational search produced 5 low-energy conformers for both diastereomers in a 21 kJ mol−1 energy window which were reoptimized at four different DFT levels [B3LYP/6-31G(d) in vacuo, B97D/TZVP24,25 PCM/MeCN, B3LYP/TZVP PCM/MeCN and CAM-B3LYP/TZVP PCM/MeCN]. The 1H NMR spectrum of 1 showed a small value of the 3J1-H,2-H (4.9 and 1.9 Hz), which suggested the preferred equatorial orientation of 1-H in solution. The computed B3LYP/6-31G(d) in vacuo conformers of (1R,6bR)-1 had preference for the axial orientation of 1-H (see Fig. S9 and Table S1 in the ESI†), while those of (1S,6bR)-1 had larger population for the conformers with equatorial 1-H (see Fig. S11 and Table S2 in the ESI†). This result would have afforded the assignment of the relative configuration and hence the absolute configuration as (1S,6bR). However, the three solvent model DFT optimizations (B97D/TZVP PCM/MeCN (Fig. 3 and 5), B3LYP/TZVP PCM/MeCN and CAM-B3LYP/TZVP PCM/MeCN) showed that 1-H preferably adopts equatorial orientation in both the (1R,6bR) and the (1S,6bR) diastereomer and thus the correlation of the coupling constant (3J1-H,2-H) with the geometry of the computed conformers could not result in an unambiguous assignment of the relative configuration.
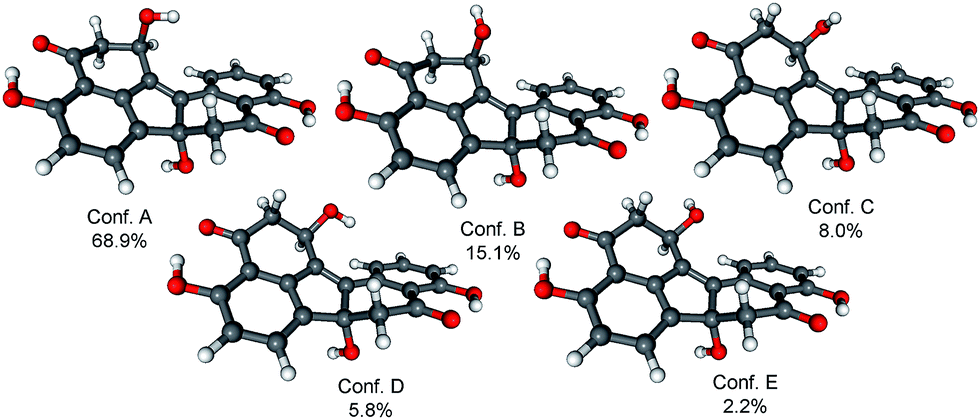 | ||
| Fig. 3 Structure and population of the low-energy B97D/TZVP PCM/MeCN conformers (>2%) of (1R,6bR)-1 diastereomer. Populations of the same conformers at B3LYP/TZVP PCM/MeCN level are 65.5%, 20.5%, 7.0%, 3.2% and 3.8% (order of last two conformers changed) while at CAM-B3LYP/TZVP PCM/MeCN level are 63.4%, 21.0%, 7.3%, 4.3% and 4.0%. | ||
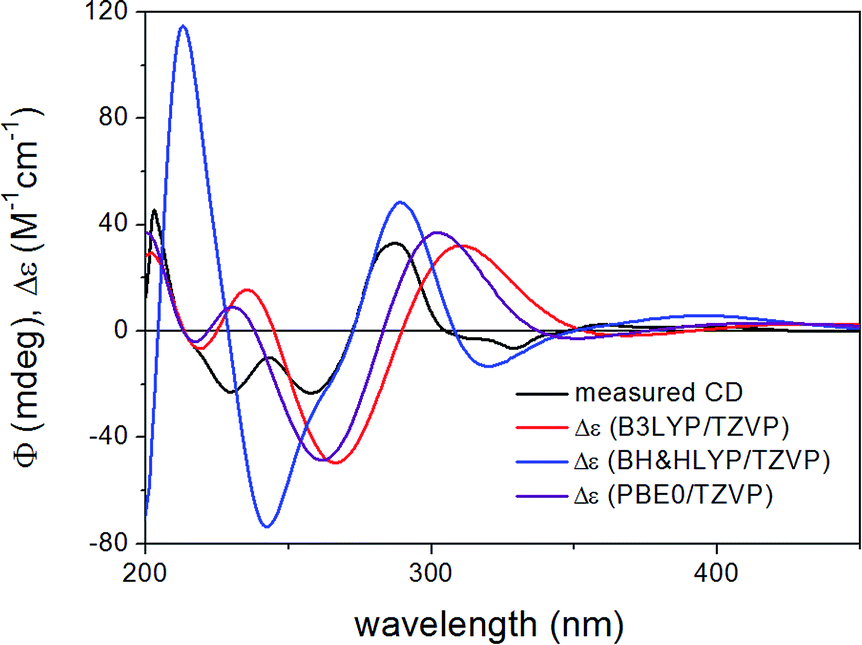
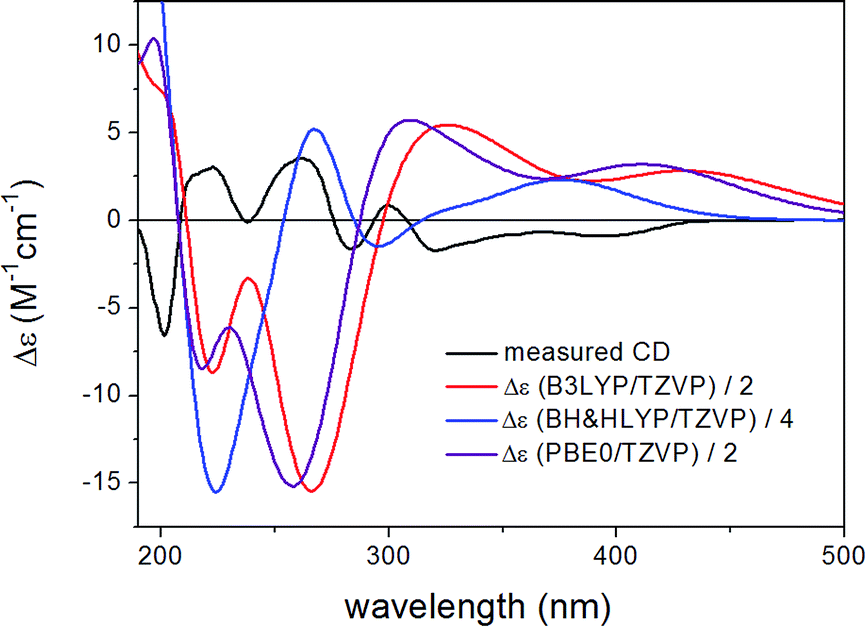
ECD spectra were computed for the low-energy (≥2%) B3LYP/6-31G(d) in vacuo (Fig. S10 and S12 of the ESI†) and B97D/TZVP PCM/MeCN conformers of (1R,6bR)-1 and (1S,6bR)-1 with various functionals (B3LYP, BH&HLYP and PBE0) and TZVP basis set, and they reproduced well the main features of the experimental spectrum but there was no sufficient difference among the computed ECD spectra of the diastereomers to distinguish them (Fig. 4 and 6). The agreement of the computed ECDs confirmed the configurational assignment of C-6b as (R).
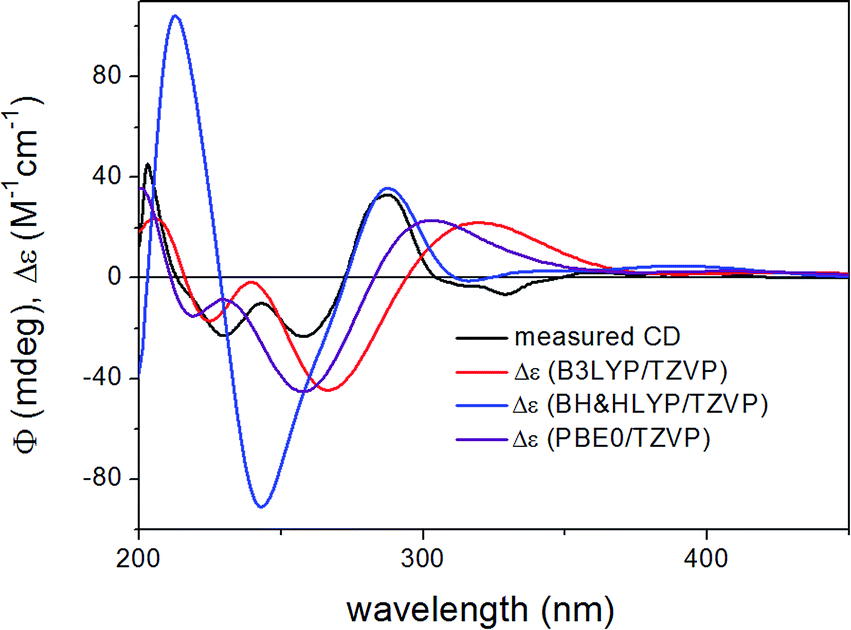 | ||
| Fig. 4 Experimental ECD spectrum of 1 compared with the Boltzmann-weighted ECD spectra computed for the B97D/TZVP PCM/MeCN low-energy conformers of (1R,6bR)-1 at various levels. | ||
 | ||
| Fig. 5 Structure and population of the low-energy B97D/TZVP PCM/MeCN conformers (>2%) of (1S,6bR)-1 diastereomer. Populations of the same conformers at B3LYP/TZVP PCM/MeCN level are 33.0%, 47.2% and 18.4% (order of first two conformers changed) while at CAM-B3LYP/TZVP PCM/MeCN level are 25.9%, 53.2% and 19.0%. | ||
ECD spectra computed for the B3LYP/6-31G(d) in vacuo and B97D/TZVP PCM/MeCN conformers performed better over 300 nm for the (1S,6bR) diastereomer, while the two negative Cotton effects (CEs) below 280 nm were reproduced better for the (1R,6bR) diastereomer. ECD spectra were also calculated for B3LYP/TZVP PCM/MeCN and CAM-B3LYP/TZVP25,26 PCM/MeCN conformers (Fig. S13–S16 of the ESI†), but these results were found similar to that of the B97D/TZVP PCM/MeCN method and the absolute configuration of C-1 could not be determined unambiguously (Fig. 4 and 6). Moreover, attempts to assign the configuration of C-1 by employing the modified Mosher's method failed to give the corresponding MPA esters, probably due to steric hindrance and/or instability of 1 under reaction conditions.
 | ||
| Fig. 6 Experimental ECD spectrum of 1 compared with the Boltzmann-weighted ECD spectra computed for the B97D/TZVP PCM/MeCN low-energy conformers of (1S,6bR)-1 at various levels. | ||
Compound 2 was isolated as a red, amorphous powder. Its molecular formula was established as C20H12O5 based on the prominent ion peak observed at m/z 333.0756 [M + H]+ in the HRESIMS spectrum. The 1H and 13C NMR data of 1 were similar to those of 2, except for the deshielded signals resonating at δH 6.75 (δC 133.3, CH-2) and 8.23 (δC 134.7, CH-1), indicating that 2 is the dehydration product of 1 bearing an additional C1/2 double bond. In the HMBC spectrum of 2, the correlations from H-1 to C-12b, C-12c, C-12d, and C-3, as well as from H-2 to C-12c and C-3a corroborated this assumption (Fig. 2). Notably, 1 was observed to rapidly transform into 2 during the isolation procedure. Since 2 was not detected in the crude fungal extract, it is suggested to be an artefact arising from 1 during the isolation procedure. For compound 2 the name daldinone I is suggested.
The initial MMFF conformational search of the arbitrarily selected (R)-2 resulted in a single conformer in a 21 kJ mol−1 energy window (Fig. 7), which was reoptimized at B3LYP/6-31G(d) in vacuo level followed by ECD calculations at different levels (Fig. 8). The calculated ECD spectra gave excellent agreement with the experimental one indicating (R) absolute configuration. Due to the nice agreement and limited conformational freedom, there was no need to use solvent model calculations in this case.
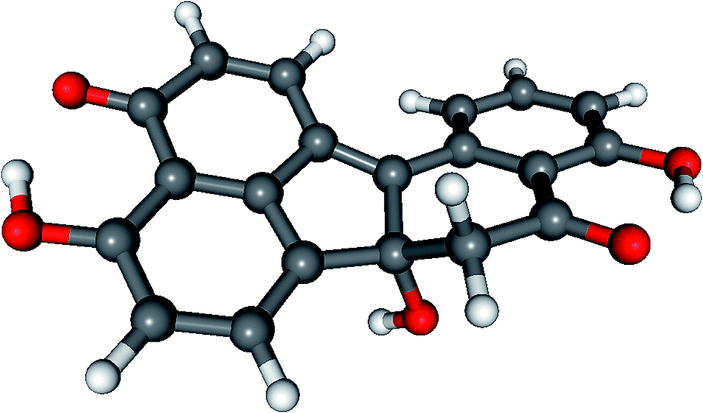 | ||
| Fig. 7 Structure of the computed conformer of (R)-2 at B3LYP/6-31G(d) in vacuo level. | ||
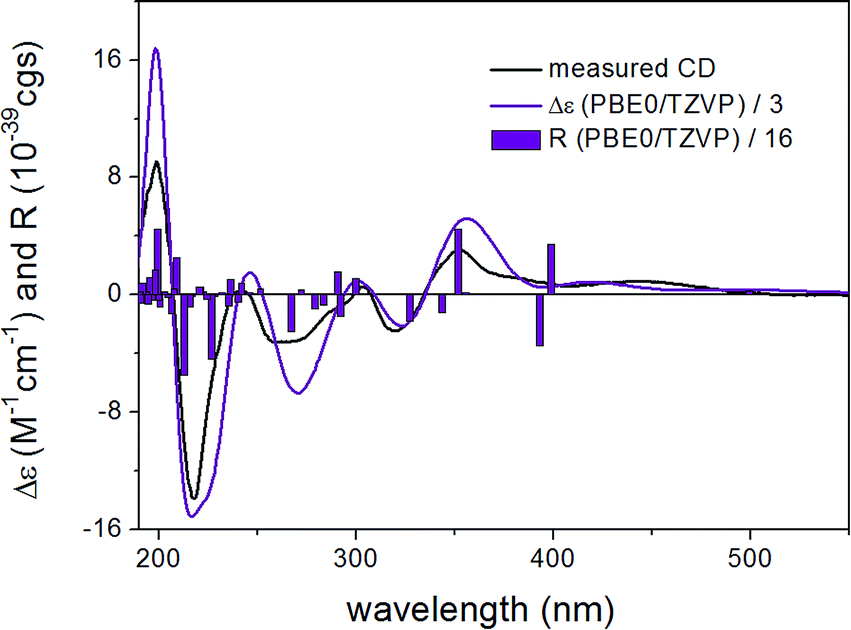 | ||
| Fig. 8 Experimental ECD spectrum of 2 in MeCN compared with the PBE0/TZVP PCM/MeCN ECD spectrum of the single conformer of (R)-2 computed for the B3LYP/6-31G(d) optimized conformer. Bars represent the rotational strength of conformer A. | ||
Compound 3 was isolated as a red, amorphous powder and displayed a very similar UV spectrum as 1. Moreover, the HRESIMS exhibited a prominent ion peak at m/z 351.0862 [M + H]+, indicating that both compounds shared the same molecular formula (C20H14O6). Comparison of the 1H and 13C NMR data of 3 to those of 1 revealed close similarity between both compounds, apart from the absence of the methylene group at δH 3.39/2.74 (δC 50.4, CH2-7 in 1) and the presence of two vicinal methine signals at δH 4.13 (δC 58.7, CH-6b) and 3.99 (δC 77.7, CH-7) in 3 instead, as supported by the COSY spectrum. The above spectroscopic differences suggested that 3 is a positional isomer of 1 with the hydroxy group (6b-OH in 1) located at C-7. This assumption was further corroborated by the HMBC correlations from H-6b to C-12a, C-12c, C-7, and C-8, as well as from H-7 to C-8 and C-6a. In addition, the large coupling constant between H-6b and H-7 (3J6b,7 = 12.1 Hz) suggested their trans-diaxial relationship. Hence, 3 was identified as a new natural product and was named daldinone J.
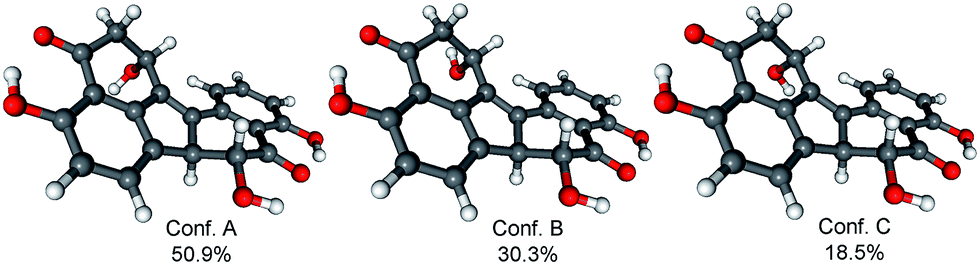
Similarly to 1, the relative configuration of C-1 could not be determined in the lack of characteristic NOE correlations, but a triplet signal for 1-H with 3.7 Hz coupling constant, suggested that 1-H preferably adopts equatorial orientation. The initial MMFF conformational searches were performed for the diastereomeric (1R,6bS,7R)- and (1S,6bS,7R)-3 yielding 5 conformers for each in a 21 kJ mol−1 energy window. Similarly to the conformational analysis of 1, the reoptimization of the MMFF conformers was carried at four levels of theory [B3LYP/6-31G(d) in vacuo, B97D/TZVP PCM/MeCN, B3LYP/TZVP PCM/MeCN and CAM-B3LYP/TZVP PCM/MeCN] (Fig. 9 and 11). The B3LYP/6-31G(d) in vacuo conformers of (1R,6bS,7R)-3 showed that 1-H adopts preferably axial orientation, while those of (1S,6bS,7R)-3 had a larger population for conformers with equatorial 1-H (Fig. S32 and S34 of the ESI†). This difference diminished in the solvent model calculations, in which the conformers with equatorial 1-H were identified as the major ones for both diastereomers.
 | ||
| Fig. 9 Structure and population of the low-energy B97D/TZVP PCM/MeCN conformers (>2%) of (1R,6bS,7R)-3 diastereomer. Populations of the same conformers at B3LYP/TZVP PCM/MeCN level are 63.2%, 22.5%, 7.7%, 2.4% and 4.1% (order of last two conformers changed) while at CAM-B3LYP/TZVP PCM/MeCN level are 61.8%, 22.6%, 8.0%, 3.2% and 4.3%. | ||
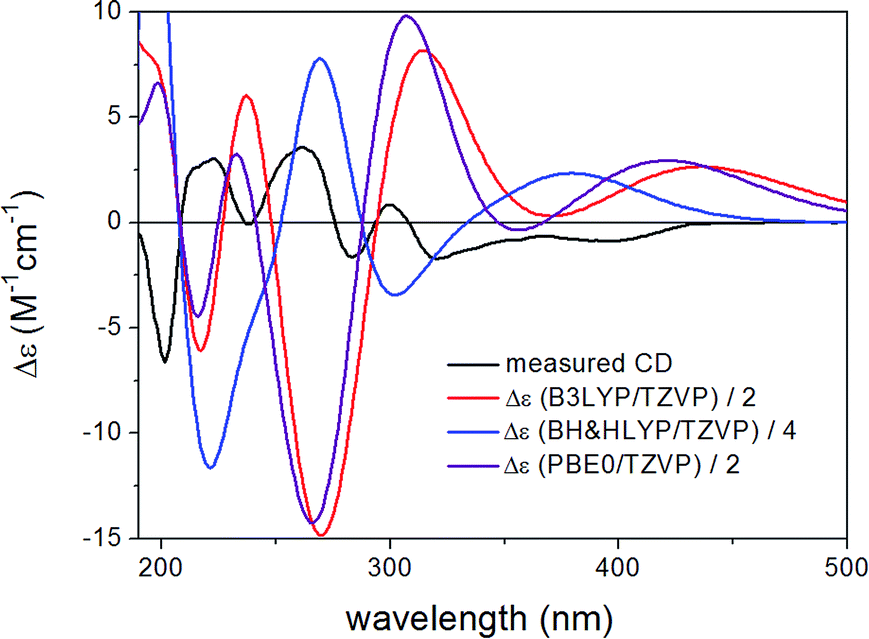
ECD spectra computed for B3LYP/6-31G(d) in vacuo (Fig. S33 and S35 of the ESI†) and B97D/TZVP PCM/MeCN reoptimized conformers (Fig. 10 and 12) at various levels were nearly mirror-image to the experimental one for both diastreomers indicating (6bR,7S) absolute configuration. The C-1 chirality center has minor contribution to the ECD data and thus C-1 diastereomers could not be distinguished by ECD calculations. The large negative specific rotation value of 3 prompted us to run OR calculations for the diastereomers. Similarly to the ECD calculations, the OR calculations of the diastereomers confirmed the (6bR,7S) absolute configuration but they were not suitable to determine the absolute configuration of C-1. Although both 1 and 3 had (6bR) absolute configuration, the geometry of their annulations is different as reflected by the opposite signs of the corresponding CEs. The (6bR) absolute configuration of 3 compares well with the reported absolute configuration of hypoxylonol C (5),27 which may also suggest (1S) absolute configuration for 3.
 | ||
| Fig. 10 Experimental ECD spectrum of 3 compared with the Boltzmann-weighted ECD spectra computed for the B97D/TZVP PCM/MeCN low-energy conformers of (1R,6bS,7R)-3 at various levels. | ||
 | ||
| Fig. 11 Structure and population of the low-energy B97D/TZVP PCM/MeCN conformers (>2%) of (1S,6bS,7R)-3 diastereomer. Populations of the same conformers at B3LYP/TZVP PCM/MeCN level are 37.0%, 45.7% and 16.6% (order of first two conformers changed) while at CAM-B3LYP/TZVP PCM/MeCN level are 30.3%, 51.3% and 17.6%. | ||
 | ||
| Fig. 12 Experimental ECD spectrum of 3 compared with the Boltzmann-weighted ECD spectra computed for the B97D/TZVP PCM/MeCN low-energy conformers of (1S,6bS,7R)-3 at various levels. | ||
The known compounds were identified as daldinone C (4),28 hypoxylonol C (5),27 daldinone B (6),29 3,4-dihydro-3,4,6,8-trihydroxy-l(2H)-naphthalenone (7),30,31 (R)-scytalone (8),31,32 and 1-hydroxy-8-methoxynaphthalene (9)33 based on their NMR and MS spectroscopic data and by comparison with the literature.
Co-cultivation of fungi and bacteria has repeatedly been shown to activate silent fungal biogenetic gene clusters, thus either triggering the expression of compounds which are not detected in axenic fungal cultures or enhancing the accumulation of constitutively present metabolites.34 Several attempts were undertaken in this study to influence the pattern of fungal metabolites through co-cultivation of the fungus with bacteria, such as Bacillus subtilis 168 trpC2, Bacillus cereus T, Streptomyces lividans TK24 or Streptomyces coelicolor A2(3).35,36 Co-cultivation of the fungus with either S. lividans or S. coelicolor resulted in an up to 38-fold increase in the accumulation of the known compound 1-hydroxy-8-methoxynaphthalene (9) as shown by HPLC analysis. On the other hand, when the fungus was co-cultured with B. subtilis or with B. cereus, no effect on natural product accumulation was observed, hinting at a specificity of the fungal response towards different bacteria (Fig. S40 of the ESI†).
Previously,28,37,38 the biogenetic pathway of benzo[j]fluoranthene derivatives (compounds 1, 3–6) was suggested to start with oxidative coupling of 1,8-dihydroxynaphthalene (DHN) and/or 1,3,8-trihydroxynaphthalene (3HN). For an experimental support of the proposed biosynthetic route of the analyzed fungal constituents commercially available 1,8-dihydroxynaphthalene (DHN) was fed to fungal cultures growing on solid rice medium at concentrations of 80 mg, of 120 mg or of 160 mg per flask. Analysis of the resulting crude fungal extracts by HPLC revealed a pronounced increase of the accumulation of compounds 1 and 6 in a dose-dependent manner (Fig. 13). The strongest increase of both compounds was observed in the presence of 120 mg DHN per flask. This induction of 6, which is the main compound produced by the fungus, is in accordance with the proposed biosynthetic pathway, starting from oxidative coupling of two DHN units (Fig. S41 of the ESI†). Interestingly, the production of 1, which is assumed to be biosynthesized from two 3HN units was likewise enhanced, suggesting a biochemical equilibrium between DHN and 3HN under catalysis of 3HN-reductases present in the metabolism of the fungus.20,39
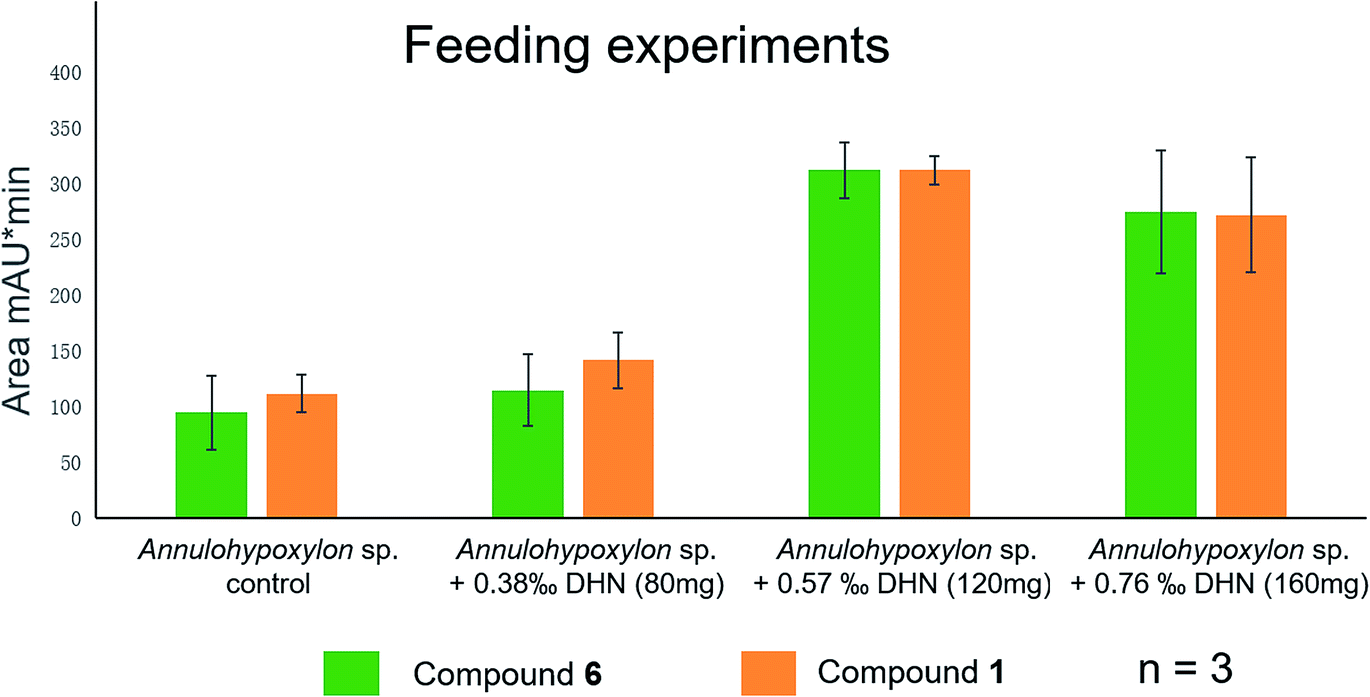 | ||
| Fig. 13 Feeding experiments of Annulohypoxylon sp. with 1,8-dihydroxynaphthalene (DHN) in three different concentrations 80 mg, 120 mg, and 160 mg. The yield per flask of 1 and 6 is indicated by the corresponding area of UV absorption. Data are means of three independent experiments (n = 3). | ||
The isolated compounds (2–5, 7–9) – apart from 1 and 6, due to their chemical instability - were investigated for their antibacterial activity toward Staphylococcus aureus ATCC 25923, Acinetobacter baumannii ATCC BAA747, and Mycobacterium tuberculosis, however, none of them showed detectable activity when assayed at an initial dose of 10 μM. At a same dose, initial screenings for cytotoxicity of the respective compounds in different cancer cell lines revealed that only compound 2 inhibited the growth of the human leukemia and lymphoma cell lines, Jurkat J16 and Ramos, respectively, in a dose-dependent manner. After 24 h of treatment, the determined IC50 values of compound 2 against Jurkat J16 and Ramos cells were 14.1 and 6.6 μM, respectively (Fig. S42 of the ESI†). Apparently, Burkitt's lymphoma (Ramos) cells are particularly sensitive toward this compound.
To evaluate the potential contribution of proapoptotic mechanisms of compound 2 with regard to the observed cytotoxicity, we analyzed activation of caspase-3 through two different methods – on the one hand by immunoblotting of the caspase-3 substrate PARP and on the other hand by measuring the fluorescence of the profluorescent caspase-3 substrate Ac-DEVD-AMC. Apoptosis is a programmed form of cell death, which is generally characterized by distinct activation of cysteine-dependent aspartate-directed proteases (caspases), leading to DNA fragmentation and finally to cell death.40 First, we detected cleavage of PARP after treatment with compound 2 for 8 h via immunoblotting. In both Jurkat J16 and Ramos cells the treatment with 10 μM of 2 for 8 h lead to an explicit cleavage of PARP, indicating activation of caspases and therefore induction of apoptosis (Fig. 14). To ensure caspase dependency of the observed cleavage of PARP, the cells were co-incubated with the pan-caspase inhibitor N-(2-quinolyl)-L-valyl-L-aspartyl-(2,6-difluorophenoxy) methylketone (QVD). This co-incubation entirely abrogates compound 2-induced cleavage of PARP. In the next step, activation of caspase-3 was detected fluoroscopically, to confirm compound 2-related induction of apoptosis. Treatment with 2 at concentrations up to 10 μM leads to cleavage of the profluorescent caspase-3 substrate Ac-DEVD-AMC within a few hours (Fig. 15), indicating once again activation of caspases and induction of apoptosis by compound 2. In Ramos cells, the kinetic of 2-induced activation of caspase-3 appears to be as fast as the kinetic of activation by the extremely potent apoptosis inducer staurosporine.
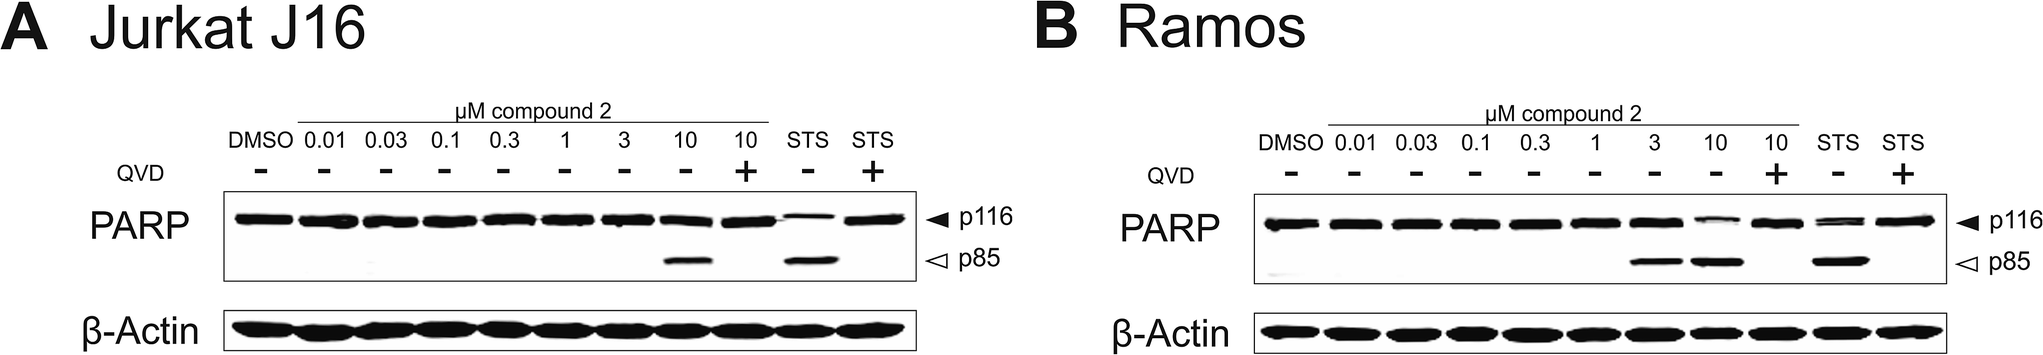 | ||
| Fig. 14 Compound 2 induces apoptosis. (A) Jurkat J16 cells (acute T cell leukemia cells) and (B) Ramos cells (Burkitt's lymphoma B lymphocytes) were treated with the indicated concentrations of compound 2 in the absence or presence of the caspase inhibitor Q-VD-OPh (10 μM) for 8 h. Cells treated with staurosporine (STS, 2.5 μM) were used as positive control for caspase-dependent cleavage of Poly (ADP-ribose) polymerase-1 (PARP). After incubation period cleavage of PARP was determined by Western blot analysis. Solid arrowheads indicate the uncleaved form of PARP, open arrowheads indicate the cleaved form. The expression of β-actin was determined as protein loading control. Shown is the result of a representative blot. | ||
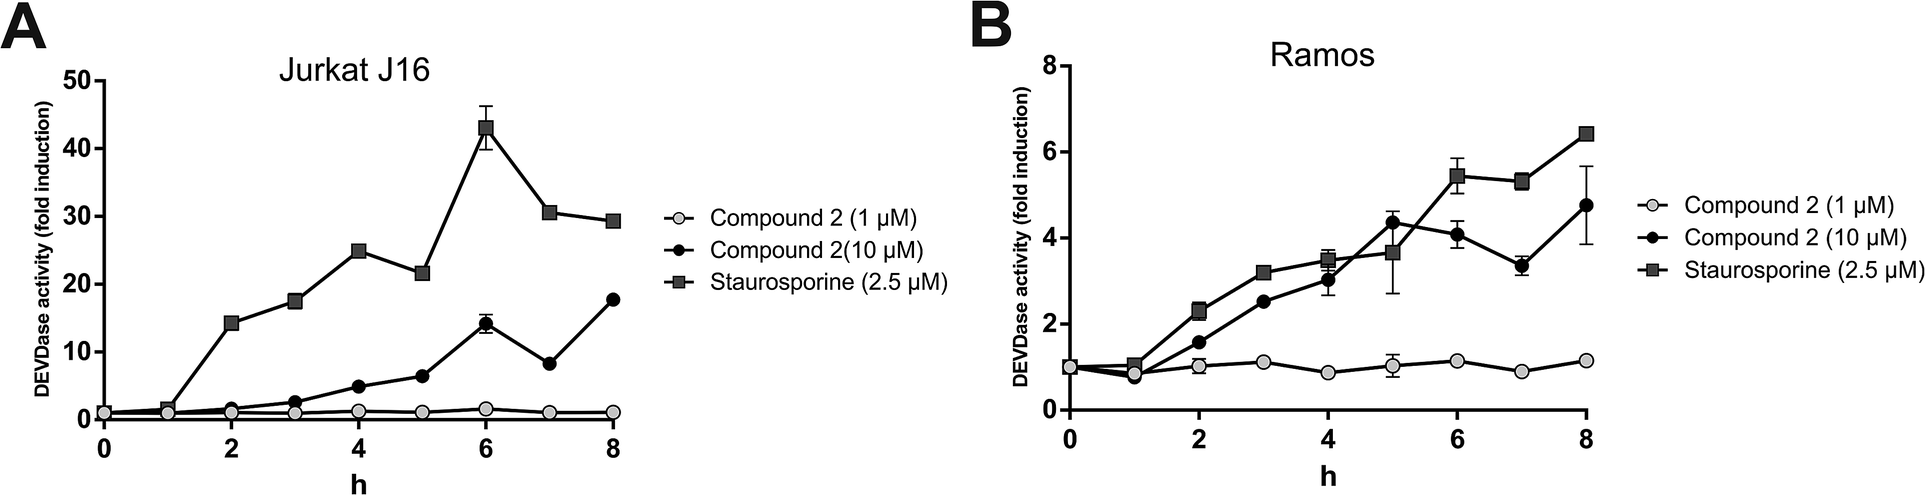 | ||
| Fig. 15 Compound 2 activates caspase-3 with rapid kinetics. The kinetics of caspase-3 activation in (A) Jurkat J16 cells (acute T cell leukemia cells) and (B) Ramos cells (Burkitt's lymphoma B lymphocytes) after treatment with indicated concentrations of 2 were compared to those of staurosporine (STS, 2.5 μM), a well-established inducer of apoptosis. Caspase-3 activity was measured by the rate of cleavage of the profluorescent caspase-3 substrate Ac-DEVD-AMC. Relative caspase-3 activity in DMSO (0.1% v/v) treated control cells was set to 1. Data shown are the mean ± SD from a representative experiment performed in triplicate. | ||
In order to characterize the proapoptotic effect of 2 more precisely, we performed flow cytometry based analyses with caspase-9 deficient and caspase-9 reconstituted Jurkat cells. The signaling network of induction and execution of apoptosis is highly complex and consists of many regulatory pathways, but the extrinsic (death receptor) pathway and the intrinsic (mitochondrial) pathway are canonically considered as the two core pathways to induce apoptosis. While caspase-8 is the key player of the extrinsic pathway, caspase-9 is the corresponding key player of the intrinsic pathway.40 Therefore, experiments with cells lacking these key players can shed light on the pathway triggered by 2 in more detail. To determine caspase-related degradation of DNA by 2, we measured the amount of hypodiploid nuclei after treatment with 2 for 24 h. Comparative experiments in Jurkat cells lacking caspase-9 and in Jurkat cells, reconstituted with caspase-9 revealed that caspase-9 is indispensable for execution of 2-induced apoptosis (Fig. 16). Thus, 2 apparently induces intrinsic, but not extrinsic apoptosis.
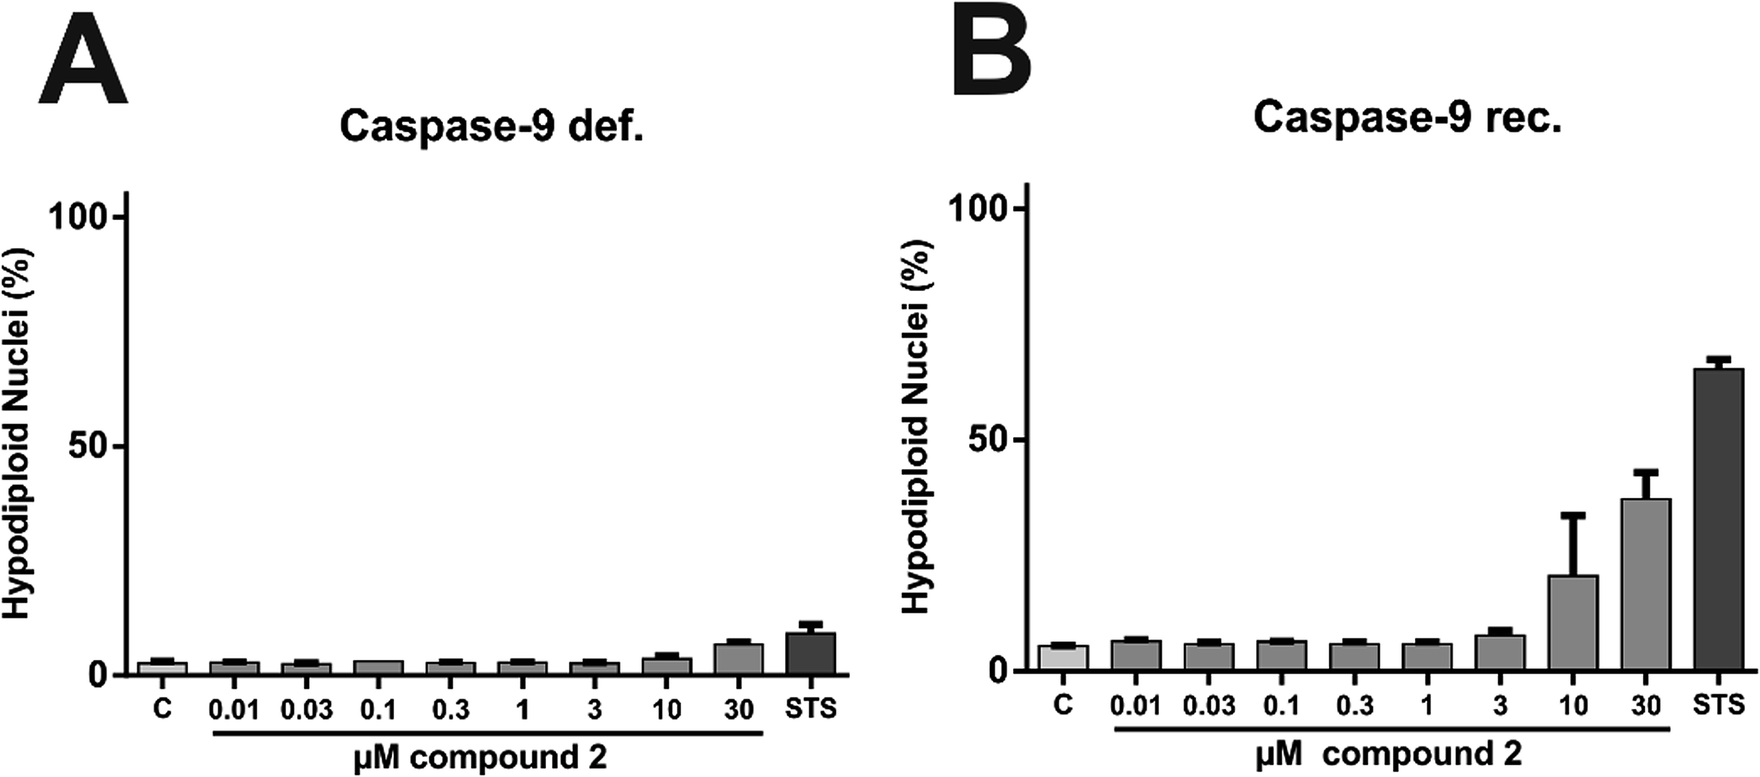 | ||
| Fig. 16 Compound 2-induced apoptosis is caspase-9 dependent. Induction of apoptosis by 2 in (A) caspase-9 deficient and in (B) caspase-9 reconstituted Jurkat JMR cells (acute T cell leukemia cells) was assessed by flow cytometry to detect apoptotic DNA fragmentation, resulting in hypodiploid nuclei. After incubation period of 24 h cells were processed and measured as described in methods. Cells treated with staurosporine (STS, 2.5 μM), a well-established inducer of apoptosis, served as positive control. Data shown are the mean ± SD from a representative experiment performed in triplicate. | ||
Autophagy is a major intracellular catabolic mechanism responsible for the degradation of cytosolic components through lysosomes and plays an important role in cellular homeostasis.41 The ability to recycle unnecessary or dysfunctional components makes the process of autophagy essential for survival under conditions of starvation. Due to its crucial role regarding pro-survival signaling of fast proliferating cancer cells, suffering from starvation stress, autophagy is considered as a promising target in anticancer therapy.42,43 In order to determine potential effects of 2 regarding regulation of autophagy, we used MEF cells stably expressing mCitrine-hLC3B and analyzed lysosomal degradation of mCitrine-hLC3B upon starvation and treatment with either 2 or with the known autophagy inhibitor bafilomycin A1 via flow cytometry. LC3 is a major component of the double membraned structure called autophagosome, which delivers cytoplasmic components to the lysosomes and gets degraded by the lysosomal degradation system in the course of autophagy. Thereby, degradation of LC3 can be used as an indicator of autophagy. Incubation with 2 almost entirely blocked starvation-induced degradation of LC3, strongly indicating inhibition of autophagy by 2 (Fig. 17). Of note, this effect was not caused by the induction of apoptosis (e.g. via the caspase-dependent degradation of autophagy-relevant signaling molecules), since co-treatment with the above mentioned caspase inhibitor QVD did not abolish autophagy inhibition mediated by 2. Along these lines, the apoptosis inducer staurosporine (STS) did not inhibit but rather induced autophagy, further indicating that the induction of apoptosis does not necessarily lead to the inhibition of autophagy (Fig. 17). Taken together, 2 potently inhibits starvation-induced autophagy independently of caspases.
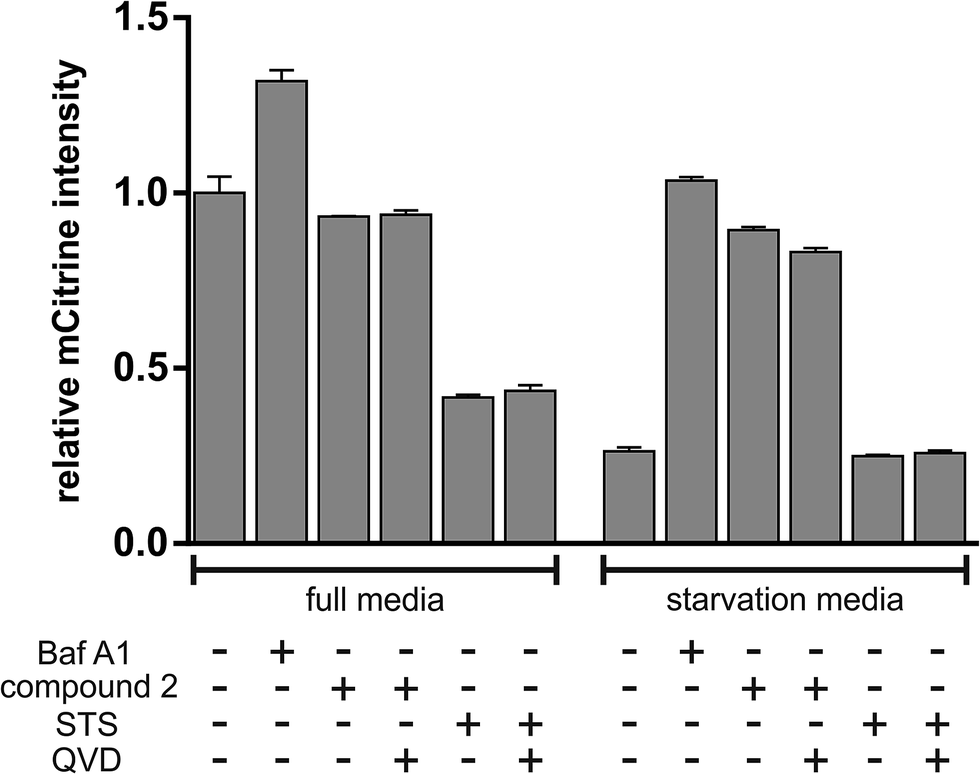 | ||
| Fig. 17 Compound 2 blocks amino acid starvation-induced autophagy in a caspase-independent manner. MEFs stably expressing mCitrine-hLC3B were cultivated in full medium or starvation medium (EBSS) with 10 μM compound 2 or 2.5 μM staurosporine (STS) for 6 h. 10 nM bafilomycin A1 (Baf A1) served as positive control for inhibition of autophagy and co-treatment with 10 μM QVD as control for caspase independency. Total cellular mCitrine-hLC3B signals were analyzed by flow cytometry. The median of fluorescence intensity was plotted in a bar diagram. Values are normalized to DMSO (0.1% v/v) treated cells cultivated in full medium (1.0) and represent mean ± SD. | ||
Compound 2 appears to be an interesting candidate for further in vivo studies illuminating its usability in anticancer therapy. These subsequent studies could also shed more light on the mechanisms of compound 2-related effects on apoptosis and autophagy.
Experimental section
General experimental procedures
Melting points were measured using a Büchi Melting Point B-540. Optical rotations were determined with a Perkin-Elmer-241 MC polarimeter. 1H, 13C, and 2D NMR spectra were recorded at 25 °C in DMSO-d6 and CH3OH-d4 on Bruker AVANCE DMX 600 NMR spectrometers. Chemical shifts were referenced to the solvent residual peaks, δH 2.50 (DMSO-d6) and 3.31 (CH3OH-d4) ppm for 1H, and δC 39.51 (DMSO-d6) and 49.15 (CH3OH-d4) ppm for 13C. Mass spectra (ESI) were recorded with a Finnigan LCQ Deca mass spectrometer, and HRMS (ESI) spectra were obtained with a FTHRMS-Orbitrap (Thermo-Finnigan) mass spectrometer. Solvents were distilled prior to use and spectral grade solvents were used for spectroscopic measurements. HPLC analysis was performed with a Dionex UltiMate3400 SD with a LPG-3400SD Pump coupled to a photodiode array detector (DAD3000RS); routine detection was at 235, 254, 280, and 340 nm. The separation column (125 × 4 mm) was prefilled with Eurosphere-10 C18 (Knauer, Germany), and the following gradient was used (MeOH, 0.1% HCOOH in H2O): 0 min (10% MeOH); 5 min (10% MeOH); 35 min (100% MeOH); 45 min (100% MeOH). Semipreparative HPLC was performed using a Merck Hitachi HPLC System (UV detector L-7400; Pump L-7100; Eurosphere-100 C18, 300 × 8 mm, Knauer, Germany). Column chromatography included LH-20 Sephadex and Merck MN Silica gel 60 M (0.04–0.063 mm). TLC plates with silica gel F254 (Merck, Darmstadt, Germany) were used to monitor fractions; detection was under UV at 254 and 366 nm or by spraying the plates with anisaldehyde reagent followed by heating. Bacterial growth was monitored by measuring the OD600 in a Tecan microtiter plate reader (InfiniteM200, Tecan). ECD spectra were recorded on a J-810 spectropolarimeter. HPLC separations of 1 and 2 were performed with a Jasco HPLC system using Chiralpak IA column with 250 mm × 4.6 mm i.d., 5 μm (Daicel, Chemical Industries, Ltd.) and n-hexane/propan-2-ol eluent at a flow rate of 1.0 mL min−1. HPLC-UV chromatograms were recorded with a Jasco MD-910 multiwavelength detector. The on-line ECD and UV spectra of 1 were measured simultaneously by stopping the flow at the UV absorption maximum of each peak. The values of the ECD ellipticity (ϕ) were not corrected for the concentration.Microbial material
The endophytic fungus was isolated from fresh fruits of the Mangrove plant Rhizophora racemosa collected in Cameroon in September 2013. The isolation was performed as described before,44 and the fungus was identified by using a molecular biological protocol by DNA amplification and sequencing of the 3952 bp of the 18S–28S rDNA region (accession-number KY190099) and 1422 bp of the β tubulin gene (accession number KY190100)14 followed by BlastN search in the NCBI-databases. Phylogenetic trees that cover the highest number of homologous sequences in the database were generated. The 18S–28S rDNA sequence from nt 28 – nt 3357 exhibited 64.5% homology to a sequence of respective length of Xylariaceae sp. YX28 (e.g. accession number DQ022415), suggesting that the fungus belongs to the class of Xylariales (Fig. S1A of the ESI†). BlastN analysis of part of the rDNA sequence region from nt 2415 – nt 3906 in the unite database45 showed a 97.75% homology to Annulohypoxylon sp. (acc-no. JQ747656). Moreover, 1416 bp of the fungal β-tubulin gene revealed 96% homology to Annulohypoxylon sp. (acc-no. KP134522) (see Fig. S1B†) supporting the assumption that the fungus analyzed in this study belongs to the genus of Annulohydroxylon. Thus, the fungus was named as Annulohydroxylon sp. CA-2013 isolate YL. A voucher strain was kept at one of the authors' laboratory (P.P.). The bacterial strains used for co-cultivation were standard laboratory strains: Bacillus subtilis 168 trpC2, Bacillus cereus T, Streptomyces lividans TK24, and Streptomyces coelicolor A2(3).Fungal fermentation
The fungus was cultivated on solid rice medium in twelve Erlenmeyer flasks. Solid rice medium was prepared by adding demineralized water (110 mL) to rice (100 g) in an Erlenmeyer flask, followed by autoclaving (121 °C, 20 min). The fungus, which nearly covered the whole surface of a petri dish, was inoculated onto this sterile rice medium under the clean bench and was allowed to grow (20 °C) for 25 days.Co-cultivation experiments of Annulohypoxylon sp. with B. subtilis 168 trpC2 and B. cereus T
The fungal and bacterial strains were cultivated on solid rice media involving 15 Erlenmeyer flasks (3 flasks for the fungus control, 3 flasks for B. subtilis control, 3 flasks for B. cereus control, 3 flasks for co-cultivation of the fungus with B. subtilis, 3 flasks for co-cultivation of the fungus with B. cereus). Each flask (1 L) containing 110 mL of distilled water and 100 g of commercially available milk rice (Milch-Reis, ORYZA) was autoclaved before inoculating the fungus and the bacteria.B. subtilis and B. cereus were grown in lysogeny broth (LB) medium. Overnight cultures of B. subtilis and B. cereus were used to inoculate prewarmed LB medium (1:20), which was then incubated at 37 °C with shaking at 200 rpm to mid exponential growth phase (optical density at 600 nm (OD600) of 0.2–0.4). An amount of 10 mL B. subtilis (6 flasks) or B. cereus (6 flasks) respectively was inoculated to rice medium and the inoculated flasks were kept in an incubator (37 °C) for 4 days. After this preincubation, 5 pieces (1 × 1 cm2) of the fungus growing on malt agar were added to each flask containing B. subtilis or B. cereus.
Co-cultivation and axenic cultures of the fungus and bacterial control were kept at room temperature (20 °C) until they reached their stationary phase of growth (3 weeks for controls of the fungus and 4 weeks for co-cultivation). Then 500 mL of EtOAc was added to the cultures to stop the growth of cells followed by shaking of the flasks at 150 rpm for 8 h. The cultures were then left overnight and filtered on the following day using a Büchner funnel. EtOAc was removed by a rotary evaporation. Each extract was then dissolved in 50 mL of MeOH, and 10 μL of this was injected into the analytical HPLC.
Co-cultivation experiments of Annulohypoxylon sp. with S. coelicolor A2(3) and S. lividans TK24
Fifteen Erlenmeyer flasks (3 flasks for the fungus control, 3 for co-cultivation of the fungus and S. coelicolor, 3 for co-cultivation of the fungus and S. lividans, 3 for S. coelicolor control, 3 for S. lividans control) containing 110 mL of Yeast Malt (YM) medium and 100 g of commercially available milk rice (Milch-Reis, ORYZA) were autoclaved before inoculating the fungus and bacteria. An overnight culture of S. coelicolor or of S. lividans was used to inoculate prewarmed YM medium (1:20), which was then incubated at 30 °C with shaking at 200 rpm to mid exponential growth phase. This preculture was then incubated in fresh YM medium overnight to reach mid exponential growth phase. A volume of 10 mL S. coelicolor (6 flasks) and S. lividans (6 flasks) respectively was inoculated to rice medium and incubated (30 °C) for 4 days. Then the same process was carried out as described for the experiment of co-cultivation of the fungus with B. subtilis or with B. cereus.
Feeding experiments with 1,8-dihydroxynaphthalene
Twelve Erlenmeyer flasks containing 90 mL demineralized water and 100 g of commercially available milk rice (Milch-Reis, ORYZA) were autoclaved. Afterwards, different amounts (80 mg, 120 mg, 160 mg) of 1,8-dihydroxynaphthalene (DHN) were dissolved in 20 mL autoclaved water each and added to the autoclaved rice medium by sterile filtration (n = 3). Controls were only treated with autoclaved water. Next, the fungus was inoculated onto the medium. Flasks treated with DHN or controls lacking DHN were allowed to grow in an incubator (30 °C) for two weeks.Cell lines and reagents
Adult lymphoblastic leukemia T cells (Jurkat J16, no. ACC-282) and Burkitt's lymphoma B cells (Ramos, no. ACC-603) were obtained from the German Collection of Microorganisms and Cell Cultures (DSMZ, Germany). Wild-type murine embryonic fibroblasts (MEFs, kindly provided by Xiaodong Wang)46 expressing mCitrine-hLC3B were generated by retroviral gene transfer using pMSCVpuro/mCitrine-hLC3B. To generate pMSCVpuro/mCitrine-hLC3B, full-length human MAP1LC3B cDNA was cloned into pMSCVpuro/mCitrine vector (kindly provided by Michael Engelke, University of Göttingen, Germany). Caspase-9-deficient Jurkat JMR cells stably transfected with vector control or caspase-9 were previously described.47 All cell lines were grown at 37 °C under humidified air supplemented with 5% CO2 in RPMI 1640 (Jurkat J16, Jurkat JMR, Jurkat JMR reconstituted with caspase-9, Ramos) or DMEM (mCitrine-hLC3B-MEF) containing 10% fetal calf serum, 1% HEPES, 120 IU mL−1 penicillin, and 120 μg mL−1 streptomycin. The broad-range caspase inhibitor N-(2-quinolyl)-L-valyl-L-aspartyl-(2,6-difluorophenoxy) methylketone [(QVD), #SML0063], the autophagy inhibitor bafilomycin A1 [(Baf A1), #B1793] and the kinase inhibitor staurosporine [(STS), #S5921], used as positive control for induction of apoptosis, were obtained from Sigma-Aldrich. The profluorescent caspase-3 substrate Ac-DEVD-AMC was purchased from Biomol (# ABD-13402).Determination of cell viability
Jurkat J16 cells and Ramos cells were seeded at a density of 5 × 10⁵ cells per mL and incubated with different concentrations of compound 2 for 24 h. Cells treated with DMSO (0.1% v/v) for 24 h were used as negative control. After incubation for 24 h MTT (3-(4,5-dimethyl-2-thiazolyl)-2,5-diphenyl-2H-tetrazolium bromide; Calbiochem #475989) was added to the cells to a final concentration of 1 mg mL−1, the cells were incubated further for 60 min and then centrifuged at 600 rcf for 5 min. The medium was aspirated and 100 μL DMSO were added to each well to extract the formazan product from the cells. After 25 min of incubation on a shaker at room temperature, the absorbance at 650 nm (reference wavelength) and 570 nm (test wavelength) was measured using a multiplate reader (Synergy Mx, BioTek). Viability and IC50 values (IC50 = half maximal inhibitory concentration) were calculated using Prism 6 (GraphPad Software). Relative viability of DMSO (0.1% v/v) treated control cells was set to 100%.Western blot analysis
Ramos and Jurkat J16 cells were treated with the indicated concentrations of compound 2. Coincubation with the caspase inhibitor Q-VD-OPh at a concentration of 10 μM was used as proof of caspase-dependency of the observed effects. After incubation time of 24 h, cells were pelletized at 600 rcf at 4 °C for 5 min, washed with PBS and frozen in liquid nitrogen. The cells were lysed in ice-cold lysis buffer [20 mM Tris-HCl, pH 7.5, 150 mM NaCl, 0.5 mM EDTA, 1% Triton X-100, 10 mM NaF, 2.5 mM Na4P2O7, 10 μM Na2MoO4, 1 mM Na3VO4, protease inhibitors (Sigma #P2714)]. The lysates were cleared from cell debris by centrifugation at 11000 rcf at 4 °C for 15 min and the total protein concentration was measured by Bradford assay and adjusted to equal concentrations. After loading with Laemmli buffer and heating to 95 °C for 5 min, 25 μg of the protein extract was separated by SDS-PAGE [8% tris-glycine polyacrylamide gel (v/v)] and transferred to a PVDF membrane by Western blotting according to a standard protocol. Analysis of proteins of interest was performed using primary mouse antibodies to poly(ADP-ribose) polymerase-1 (Enzo Life Sciences #BML-SA250) or β-actin (Sigma-Aldrich #A5316) and IRDye800-conjugated secondary antibodies (LI-COR Biosciences #926-32210/11). Signals were detected with an infrared imaging system.
Caspase-3 activity assay
Jurkat J16 cells and Ramos cells were seeded at a density of 1 × 10⁶ cells per mL in 96-well microtiter plates and incubated with different concentrations of compound 2 for the indicated times. Cells treated with DMSO (0.1% v/v) were used as negative control. After incubation period, cells were harvested by centrifugation at 600 rcf at 4 °C and lysed by incubation with ice-cold lysis buffer (20 mM HEPES, 84 mM KCl, 10 mM MgCl2, 200 μM EDTA, 200 μM EGTA, 0.5% NP-40, 1 μg mL−1 leupeptin, 1 μg mL−1 pepstatin, 5 μg mL−1 aprotinin) for 10 minutes. After addition of 150 μL reaction buffer (50 mM HEPES, 100 mM NaCl, 10% Sucrose, 0.1% CHAPS, 2 mM CaCl2, 13.35 mM DTT, 70 μM DEVD-AMC) per well, fluorescence (Ex 360 nm, Em 450 nm) was measured at 37 °C over a time course of 150 min using a multiplate reader (Synergy Mx, BioTek). Caspase activity was determined as the slope of the resulting linear regressions. Data points shown are the mean of triplicates, error bars = SD. Values are normalized to DMSO (0.1% v/v) treated cells (fold change = 1.00).FACS-based analysis of apoptotic cell death
Caspase-9-deficient Jurkat cells stably transfected with vector control or caspase-9 cDNA were treated with the indicated concentrations of compound 2 for 24 h. Cells treated with DMSO (0.1% v/v) served as negative control and cells treated with the kinase inhibitor staurosporine (2.5 mM) as positive control. After incubation period nuclei were prepared by lysing cells in hypotonic lysis buffer (1% sodium citrate, 0.1% Triton X-100, 50 μg mL−1 propidium iodide) at 4 °C overnight. Subsequently, DNA content was analyzed by flow cytometry. Nuclei with a DNA content below that of nuclei of healthy G0/G1 cells were considered as apoptotic.48 Data points shown are the mean of triplicates, error bars = SD.FACS-based analysis of autophagy
MEF cells stably expressing mCitrine-hLC3B were cultured in the indicated medium for 6 h with or without the indicated compounds, harvested with 0.05% trypsin–EDTA, and washed once with phosphate-buffered saline. Subsequently, the intensity of mCitrine fluorescence was analyzed by flow cytometry using FACSDiva software. Reduction of mCitrine-hLC3B compared to medium control indicates autophagy induction.Extraction and isolation
The crude extract of fungal cultures was subjected to liquid–liquid separation between n-hexane and 90% aqueous MeOH. The resulting MeOH fraction (8.2 g) was separated by vacuum liquid chromatography on silica gel, using solvents in a gradient of increasing polarity – n-hexane-ethyl acetate-dichloromethane-methanol – to generate 6 fractions. Each fraction was submitted to Sephadex LH-20 and eluted with DCM-MeOH (1:1) to remove black pigments. Final purification was carried out by semipreparative HPLC to yield 1 (1:1 mixture with 2, 4.2 mg), 2 (14.7 mg), 3 (1.1 mg), 4 (3.2 mg), 5 (4.6 mg), 6 (4.4 mg), 7 (11.2 mg), 8 (20.6 mg), 9 (5.5 mg).
Daldinone H (1)
Red powder; UV [MeOH, photodiode array (PDA)]: λmax = 200, 242, 292, 397 nm; (6bR)-1: tR = 7.07 min on a Chiralpak IA column (hexane/2-propanol 80:20); HPLC-ECD {hexane/2-propanol 80:20, λ [nm] (ϕ)}. 1H (600 MHz) and 13C (150 MHz) NMR, see Table 1; ESI-MS m/z 351.2 [M + H]+, 349.1 [M − H]−; HRESIMS m/z 351.0865 [M + H]+ (calcd for C20H15O6, 351.0863).
| Position | 1a | 2b | 3a | |||
|---|---|---|---|---|---|---|
| δC, typec | δH (J in Hz) | δC, type | δH (J in Hz) | δC, typec | δH (J in Hz) | |
| a Measured in CH3OH-d4 at 600 (1H) and 150 (13C) MHz.b Measured in DMSO-d6 at 600 (1H) and 150 (13C) MHz.c Data extracted from HMBC and HSQC spectra. | ||||||
| 1 | 63.5, CH | 5.16, dd (4.9, 1.9) | 134.7, CH | 8.23, d (9.8) | 63.6, CH | 5.77, t (3.7) |
| 2 | 47.8, CH2 | 3.14, dd (17.2, 4.9); 2.94, dd (17.2, 1.9) | 133.3, CH | 6.75, d (9.8) | 47.2, CH2 | 3.20, dd (17.1, 3.7); 2.96, dd (17.1, 3.7) |
| 3 | 201.7, C | 188.3, C | 200.9, C | |||
| 3a | 114.1, C | 113.4, C | 112.0, C | |||
| 4 | 160.6, C | 159.0, C | 158.5, C | |||
| 5 | 115.2, CH | 6.77, d (8.1) | 114.5, CH | 6.93, d (8.1) | 114.8, CH | 6.78, d (8.3) |
| 6 | 131.0, CH | 7.64, d (8.1) | 128.7, CH | 7.75, d (8.1) | 133.8, CH | 7.82, d (8.3) |
| 6a | 138.2, C | 136.5, C | 134.4, C | |||
| 6b | 84.7, C | 84.4, C | 58.7, CH | 4.13, d (12.1) | ||
| 7 | 50.4, CH2 | 3.39, d (16.3); 2.74, d (16.3) | 49.3, CH2 | 3.45, d (16.3); 2.97, d (16.3) | 77.7, CH | 3.99, d (12.1) |
| 8 | 205.2, C | 204.4, C | 204.7, C | |||
| 8a | 115.6, C | 114.9, C | 113.8, C | |||
| 9 | 163.3, C | 162.1, C | 162.6, C | |||
| 10 | 119.1, CH | 6.98, d (8.0) | 120.2, CH | 7.15, dd (7.5, 0.5) | 118.4, CH | 6.95, dd (7.0, 1.0) |
| 11 | 137.7, CH | 7.64, t (8.0) | 137.6, CH | 7.76, t (7.5) | 138.3, CH | 7.61, t (7.0) |
| 12 | 120.3, CH | 7.51, d (8.0) | 120.7, CH | 7.64, dd (7.5, 0.5) | 119.0, CH | 7.53, dd (7.0, 1.0) |
| 12a | 137.9, C | 134.6, C | 137.2, C | |||
| 12b | 144.5, C | 152.2, C | 139.0, C | |||
| 12c | 134.0, C | 127.0, C | 136.8, C | |||
| 12d | 147.0, C | 144.5, C | 148.1, C | |||
| 4-OH | 10.65, s | |||||
| 6b-OH | 6.23, s | |||||
| 9-OH | 12.34, s | |||||
Daldinone I (2)
Red powder; mp 206–207 °C (dec.); [α]20D = −154 (c 0.35, MeOH); UV [MeOH, photodiode array (PDA)]: λmax = 201, 235, 335, 462 nm; ECD {acetonitrile, λ [nm] (Δε)}; 1H (600 MHz) and 13C (150 MHz) NMR, see Table 1; ESI-MS m/z 333.1 [M + H]+,331.0 [M − H]−; HRESIMS m/z 333.0756 [M + H]+ (calcd for C20H12O5, 333.0757).Daldinone J (3)
Red powder; mp 229 °C (dec.); [α]20D = −180 (c 0.25, MeOH); UV [MeOH, photodiode array (PDA)]: λmax = 201, 242, 292, 398 nm; ECD {acetonitrile, λ [nm] (Δε)}; 1H (600 MHz) and 13C (150 MHz) NMR, see Table 1; ESI-MS m/z 351.3 [M + H]+, 349.1 [M − H]−; HRESIMS m/z 351.0862 [M + H]+ (calcd for C20H15O6, 351.0863).Computational section
Mixed torsional/low-frequency mode conformational searches were carried out by means of the Macromodel 9.9.223 software using the Merck Molecular Force Field (MMFF) with an implicit solvent model for CHCl3.49 Geometry reoptimizations were carried out at the B3LYP/6-31G(d) level in vacuo, B3LYP/TZVP, B97D/TZVP23,24 and CAM-B3LYP/TZVP25,26 levels with the PCM solvent model for MeCN or MeOH. TDDFT ECD and OR calculations were run with various functionals (B3LYP, BH&HLYP, CAM-B3LYP, PBE0) and the TZVP basis set as implemented in the Gaussian 09 package with the same or no solvent model as in the preceding DFT optimization step.50 ECD spectra were generated as sums of Gaussians with 2100–3000 cm−1 widths at half-height (corresponding to ca. 15–22 nm at 270 nm), using dipole-velocity-computed rotational strength values.51 Boltzmann distributions were estimated from the ZPVE-corrected B3LYP/6-31G(d) energies in the gas-phase calculations and from the B3LYP/TZVP, B97D/TZVP and CAM-B3LYP/TZVP energies in the solvated ones. The MOLEKEL software package was used for visualization of the results.52Acknowledgements
Financial support by the DFG through the GRK 2158 to P. P., B. S. and S. W. is gratefully acknowledged. W. H. L. wants to thank the Ministry of Science and Technology (MOST) to W. H. L. for support. T. K. thanks the Hungarian National Research Foundation (OTKA K105871) for financial support and the National Information Infrastructure Development Institute (NIIFI 10038) for CPU time. The authors are indebted to Prof. R. Kalscheuer (Heinrich-Heine-University, Duesseldorf) for performing antibacterial assays.References
- S. H. Faeth, Oikos, 2002, 98, 25–36 CrossRef.
- D. Wilson, Oikos, 1995, 73, 274–276 CrossRef.
- A. H. Aly, A. Debbab and P. Proksch, Appl. Microbiol. Biotechnol., 2011, 90, 1829–1845 CrossRef CAS PubMed.
- Z. E. Wilson and M. A. Brimble, Nat. Prod. Rep., 2009, 26, 44–71 RSC.
- D. G. I. Kingston, J. Nat. Prod., 2011, 74, 496–511 CrossRef CAS PubMed.
- D. Rönsberg, A. Debbab, A. Mándi, V. Vasylyeva, P. Böhler, B. Stork, L. Engelke, A. Hamacher, R. Sawadogo, M. Diederich, V. Wray, W. Lin, M. U. Kassack, C. Janiak, S. Scheu, S. Wesselborg, T. Kurtán, A. H. Aly and P. Proksch, J. Org. Chem., 2013, 78, 12409–12425 CrossRef PubMed.
- H. Thatoi, B. C. Behera and R. R. Mishra, Mycology, 2013, 4, 54–71 CAS.
- F. Zhu, X. Chen, Y. Yuan, M. Huang, H. Sun and W. Xiang, Open Nat. Prod. J., 2009, 2, 24–32 CrossRef CAS.
- K. Saikkonen, S. Saari and M. Helander, Fungal Divers., 2010, 41, 101–113 CrossRef.
- M. Frank, H. Niemann, P. Böhler, B. Stork, S. Wesselborg, W. Lin and P. Proksch, Curr. Med. Chem., 2015, 22, 3523–3532 CrossRef CAS PubMed.
- Y. Liu, V. Wray, M. S. Abdel-Aziz, C. Y. Wang, D. Lai and P. Proksch, J. Nat. Prod., 2014, 77, 1734–1738 CrossRef CAS PubMed.
- Y. Liu, A. Marmann, M. S. Abdel-Aziz, C. Y. Wang, W. E. G. Müller, W. H. Lin, A. Mándi, T. Kurtán, G. Daletos and P. Proksch, Eur. J. Org. Chem., 2015, 12, 2646–2653 CrossRef.
- Y. Liu, T. Kurtán, C. Y. Wang, W. H. Lin, R. Orfali, W. E. G. Müller, G. Daletos and P. Proksch, J. Antibiot., 2016, 69, 702–706 CrossRef CAS PubMed.
- G. F. Bills, V. Gonzalez-Menendez, J. Martin, G. Platas, J. Fournier, D. Persoh and M. Stadler, PLoS One, 2012, 7, e46687 CAS.
- H. M. Hsieh, Y. M. Ju and J. D. Rogers, Mycologia, 2005, 97, 844–865 CrossRef CAS PubMed.
- D. N. Quang, M. Stadler, J. Fournier, A. Tomita and T. Hashimoto, Tetrahedron, 2006, 62, 6349–6354 CrossRef CAS.
- F. Surup, K. I. Mohr, R. Jansen and M. Stadler, Phytochemistry, 2013, 95, 252–258 CrossRef CAS PubMed.
- D. N. Quang, T. Hashimoto, Y. Nomura, H. Wollweber, V. Hellwig, J. Fournier, M. Stadler and Y. Asakawa, Phytochemistry, 2005, 66, 797–809 CrossRef CAS PubMed.
- F. Surup, V. Wiebach, E. Kuhnert and M. Stadler, Tetrahedron Lett., 2016, 57, 2183–2185 CrossRef CAS.
- J. E. Thompson, S. Fahnestock, L. Farrall, D. Liao, B. Valent and D. B. Jordan, J. Biol. Chem., 2000, 275, 34867–34872 CrossRef CAS PubMed.
- Z. Tian, P. Sun, Y. Yan, Z. Wu, Q. Zheng, S. Zhou, H. Zhang, F. Yu, X. Jia, D. Chen, A. Mándi, T. Kurtán and W. Liu, Nat. Chem. Biol., 2015, 11, 259–265 CAS.
- A. Mándi, I. W. Mudianta, T. Kurtán and M. J. Garson, J. Nat. Prod., 2015, 78, 2051–2056 CrossRef PubMed.
- S. Grimme, J. Comput. Chem., 2006, 27, 1787–1799 CrossRef CAS PubMed.
- P. Sun, D. X. Xu, A. Mándi, T. Kurtán, T. J. Li, B. Schulz and W. Zhang, J. Org. Chem., 2013, 78, 7030–7047 CrossRef CAS PubMed.
- T. Yanai, D. Tew and N. Handy, Chem. Phys. Lett., 2004, 393, 51–57 CrossRef CAS.
- G. Pescitelli, L. D. Bari and N. Berova, Chem. Soc. Rev., 2011, 40, 4603–4625 RSC.
- M. Fukai, M. Tsukada, K. Miki, T. Suzuki, T. Sugita, K. Kinoshita, K. Takahashi, M. Shiro and K. Koyama, J. Nat. Prod., 2012, 75, 22–25 CrossRef CAS PubMed.
- W. Gu, H. M. Ge, Y. C. Song, H. Ding, H. L. Zhu, X. A. Zhao and R. X. Tan, J. Nat. Prod., 2007, 70, 114–117 CrossRef CAS PubMed.
- L. Du, J. B. King and R. H. Cichewicz, J. Nat. Prod., 2014, 77, 2454–2458 CrossRef CAS PubMed.
- S. Iwasaki, H. Muro, K. Sasaki, S. Woe and S. Okuda, Tetrahedron Lett., 1973, 37, 3537–3542 CrossRef.
- P. Pittayakhajonwut, P. Sohsomboon, A. Dramae, R. Suvannakad, S. Lapanun and M. Tantichareon, Planta Med., 2008, 74, 281–286 CrossRef CAS PubMed.
- S. M. Husain, M. A. Schätzle, S. Lüdeke and M. Müller, Angew. Chem., Int. Ed., 2014, 53, 9806–9811 CrossRef CAS PubMed.
- A. K. Nadeau and J. L. Sorensen, Tetrahedron Lett., 2011, 52, 1697–1699 CrossRef CAS.
- A. Marmann, A. H. Aly, W. Lin, B. Wang and P. Proksch, Mar. Drugs, 2014, 12, 1043–1065 CrossRef PubMed.
- H. Chen, G. Daletos, M. S. Abdel-Aziz, D. Thomy, H. Dai, H. Broetz-Oesterhelt, W. Lin and P. Proksch, Phytochem. Lett., 2015, 12, 35–41 CrossRef CAS.
- A. R. B. Ola, D. Thomy, D. Lai, H. Broetz-Oesterhelt and P. Proksch, J. Nat. Prod., 2013, 76, 2094–2099 CrossRef CAS PubMed.
- E. C. Barnes, J. Jumpathong, S. Lumyong, K. Voigt and C. Hertweck, Chem.–Eur. J., 2016, 22, 4551–4555 CrossRef CAS PubMed.
- Y. L. Zhang, J. Zhang, N. Jiang, Y. H. Lu, L. Wang, S. H. Xu, W. Wang, G. F. Zhang, Q. Xu, H. M. Ge, J. Ma, Y. C. Song and R. X. Tan, J. Am. Chem. Soc., 2011, 133, 5931–5940 CrossRef CAS PubMed.
- W. Fang, S. Ji, N. Jiang, W. Wang, G. Y. Zhao, S. Zhang, H. M. Ge, Q. Xu, A. H. Zhang, Y. L. Zhang, Y. C. Song, J. Zhang and R. X. Tan, Nat. Commun., 2012, 3, 1039–1048 CrossRef PubMed.
- R. C. Taylor, S. P. Cullen and S. J. Martin, Nat. Rev. Mol. Cell Biol., 2008, 9, 231–241 CrossRef CAS PubMed.
- N. Mizushima, Genes Dev., 2007, 21, 2861–2873 CrossRef CAS PubMed.
- K. Degenhardt, R. Mathew, B. Beaudoin, K. Bray, D. Anderson, G. Chen, C. Mukherjee, Y. Shi, C. Gélinas, Y. Fan, D. A. Nelson, S. Jin and E. White, Cancer Cell, 2006, 10, 51–64 CrossRef CAS PubMed.
- J. Y. Guo, H. Y. Chen, R. Mathew, J. Fan, A. M. Strohecker, G. Karsli-Uzunbas, J. J. Kamphorst, G. Chen, J. M. Lemons, V. Karantza, H. A. Coller, R. S. Dipaola, C. Gelinas, J. D. Rabinowitz and E. White, Genes Dev., 2011, 25, 460–470 CrossRef CAS PubMed.
- F. B. C. Okoyea, C. S. Nworuc, A. Debbaba, C. O. Esimone and P. Proksch, Phytochem. Lett., 2015, 14, 51–55 CrossRef.
- U. Kõljalg, R. H. Nilsson, K. Abarenkov, L. Tedersoo, A. F. S. Taylor, M. Bahram, S. T. Bates, T. D. Bruns, J. Bengtsson-Palme, T. M. Callaghan, B. Douglas, T. Drenkhan, U. Eberhardt, M. Dueñas, T. Grebenc, G. W. Griffith, M. Hartmann, P. M. Kirk, P. Kohout, E. Larsson, B. D. Lindahl, R. Lücking, M. P. Martín, P. B. Matheny, N. H. Nguyen, T. Niskanen, J. Oja, K. G. Peay, U. Peintner, M. Peterson, K. Põldmaa, L. Saag, I. Saar, A. Schüßler, J. A. Scott, C. Senés, M. E. Smith, A. Suija, D. L. Taylor, M. T. Telleria, M. Weiß and K. H. Larsson, Mol. Ecol., 2013, 22, 5271–5277 CrossRef PubMed.
- L. Shang, S. Chen, F. Du, S. Li, L. Zhao and X. Wang, Proc. Natl. Acad. Sci. U. S. A., 2011, 108, 4788–4793 CrossRef CAS PubMed.
- J. Manns, M. Daubrawa, S. Driessen, F. Paasch, N. Hoffmann, A. Löffler, K. Lauber, A. Dieterle, S. Alers, T. Iftner, K. Schulze-Osthoff, B. Stork and S. Wesselborg, FASEB J., 2011, 25, 3250–3261 CrossRef CAS PubMed.
- I. Nicoletti, G. Migliorati, M. C. Pagliacci, F. Grignani and C. J. Riccardi, Immunol. Methods, 1991, 139, 271–279 CrossRef CAS PubMed.
- MacroModel, Schrödinger, LLC, 2012, http://www.schrodinger.com/MacroModel Search PubMed.
- M. J. Frisch, G. W. Trucks, H. B. Schlegel, G. E. Scuseria, M. A. Robb, J. R. Cheeseman, G. Scalmani, V. Barone, B. Mennucci, G. A. Petersson, H. Nakatsuji, M. Caricato, X. Li, H. P. Hratchian, A. F. Izmaylov, J. Bloino, G. Zheng, J. L. Sonnenberg, M. Hada, M. Ehara, K. Toyota, R. Fukuda, J. Hasegawa, M. Ishida, T. Nakajima, Y. Honda, O. Kitao, H. Nakai, T. Vreven, J. A. J. Montgomery, J. E. Peralta, F. Ogliaro, M. Bearpark, J. J. Heyd, E. Brothers, K. N. Kudin, V. N. Staroverov, R. Kobayashi, J. Normand, K. Raghavachari, A. Rendell, J. C. Burant, S. S. Iyengar, J. Tomasi, M. Cossi, N. Rega, J. M. Millam, M. Klene, J. E. Knox, J. B. Cross, V. Bakken, C. Adamo, J. Jaramillo, R. Gomperts, R. E. Stratmann, O. Yazyev, A. J. Austin, R. Cammi, C. Pomelli, J. W. Ochterski, R. L. Martin, K. Morokuma, V. G. Zakrzewski, G. A. Voth, P. Salvador, J. J. Dannenberg, S. Dapprich, A. D. Daniels, O. Farkas, J. B. Foresman, J. V. Ortiz, J. Cioslowski and D. J. Fox, Gaussian 09, revision B.01, Gaussian, Inc., Wallingford, CT, 2010 Search PubMed.
- P. J. Stephens and N. Harada, Chirality, 2010, 22, 229–233 CAS.
- U. Varetto, MOLEKEL, v. 5.4, Swiss National Supercomputing Centre, Manno, Switzerland, 2009 Search PubMed.
Footnote |
| † Electronic supplementary information (ESI) available: HRESIMS spectra, 1D and 2D NMR spectra of new compounds 1–3, CD calculations for compounds 1 and 3, spectra of co-cultivation experiments, proposed biogenetic pathway cytotoxic effect of compound 2 on Jurkat J16 cells and Ramos cells, and HPLC chromatograms of compounds 1–3 are available. See DOI: 10.1039/c6ra27306h |
| This journal is © The Royal Society of Chemistry 2017 |