 Open Access Article
Creative Commons Attribution 3.0 Unported Licence
Luminescence properties and energy transfer in Tb3+ and Eu3+ co-doped Ba2P2O7 phosphors
Baoxing Wang *,
Qiang Ren,
Ou Hai and
Xiulan Wu
School of Materials Science and Engineering, Shaanxi University of Science and Technology, Xi'an 710021, China. E-mail: m18309293611@163.com
First published on 7th March 2017
Abstract
The Ba2P2O7:Tb3+, Eu3+ phosphors were synthesized by a high temperature solid-state reaction method in air atmosphere and their crystal structures, lifetime, luminescence properties, and energy transfer mechanism were investigated in detail. A series of characteristic emissions of Ba2P2O7:Tb3+, Eu3+ phosphors were observed in the emission spectra at around 545 nm, 593 nm, and 613 nm when excited at 378 nm. The energy-transfer mechanism from Tb3+ to Eu3+ in Ba2P2O7 is determined by a dipole–dipole interaction. The emission intensity of Ba2−xP2O7:xEu3+ was enhanced by doping charge compensation Li+, Na+ and K+. The CIE coordinates of the phosphors can be tuned from blue-green through white, to yellow and finally to orange-red with changing the Eu3+/Tb3+ ratio. The average decay time of Eu3+ increases from 2.10 to 5.81 ms with the concentration of Tb3+ increasing from 2% to 8%, and reaches the maximum at 0.08, and is shortened when the concentration of Tb3+ goes beyond 8%.
1. Introduction
Nowadays, as the next-generation lighting and display systems, the white light-emitting diodes (WLEDs) are attracting much attention due to their environmental friendliness, reliability, and low power consumption.1–5,28,29 In general, the manufacture of white light phosphors follows one of two routes. One approach is to mix monochromatic (red/green/blue) phosphors in the best proportion, the other approach is to excite yellow phosphors using blue or ultraviolet (UV) emitting chips.6 However, for phosphor mixtures, the strong re-absorption and nonuniformity of luminescence problems exist, this result gives rise to the loss of luminescence efficiency, properties, and multicolor emitting points. Compared with phosphor mixtures, a single phase phosphor has more advantages and overcomes these problems. So, the single phase phosphor is a very promising material.7–9,30,31Recently, more and more scholars focus on pyrophosphate phosphor materials which have the advantage of environmental friendliness, chemical stability, low power consumption, and high efficiency, etc.10 In the rare earth family, due to the existence of 5D3–7F5, and 5D4–7F5 transition, the Tb3+ ion doped phosphors which can emit blue and green light has been prepared in previous research. Meanwhile, Eu3+ ion is a red emitting activator due to its 5D0–7F2 transition.6 Accordingly, the Tb3+ and Eu3+ co-doped phosphors can generate simultaneous the red/green/blue emissions. At present, by means of the energy-transfer from a sensitizer to an activator, the multicolor emitting phosphor can be usually designed under ultraviolet excitation, so by co-doping of Eu3+ and Tb3+ ions, the color emission may be tuned base on the energy transfer from Tb3+ to Eu3+. In some literatures, the Tb3+ and Eu3+ co-doped phosphors have been used in the studies of W-LEDs, such as Sr2P2O7:Tb3+, Eu3+,6 KCaY(PO4)2:Tb3+, Eu3+,11 LaPO4:Tb3+, Eu3+, Bi3+.12
For all we know, for Ba1−x−yP2O7:xEu3+, yTb3+ phosphors, its luminescence properties and the mechanism of Tb3+ → Eu3+ energy transfer have not been investigated in the previous study. In this study, the phosphors Ba2P2O7:Tb3+, Eu3+ were synthesized by solid-state reaction method in air. The crystal structure, photoluminescence properties, color tunability, the mechanism of Tb3+ → Eu3+ energy transfer, and luminous efficiency of prepared samples were systematically studied.
2. Experimental
2.1. Sample synthesis
The powder samples Ba2P2O7:Tb3+, Eu3+ were prepared by the conventional solid-state reaction in air. According to mole ratio of elements in Ba1.94−yP2O7:0.06Tb3+, yEu3+, we calculated and weighed the raw materials BaCO3 (A.R.), NH4H2PO4 (A.R.), Tb4O7 (99.99%) and Eu2O3 (99.99%), and then the raw materials were fully ground in an agate mortar. Eventually, the mixtures in the alumina crucible was put into the muffle furnace and calcined at 1100 °C for 2 h. The samples were obtained after cooled to room temperature.2.2. Sample characterization
The X-ray diffraction (XRD) patterns of the samples were recorded via using Japan Rigaku D/Max-2200 X-ray diffractometer with Cu-Kα radiation (λ = 0.15406 nm). The excitation and emission spectra were observed by the Hitachi F-4600 fluorescence spectrophotometer. Fluorescence lifetime were investigated by using the Edinburgh FS5 fluorescence spectrophotometer. All the measurements above were carried out at room temperature.3. Results and discussion
3.1. Structure characterization
Fig. 1a and b shows the X-ray diffraction patterns of Ba2P2O7:Tb3+, Eu3+ and Ba1.88P2O7:0.06Eu3+, 0.06M+ (Li+, Na+, K+) samples, respectively. All XRD patterns are found to agree well with standard data (JCPDS 30-0144) in the Ba2P2O7. The results indicate that the Ba2P2O7 host keep the crystal structure when the M+, Tb3+ and Eu3+ in small amount doping.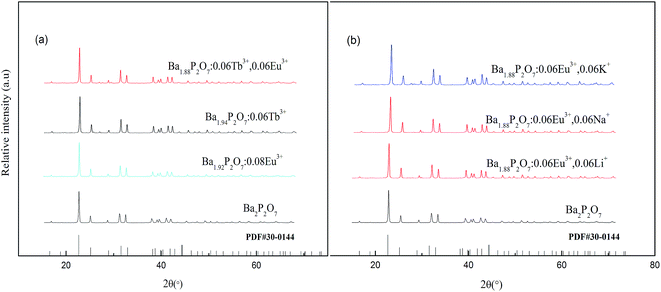 | ||
| Fig. 1 XRD pattern of phosphors: (a) Ba2−x−yP2O7:xTb3+, yEu3+, (b) Ba1.88P2O7:0.06Eu3+, 0.06M+ (Li+, Na+, K+). | ||
3.2. Luminescence properties of the Ba2P2O7:Tb3+, Eu3+
Fig. 2a shows the excitation and emission spectra of Ba1.94P2O7:0.06Eu3+ phosphor. When monitored at 593 nm, several excitation peaks at 361 nm, 381 nm and 395 nm are obtained and assigned to 7F0 → 5D4, 7F0 → 5L7 and 7F0 → 5L6 transitions, respectively.12,13 In the emission spectrum of Ba1.94P2O7:0.06Eu3+ sample, under excitation at 395 nm, the feature emission peaks are observed at 593 and 613 nm. According to the Judd–Ofelt theory,14–16 the transition 5D0–7F1 is the magnetic dipole, and it is orange emission at 593 nm. While the transition 5D0–7F2 is the electric-dipole, it is red emission centered at 613 nm.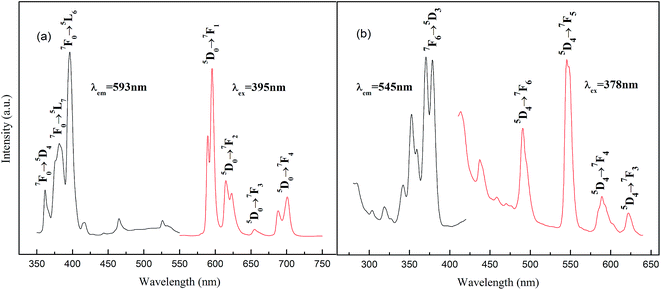 | ||
| Fig. 2 Excitation and emission spectra of phosphor: (a) Ba1.94P2O7:0.06Eu3+, (b) Ba1.94P2O7:0.06Tb3+. | ||
As we all know, the transition 5D0–7F1 (593 nm) is the magnetic dipole, and it is insensitive to distortion of the inversion symmetry, whereas the electric dipole transition 5D0–7F2 (613 nm) is hypersensitive to it, and the intensity ratio (5D0–7F2)/(5D0–7F1) suggests the degree of distortion.16 In our experiment, the transition 5D0–7F1 (593 nm) was stronger than the 5D0–7F2 (613 nm), this result reveals Eu3+ ions mainly occupy the inversion symmetry lattice site.
Fig. 2b shows the excitation and emission spectra of Ba1.94P2O7:0.06Tb3+. When monitored at 545 nm, there are several excitation peaks between 300 and 380 nm, where the strongest one is at 378 nm (7F6 → 5D3).6,10 In the emission spectrum of Ba1.94P2O7:0.06Tb3+ sample, under excitation at 378 nm, the feature emission peaks are observed at 491, 545, 589, and 622 nm corresponding to 5D4 to 7F6, 7F5, 7F4, and 7F3 transitions, respectively.6,11
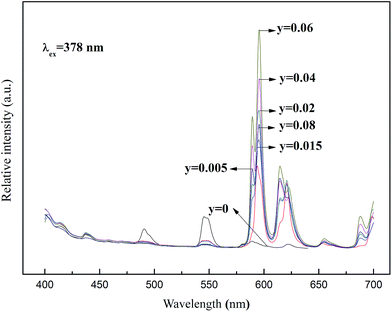
Fig. 3 shows the emission spectra of Ba1.94−yP2O7:0.06Tb3+, yEu3+ samples excited at 378 nm. When doped the Eu3+ and Tb3+ in the Ba2P2O7, the samples exhibit not only 5D4 to 7F6,5,4,3 emission bands of the Tb3+ ions but also the 5D0–7F1,2 emission of the Eu3+ ions. When the Tb3+ doping concentration is 0.06, we change the doping concentration of Eu3+ (the concentration of 0, 0.005, 0.015, 0.02, 0.04, 0.06 and 0.08, respectively), the emission intensities of 593 and 613 nm (5D0–7F1,2) of Eu3+ are enhanced and reaches the maximum at y = 0.06, meanwhile the emission intensity of Tb3+ is impaired. This indicated that the efficient probability is notably enhanced for energy transfer (Tb3+ → Eu3+). According to the above results, the optimal composition of Tb3+ and Eu3+ co-activated phosphor is Ba1.88P2O7:0.06Tb3+, 0.06Eu3+, which shows the strongest emission.
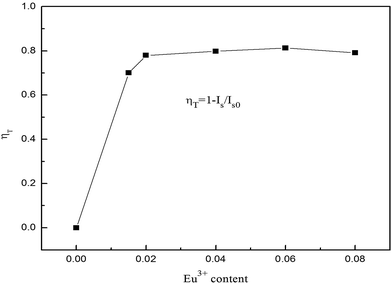
From the emission intensity of sensitizer, the energy-transfer efficiency (ηET) from a sensitizer to an activator can be obtained as the following equation:8,9
 | (1) |
In general, for the energy transfer from a sensitizer to an activator, there are two main aspects: one is exchange interaction (the typical critical distance is no more than 5 Å) and the other is multipolar interaction (the critical distance is longer than 10 Å).17,23,24 According to Blasse, the critical distance Rc for energy transfer from the Tb3+ to Eu3+ ions can be calculated using the following equation:18,20,26,27
 | (2) |
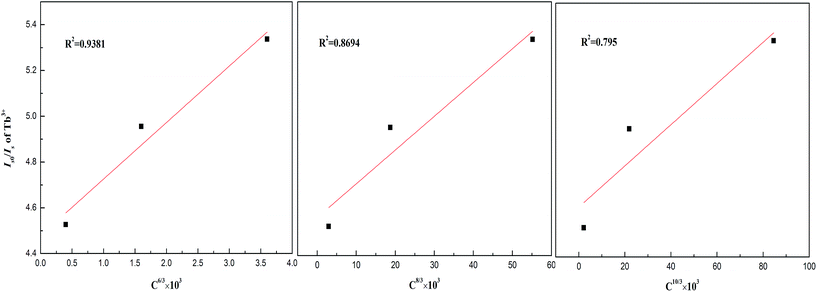
In order to further verify the mechanism of energy transfer for Ba2P2O7:Tb3+, Eu3+, Dexter's formula of multipolar interaction and Reisfeld's approximation are used as follows:19,21,22
 | (3) |
The Is0/Is–Cn/3 (n = 6, 8, 10) plots for Ba1.94−yP2O7:0.06Tb3+, yEu3+ (at excitation wavelength of 378 nm and emission wavelength of 545 nm) are shown in Fig. 5. It can be seen that when n = 6, the Is0/Is value follows the linear growth law much better than n = 8 or 10. So the dipole–dipole mechanism is the mainly way for the energy transfer between Tb3+ and Eu3+ in Ba2P2O7.
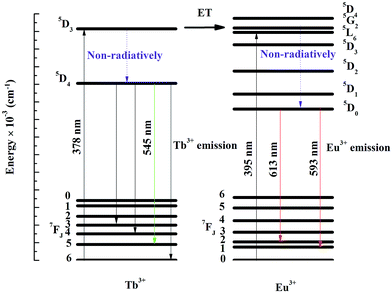
The energy-transfer mechanism of Tb3+ and Eu3+ are shown in Fig. 6. Upon 378 nm excitation, few excited Tb3+ ions is excited to higher energy level through Tb3+:7F6–5D3 transitions, then relaxed to lower energy levels through Tb3+:5D3–7F5,4,3 non-radiative transitions and to its lower lying Tb3+:5D4 metastable state relaxed to lower energy levels through Tb3+:5D4–7F5,4,3 transitions.
The rest of the Tb3+:5D3 level transfer their energy to the Eu3+:5G2 level i.e. the energy transfer. A fast non-radiative decay from 5G2 excited state increase the population of 5D0 metastable state causing enhanced emission from Eu3+ ions through 5D0–7FJ (J = 0–6) transitions. Finally, the characteristic emission of Eu3+ at 593 and 613 nm was enhanced.
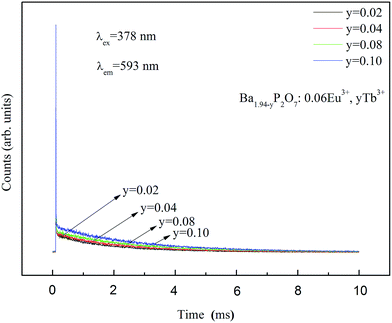
Fig. 7 shows luminescence decay for 5D0 level of Eu3+ in Ba1.94−yP2O7:0.06Eu3+, yTb3+ (y = 2%, 4%, 8%, 10%) excited at 378 nm and measured at 593 nm. The decay times of Eu3+ can be more accurate fitted via using second-order exponential decay mode as follows:25
 | (4) |
 | (5) |
For Ba1.94−yP2O7:0.06Eu3+, yTb3+ (y = 0.02, 0.04, 0.08, 0.10) phosphors, corresponding to the 5D0 level of Eu3+, when the samples are excited at 378 nm, the average lifetimes that calculated by eqn (5) are 2.10, 2.51, 5.81, and 2.65 ms, respectively. The average decay time of Eu3+ increases from 2.10 to 5.81 ms as the increase of the concentration of Tb3+ from 0.02 to 0.08, the results confirmed the exist of energy transfer from Tb3+ to Eu3+ ions.34,35 When the Tb3+ beyond 8% mol, the average decay time of Eu3+ is shortened oppositely, which is corresponding to the widely known concentration quenching effect happened in high concentration.
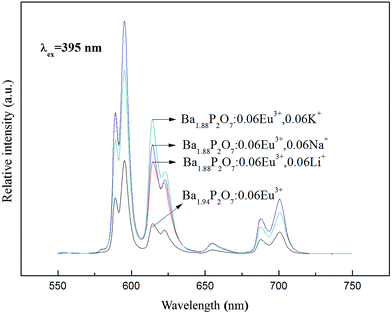
Due to Eu3+ and Ba2+ have similar radius, the Eu enter the lattice, and replace the position of the Ba2+ to form a point defect  which have a positive charge.32,33 In order to keep the charge balance, it can be implemented by doping alkali metal ions. For Ba1.94P2O7:0.06Eu3+ phosphors, we regard Li+ (Li2CO3), Na+ (Na2CO3) and K+ (K2CO3) as charge compensations to stabilize the structure. The results are shown in Fig. 8. When the M+ (Li+, Na+, K+) doping concentration are 0.06 respectively, the intensity of Ba1.94P2O7:0.06Eu3+ are all enhanced. The doping Na+ enhanced emission intensity more than by doping Li+ or K+ at 593 nm, and the emission intensity at 613 nm is higher by doping K+.
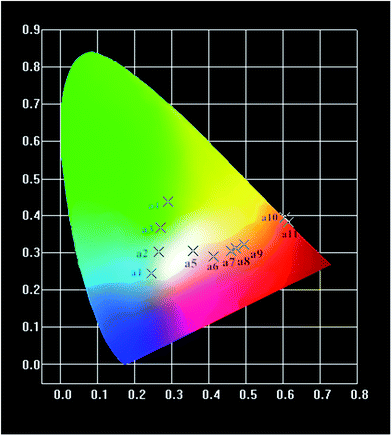
Fig. 9 shows the CIE chromaticity diagram for Ba2−x−yP2O7:xTb3+, yEu3+ phosphors. According to the emission spectra, the values of CIE parameters of the Ba2−x−yP2O7:xTb3+, yEu3+ phosphors with different doping concentrations are summarized in Table 1. Under the excitation at 378 nm, the CIE coordinates of the phosphors can be tuned from blue-green (point a1, a2, a3, a4) to white (point a5), yellow (point a6, a7, a8, a9) and finally to the orange-red (point a10, a11) by changing the Eu3+/Tb3+ ratio. The CIE chromaticity coordinates associated with white luminescence (0.358, 0.305) of Ba1.94−xP2O7:0.06Tb3+, 0.001Eu3+ sample (point a5) are very close to an ideal white chromaticity coordinates (0.33, 0.33). However, upon 395 nm excitation, the CIE chromaticity coordinates are associated with orange-red luminescence of Ba2−xP2O7:xEu3+ phosphor (point a10, a11). Above results indicate that the phosphors show merits of multicolor emissions in the visible region when excited by a single wavelength light.
| Point | Sample (λex = 378 nm) | CIE (x, y) |
|---|---|---|
| a1 | Ba1.98P2O7:0.02Tb3+ | (0.245, 0.244) |
| a2 | Ba1.94P2O7:0.06Tb3+ | (0.264, 0.303) |
| a3 | Ba1.92P2O7:0.08Tb3+ | (0.271, 0.368) |
| a4 | Ba1.75P2O7:0.25Tb3+ | (0.291, 0.437) |
| a5 | Ba1.939P2O7:0.06Tb3+, 0.001Eu3+ | (0.358, 0.305) |
| a6 | Ba1.935P2O7:0.06Tb3+, 0.005Eu3+ | (0.412, 0.289) |
| a7 | Ba1.92P2O7:0.06Tb3+, 0.02Eu3+ | (0.459, 0.304) |
| a8 | Ba1.9P2O7:0.06Tb3+, 0.04Eu3+ | (0.473, 0.312) |
| a9 | Ba1.88P2O7:0.06Tb3+, 0.06Eu3+ | (0.496, 0.322) |
| a10 | Ba1.985P2O7:0.015Eu3+ (λex = 395 nm) | (0.604, 0.395) |
| a11 | Ba1.94P2O7:0.06Eu3+ (λex = 395 nm) | (0.616, 0.383) |
4. Conclusion
In summary, the Ba2−x−yP2O7:xTb3+, yEu3+ phosphors were synthesized by a solid-state reaction at 1100 °C for 2 h. The Ba2−x−yP2O7:xTb3+, yEu3+ phosphors can be effectively excited at 378 nm and have several emission peaks centered at 545 nm, 593 nm and 613 nm. The CIE coordinates of the phosphors can be tuned from blue-green to white, yellow and finally to the orange-red by changing the Eu3+/Tb3+ ratio. The emission intensity of Ba2−xP2O7:0.06Eu3+ was enhanced by doping charge compensation M+ (Li+, Na+, K+). The energy transfer from Tb3+ to Eu3+ in Ba2P2O7 was demonstrated to be dipole–dipole interaction mechanism. The energy transfer efficiency in Tb3+–Eu3+ was approximately 81.26% at x = 0.06, y = 0.06, and for the Ba1.94−yP2O7:0.06Eu3+, yTb3+ (y = 0.02, 0.04, 0.08, 0.10) phosphors, under excitation at 378 nm, the average lifetimes of Eu3+ were determined to be 2.10, 2.51, 5.81, and 2.65 ms, respectively.Acknowledgements
This work was financially supported by the Innovation of Science and Technology Plan Projects of Shaanxi Province, China (Grant no. 2013KTDZ03-02-01), and by the Shaanxi University of Science and Technology Graduate Student Innovation Fund.References
- Z. Y. Hou, G. G. Li, H. Z. Lian and J. Lin, J. Mater. Chem., 2012, 22, 5254–5276 RSC.
- M. M. Shang, C. X. Li and J. Lin, Chem. Soc. Rev., 2014, 43, 1372–1386 RSC.
- S. Nizamoglu, G. Zengin and H. V. Demir, Appl. Phys. Lett., 2008, 92, 1–18 Search PubMed.
- C. C. Lin, Y. S. Zheng, H. Y. Chen, C. H. Ruan, G. W. Xiao and R. S. Liu, J. Electrochem. Soc., 2010, 157, 900–903 CrossRef.
- H. A. Hoppe, Angew. Chem., Int. Ed., 2009, 40, 3572–3582 CrossRef PubMed.
- M. Xu, L. Wang, D. Jia and H. Zhao, J. Am. Ceram. Soc., 2015, 98, 1536–1541 CrossRef CAS.
- G. G. Li, Y. Zhang, D. L. Geng, M. M. Shang, C. Peng, Z. Y. Cheng and J. Lin, ACS Appl. Mater. Interfaces, 2012, 4, 296–305 CAS.
- W. Lu, N. Guo, Y. C. Jia, Q. Zhao, W. Z. Lv, M. M. Jiao, B. Q. Shao and H. P. You, Inorg. Chem., 2013, 52, 3007–3012 CrossRef CAS PubMed.
- C. H. Huang and T. M. Chen, J. Phys. Chem. C, 2011, 115, 2349–2355 CAS.
- L. Wang, M. Xu, R. Sheng, L. Liu and D. Jia, J. Alloys Compd., 2013, 579, 343–347 CrossRef CAS.
- X. Zhang, L. Zhou, J. Shi and M. Gong, Mater. Lett., 2014, 137, 32–35 CrossRef CAS.
- Y. Xia, Y. Huang, Q. Long, S. Liao and Y. Gao, Ceram. Int., 2015, 41, 5525–5530 CrossRef CAS.
- J. A. Dorman, J. H. Choi, G. Kuzmanich and J. P. Chang, J. Phys. Chem. C, 2012, 116, 12854–12860 CAS.
- B. R. Judd, Phys. Rev., 1962, 127, 750–761 CrossRef CAS.
- G. S. Ofelt, Intensities of crystal spectra of rare-earth ions, J. Chem. Phys., 1962, 37, 511–519 CrossRef CAS.
- D. Kang, H. S. Yoo, H. J. Sang, H. Kim and D. Y. Jeon, J. Phys. Chem. C, 2015, 115, 24334–24340 Search PubMed.
- M. Shang, D. Geng, D. Yang, X. Kang, Y. Zhang and J. Lin, Inorg. Chem., 2013, 52, 3102–3112 CrossRef CAS PubMed.
- M. Jiao, Y. Jia, W. Lü, W. Lv, Q. Zhao, B. Shao and H. You, J. Mater. Chem. C, 2014, 2, 4304–4311 RSC.
- G. Zhu, Y. Wang, Z. Ci, B. Liu, Y. Shi and S. Xin, J. Lumin., 2012, 132, 531–536 CrossRef CAS.
- G. Blasse, Phys. Lett., 1968, 28, 444–445 CrossRef CAS.
- D. L. Dexter, J. Chem. Phys., 1953, 21, 836–850 CrossRef CAS.
- R. Reisfeld, J. Chem. Phys, 1972, 56, 1698–1705 CrossRef CAS.
- G. Blasse, Philips Res. Rep., 1969, 24, 131–144 CAS.
- M. M. Shang, G. G. Li, X. J. Kang, D. M. Yang, D. L. Geng and J. Lin, ACS Appl. Mater. Interfaces, 2011, 3, 2738–2746 CAS.
- X. Qin, X. Zhang and P. He, et al., Ceram. Int., 2015, 41, 5554–5560 CrossRef CAS.
- S. P. Lee, T. S. Chan and T. M. Chen, ACS Appl. Mater. Interfaces, 2014, 7, 40–44 Search PubMed.
- S. P. Lee, C. H. Huang, T. S. Chan and T. M. Chen, ACS Appl. Mater. Interfaces, 2014, 6, 7260–7267 CAS.
- S. Pimputkar, J. S. Speck, S. P. DenBaars and S. Nakamura, Nat. Photonics, 2003, 3, 180–182 CrossRef.
- T. Hashimoto, F. Wu, J. S. Speck and S. Nakamura, Nat. Mater., 2007, 6, 568–571 CrossRef CAS PubMed.
- C. C. Sun, W. T. Chien, I. Moreno, C. T. Hsieh, M. C. Lin and S. L. Hsiao, Opt. Express, 2010, 18, 6137–6148 CrossRef CAS PubMed.
- I. Moreno and C. C. Sun, Opt. Express, 2008, 16, 1808–1819 CrossRef PubMed.
- Q. Long, Y. Gao, Y. H. Huang, S. Liao and B. Song, Mater. Lett., 2015, 160, 436–439 CrossRef CAS.
- P. Li, Z. Wang, Z. Yang, Q. Guo and X. Li, Mater. Lett., 2009, 63, 751–753 CrossRef CAS.
- R. Mi, J. Chen, Y. Liu, M. Fang and L. Mei, RSC Adv., 2016, 6, 28887–28894 RSC.
- K. Pavani, J. S. Kumar and L. R. Moorthy, J. Alloys Compd., 2014, 586, 722–729 CrossRef CAS.
| This journal is © The Royal Society of Chemistry 2017 |

