 Open Access Article
Creative Commons Attribution 3.0 Unported Licence
The flame retardancy and rheological properties of PA6/MCA modified by DOPO-based chain extender
Jianan Cai,
Alvianto Wirasaputra,
Yaming Zhu,
Shumei Liu *,
Yubin Zhou
 ,
Chunhua Zhang and
Jianqing Zhao*
School of Materials Science and Engineering, South China University of Technology, Guangzhou 510640, P. R. China. E-mail: liusm@scut.edu.cn
First published on 3rd April 2017
Abstract
Thermal degradation of polyamide-6 (PA6) readily takes place during the high temperature melt processing, particularly when highly hydrophilic additives are present in the system, consequently inducing the deterioration in viscosity and mechanical properties. To solve such problems, 9,10-dihydro-9-oxa-10-phosphenanthrene-10-oxide (DOPO)-based diepoxide compound (DEP) was synthesized and employed to realize the chain extension of the PA6 macromolecule and to concurrently ameliorate the flame retardancy of PA6/melamine cyanurate (MCA). The addition of 2 wt% DEP successfully assisted the PA6/MCA system (10 wt% of MCA) to pass the UL-94 V-0 rating. The flame-retarding mechanism was studied in-depth by cone calorimeter test and characterization of the charred residue and evolved gas. The rheological data showed that the complex viscosity, storage and loss moduli increased following the chain extension and the chain-extended samples became more sensitive to shear. The tensile and flexural strengths of PA6/MCA/DEP were superior to those of PA6/MCA.
Introduction
Polyamide-6 (PA6), an important type of engineering plastic, is widely used because of its unique balance of mechanical, thermal and electrical properties. However, flammability limits its more extensive application. This problem can be solved by the incorporation of a flame-retardant.1,2 Due to the low efficiency of the commercially available flame retardants, a high content of such additives must be loaded to achieve an ideal result, leading to the decrease in mechanical properties of the material.3Apart from that, the molecular chains of PA6 contain a large number of highly polar amide groups, which would induce severe degradation of the polymer at high temperature in the presence of small amounts of water and impurities. The above phenomenon readily leads to the decline of molecular weight and, consequently, mechanical properties of PA6. Chain extension modification is considered a convenient method to solve the problems.4,5 Chain extenders could promote the coupling reaction between two or more molecular chains to increase the molecular weight, thus improving the mechanical properties of the material.6–8
The concomitance of flame-retarded and chain extension modification might hopefully enhance the flame retardancy of PA6 without deteriorating the mechanical properties. This modification may become significant to broaden the application of PA6 in many high-end fields. In our pilot work, a 9,10-dihydro-9-oxa-10-phosphenanthrene-10-oxide (DOPO)-based diepoxide compound (DEP, Scheme 1) was synthesized and used in combination with aluminum diethylphosphinate (AlPi) to flame-retard PA6. The results showed that such combination realized the flame retardancy of PA6 with superior mechanical properties.9
However, the introduction of AlPi causes an immoderate increase in the evolution of smoke containing corrosive acidic substances, whose presence is not favored in the electronic and electrical applications.9,10 To avoid such circumstance, melamine cyanurate (MCA), a commercial nitrogen-containing flame retardant,11,12 was used in substituting AlPi. Except the green advantage, the single usage of MCA is rather inefficient, in which over 13 wt% must be loaded in PA6 to achieve a decent flame retardancy.13–15 Besides, the high hydrophilicity of MCA leads to an extra drying procedure and the small remaining water might cause a further degradation of PA6 macromolecule. To the best of our knowledge, the combination of MCA and chain extender on PA6 has not been reported so far.
In this work, DEP was employed to realize the simultaneous flame retardant and chain extension modification on PA6/MCA. The flammability and forced combustibility were measured to verify the feasible improvement in flame retardancy, and the related mechanism was studied by in-depth characterization of charred residue and pyrolysis gases. The chain extension effect was evidenced from the alteration of the viscoelasticity of polymer melt and from the increment in mechanical properties of the material.
Experimental
Materials
PA6 (general grade, trade name: TP4208) was purchased from Zig Sheng Industrial Co., Taiwan. MCA was offered by Sichuan Fine Chemical Industry Research and Design Institute, China. DEP was synthesized in our laboratory.9Processing
PA6 and MCA were dried six hours at 95 °C before processing. DEP was dried six hours at 80 °C under vacuum prior to processing. The compounding of dried PA6 with DEP and MCA according to the composition listed in Table 1 was carried out using a 26 mm co-rotating double screw extruder (L/D = 40, Lab Tech Engineering, Germany). The extrusion was conducted at temperatures ranging from 180 °C to 230 °C. After being dried in air at 105 °C for six hours, the vast majority of extruded pellets were injection-molded into two types of specimens for flammability and mechanical properties measurements using EC75-NII injection molding machine (Toshiba, Japan). The remaining pellets were molded into disks with 25 mm diameter and 1 mm thickness to conduct the rheological properties testing.| Sample | Composition (wt%) | LOI (%) | Melt droplet amount | Burning drip | UL-94 rating | ||
|---|---|---|---|---|---|---|---|
| PA6 | MCA | DEP | |||||
| a Melt droplet amount is averaged from 5 specimens. NC: not counted. NR: no rating. | |||||||
| PA6 | 100 | — | — | 22.0 | NC | Yes | NR |
| PA6/MCA-10 | 90 | 10 | — | 30.4 | 2.4 | Yes | V-2 |
| PA6/MCA-14 | 86 | 14 | — | 32.6 | 2.2 | Yes | V-2 |
| PA6/MCA/DEP-1 | 89 | 10 | 1 | 31.8 | 2.1 | Yes | V-2 |
| PA6/MCA/DEP-2 | 88 | 10 | 2 | 32.3 | 2.1 | No | V-0 |
| PA6/MCA/DEP-3 | 87 | 10 | 3 | 33.1 | 2.0 | No | V-0 |
Measurement
The flammability of samples was determined by vertical burning test referencing the UL94-2009 (sample size: 127 × 12.7 × 3.2 mm3) on a UL94-SC50 flame chamber (Fire Testing Technology, UK) and by limiting oxygen index (LOI) test according to the ASTM D-2863 (sample size: 150 × 10 × 4 mm3) on a FTA-SC48 oxygen index instrument (Fire Testing Technology, UK). A CONE-SC60 cone calorimeter (Fire Testing Technology, UK) was used to characterize the forced-flaming behavior referring to ISO 5660. Each sample (100 × 100 × 5 mm3) was exposed vertically to 35 kW m−2 external heat flux. The residue analysis was carried out using S-3700N scanning electron microscope (SEM) (Nova QuatoSEM 430, Netherlands) equipped with energy dispersive X-ray spectroscope (EDX) and a Vertex70 FTIR spectrometer (Bruker, Germany). Thermogravimetric analysis (TGA) was performed using a TG-209F3 thermogravimetric analyzer (Netzsch, Germany) under nitrogen atmosphere at a heating rate of 20 °C min−1 from 30 °C to 700 °C. The thermogravimetric analyzer was coupled with a Tensor 27 FTIR spectrometer (Bruker, Germany) for TGA-FTIR investigation. The carboxyl and amino end group contents were assessed referencing the Waltz-Taylor titration method.16 To prevent the impact on titration result, MCA particles were removed from the system by the following method. The dried extruded pellets were added into hexafluoroisopropanol (HFIP), the resulted suspension was sonicated and centrifuged (rotational speed of 14![[thin space (1/6-em)]](https://www.rsc.org/images/entities/char_2009.gif) 000 rpm for 30 min), the liquid was then dried in vacuum to obtain PA6/DEP sample. The dynamic rheological properties were conducted at 230 °C on an AR-G2 rheometer (TA Instruments, USA), dynamic strain sweep tests were initially carried out to determine the linear visco-elasticity range, the strain amplitude was then set at 10% and the angular frequency sweep was ranged from 0.1 to 628 rad s−1. Dynamic mechanical analysis was conducted on a DMA-242C (Netzsch, Germany) from 20 °C to 100 °C at a heating rate of 3 °C min−1 in three-point bending mode at a frequency of 1 Hz (sample size: 55 × 10 × 4 mm3). The tensile and flexural strengths were measured using AGS-10KNI universal testing machine (Shimadzu, Japan) according to ASTM D-638 and ASTM D-790, respectively. The notched Izod impact strength was tested on a Zwick5113 impact pendulum machine (Zwick Roell, Germany) according to ASTM D-256. The impact fracture surface was imaged using the same scanning electron microscope as above. Differential scanning calorimetry (DSC) analysis was carried out using a DSC-204F1 (Netzsch, Germany), the samples were heated from room temperature to 260 °C with a 20 °C min−1 heating rate and kept at this temperature for 5 minutes to eliminate thermal history, then they were cooled from 260 °C to 30 °C with a 10 °C min−1 cooling rate and kept for 5 minutes before final heating from 30 °C to 260 °C at 10 °C min−1, the whole test was carried out in nitrogen.
000 rpm for 30 min), the liquid was then dried in vacuum to obtain PA6/DEP sample. The dynamic rheological properties were conducted at 230 °C on an AR-G2 rheometer (TA Instruments, USA), dynamic strain sweep tests were initially carried out to determine the linear visco-elasticity range, the strain amplitude was then set at 10% and the angular frequency sweep was ranged from 0.1 to 628 rad s−1. Dynamic mechanical analysis was conducted on a DMA-242C (Netzsch, Germany) from 20 °C to 100 °C at a heating rate of 3 °C min−1 in three-point bending mode at a frequency of 1 Hz (sample size: 55 × 10 × 4 mm3). The tensile and flexural strengths were measured using AGS-10KNI universal testing machine (Shimadzu, Japan) according to ASTM D-638 and ASTM D-790, respectively. The notched Izod impact strength was tested on a Zwick5113 impact pendulum machine (Zwick Roell, Germany) according to ASTM D-256. The impact fracture surface was imaged using the same scanning electron microscope as above. Differential scanning calorimetry (DSC) analysis was carried out using a DSC-204F1 (Netzsch, Germany), the samples were heated from room temperature to 260 °C with a 20 °C min−1 heating rate and kept at this temperature for 5 minutes to eliminate thermal history, then they were cooled from 260 °C to 30 °C with a 10 °C min−1 cooling rate and kept for 5 minutes before final heating from 30 °C to 260 °C at 10 °C min−1, the whole test was carried out in nitrogen.
Results and discussion
Flame retardancy
The flame retardancy is indicated using the measurements of UL-94 and LOI, the results are shown in Table 1. PA6 is inherently flammable with the LOI value of 22.0%. Since the combustion is long-lasting and accompanied by severe dripping, PA6 could not be rated in term of UL-94. Although the addition of 14 wt% MCA alone into PA6 increases the LOI to 32.6%, PA6/MCA-14 sample merely reaches UL-94 V-2 classification in the vertical burning test. The introduction of DEP in PA6/MCA imparts significant improvement in UL-94 rating and LOI values. For the same MCA content in the system (10 wt%), the usage of 2 wt% and 3 wt% DEP successfully assists the material to self-extinguish with the absence of burning drips during the vertical burning test, thus achieving UL-94 V-0 rating. In addition, the LOI value of PA6/MCA/DEP-3 (33.1%) is higher than that of PA6/MCA-14 (32.6%) despite the fact that the former contains less total amount of flame retardant than the latter. Such results indicate that the co-effect of DEP and MCA does exist to endow PA6 with greater flame retardancy compared with the single effect of MCA.The samples of PA6/MCA and PA6/MCA/DEP after UL-94 test were imaged and the digital photos are shown in Fig. 1. MCA exerts the flame-retarded effect by catalyzing the degradation of PA6 thus reducing the melt viscosity and by concurrently producing inert gas at high temperature. Consequently, MCA-containing material typically undergoes more intense dripping during combustion test14,17 and the post-test sample exhibits bubbly surface as an indication of the emission of pressured gas. The above phenomenon still exists after adding DEP. Moreover, the melt droplet amount slightly reduces and the size of convex sphere on the surface of post-test sample becomes larger. Despite of the fact that phosphorus-based compound like DEP might promote the hydrolysis reaction of PA6 and consequently reduce its melt viscosity, the chain extensionality of DEP could bring about a contrary effect by the occurrence of coupling reaction between the epoxy groups and the end groups of PA6. The two opposing actions coexist, but as observed from the visualization results above, the latter gives major impact. The increase in melt viscosity restrains the instantaneous emissions of inert gas and combustible gas, so that they would accumulate and generate more internal pressure to perforate the surface and gush inside out, and eventually extinguish the flame on burning drip.18
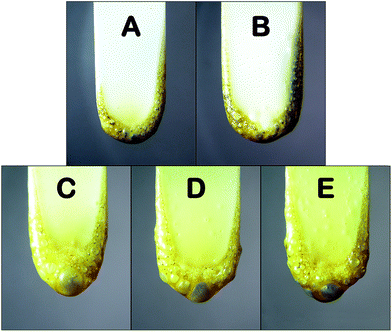 | ||
| Fig. 1 Digital photos of (A) PA6/MCA-10, (B) PA6/MCA-14, (C) PA6/MCA/DEP-1, (D) PA6/MCA/DEP-2 and (E) PA6/MCA/DEP-3 after UL-94 vertical test. | ||
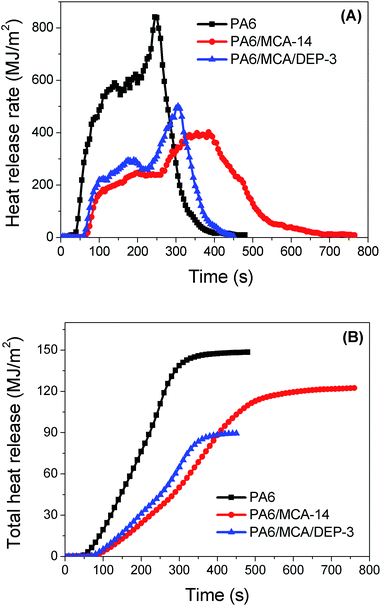
Cone calorimeter measurement is an effective method to analyze the combustion behavior of material under sustained external force. The results of cone calorimeter test, including time to ignition (TTI), heat release rate (HRR), rate of smoke release (RSR), total heat release (THR), total smoke release (TSR) and residual mass, are listed in Table 2. TTI is related to the concentration of flammable gases that are accumulated on the surface of material before ignition. The thermal decomposition of PA6 generally generates combustible substances, some of which are low-boiling-point compounds that easily volatilize into the gaseous phase and become the combustion fuel. Due to the fact that MCA would decompose earlier and produce inert gases to dilute the concentration of flammable gases and oxygen,19 adding MCA to PA6 would lead to a significant increase in the value of TTI. Meanwhile, the usage of DEP shortens the TTI from 65 s of PA6/MCA-14 to 55 s of PA6/MCA/DEP-3, and it is possibly caused by the stimulative degradation of PA6 matrix by the organophosphate compounds that are produced from the decomposition of phosphorus-containing moiety in DEP.
| Sample | TTI (s) | Max HRR (kW m−2) | THR (MJ m−2) | Peak RSR ((m2 s−1)m−2) | TSR (m2 m−2) | Residue (wt%) |
|---|---|---|---|---|---|---|
| PA6 | 30 | 841 | 148.4 | 10.6 | 1284 | 3.6 |
| PA6/MCA-14 | 65 | 402 | 116.1 | 3.2 | 619 | 5.0 |
| PA6/MCA/DEP-3 | 55 | 500 | 89.4 | 9.5 | 891 | 16.4 |
Correlating the HRR curves (Fig. 2A), THR curves (Fig. 2B) and the maximum value of HRR (Table 2), both the highest value is possessed by neat PA6. Since the decomposition of MCA is an endothermic process, and the inert gas product might decelerate the combustion due to the dilution of fuel, PA6/MCA-14 has the smallest value of max HRR. For PA6/MCA/DEP-3, the phosphorus-containing moiety in DEP would decompose at high temperature and produce phosphorus-containing species ˙PO and ˙PO2, which volatilize into the gaseous phase and scavenge the active radicals ˙H and ˙OH. Such reaction proceeds exothermically and leads to the interruption of combustion chain reaction. Accordingly, the active radicals vanish gradually and the heat releases terminate. As a quantitative result, greater reduction in THR value is attained. It is a common fact that the decline of THR value reflects the improvement in flame retardancy.
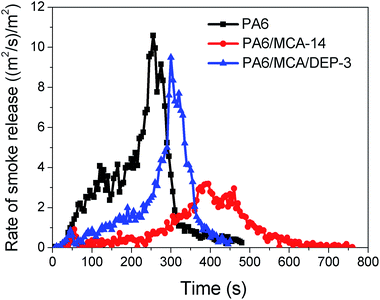
During the combustion, polymers would decompose and generate combustible volatiles that burn on the upper surface of specimen. Such process eventually produces CO2, CO, H2O, carbon and other substances. The usage of MCA obviously decreases the values of max RSR and TSR of PA6 (Fig. 3 and Table 2) due to the dilution effect by the inert gases. On the contrary, the introduction of DEP causes a finite increase in smoke production. Phosphorus-containing species generated by DEP during the combustion would scavenge the active radicals in gaseous phase to interrupt the combustion, in addition to the formation of protective char in condensed phase. Consequently, the oxidation extent of carbon compounds is suppressed, soot and CO are yielded rather than CO2, the former is released as smoke and they are typically attributed for incomplete combustion.1 Comparatively, the max RSR value of PA6/MCA/DEP-3 is yet smaller than that of neat PA6, and this decent outcome ameliorates the previous report regarding the co-employment of AlPi and DEP that raises the RSR value of PA6 by 63% while realizing the flame retardancy.9
The residual mass after cone calorimeter test is listed in Table 2. Compared to neat PA6, the increase of PA6/MCA-14 residue is unobvious, supposing that the flame-retarded effect of MCA in condensed phase is insignificant. Whereas, the residual mass of PA6/MCA/DEP-3 is 2.3 times more than that of PA6/MCA-14. The result assumes that the organophosphate substance produced from the thermal decomposition of DEP might promote the formation of char layer, preliminarily proving the flame-retarded effect of DEP in condensed phase.
The visualization result of scanning electron microscope (SEM) (Fig. 4) exhibits the incompact char layer with macroscopic hole in residue of neat PA6. Large amount of broken convex sphere is observed from the char layer of PA6/MCA-14, and it is originated from the emission of small-pressure inert gases emitted from the decomposition of MCA. As for PA6/MCA/DEP-3, the char layer is continuous and compact, behaving as the protective barrier to impede the heat exchange between gaseous site of combustion and underlying matrix. The char layer in the green square in Fig. 4 is analyzed by energy dispersive X-ray spectroscopy (EDX) and the results are shown in Table 3. Clearly, the PA6/MCA/DEP-3 residue contains phosphorus element, further proving that the phosphorus-containing substances are left in the condensed phase to join the charring process and to increase the stability of char layer.
 | ||
| Fig. 4 SEM images of (A) PA6, (B) PA6/MCA-14 and (C) PA6/MCA/DEP-3 residues after the cone calorimeter test. | ||
| Sample | Mass (wt%) | |||
|---|---|---|---|---|
| C | O | N | P | |
| PA6 | 71.29 | 28.71 | — | — |
| PA6/MCA-14 | 76.95 | 16.05 | 7.00 | — |
| PA6/MCA/DEP-3 | 54.69 | 26.37 | 4.17 | 14.77 |
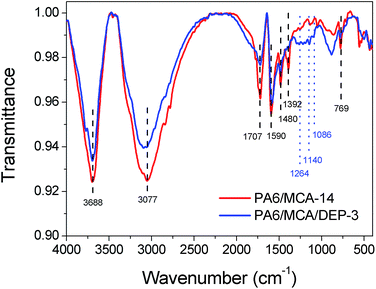
IR spectrometry was used to investigate the chemical composition of the char residue of flame-retarded PA6 (Fig. 5). Both the IR spectra of PA6/MCA-14 and PA6/MCA/DEP-3 exhibit the absorption peaks of aromatic ring (1590 cm−1, 1480 cm−1 and 769 cm−1), C![[double bond, length as m-dash]](https://www.rsc.org/images/entities/char_e001.gif) C–H (3077 cm−1), C
C–H (3077 cm−1), C![[double bond, length as m-dash]](https://www.rsc.org/images/entities/char_e001.gif) O (1707 cm−1) and C
O (1707 cm−1) and C![[double bond, length as m-dash]](https://www.rsc.org/images/entities/char_e001.gif) C (1392 cm−1, 1047 cm−1), which are the characteristic bands of PA6 residue. The signals at 3688 cm−1 (N–H) and 1415 cm−1 (triazine ring) might be originated from MCA, proving the existence of nitrogen-containing substance in condensed phase. The addition of DEP brings about some discrepancy in the IR spectrum. The peaks of P
C (1392 cm−1, 1047 cm−1), which are the characteristic bands of PA6 residue. The signals at 3688 cm−1 (N–H) and 1415 cm−1 (triazine ring) might be originated from MCA, proving the existence of nitrogen-containing substance in condensed phase. The addition of DEP brings about some discrepancy in the IR spectrum. The peaks of P![[double bond, length as m-dash]](https://www.rsc.org/images/entities/char_e001.gif) O (1264 cm−1), P–O–Ar (1140 cm−1) and P–O–R (1086 cm−1) are the characteristic bands of the decomposition products of DOPO. Summarizing the results above, it could be assured that DEP exerts the flame retardancy in condensed phase through the stabilization of char layer.
O (1264 cm−1), P–O–Ar (1140 cm−1) and P–O–R (1086 cm−1) are the characteristic bands of the decomposition products of DOPO. Summarizing the results above, it could be assured that DEP exerts the flame retardancy in condensed phase through the stabilization of char layer.
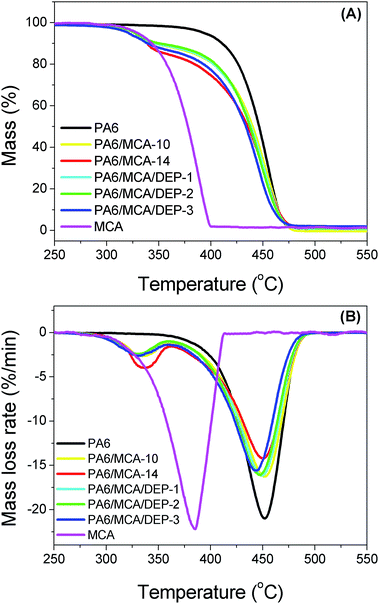
Thermogravimetric analysis was conducted to study the thermal degradation process of the sample (Table 4 and Fig. 6). According to the thermograms, PA6 possesses single step pyrolysis. Meanwhile, MCA decomposes earlier and the process is independent from the decomposition of PA6. Combining the results from Table 4 and Fig. 6, DEP gives no effect on the decomposition of MCA, in which the maximum decomposition rate temperature of MCA maintains the value of around 336 °C. Moreover, the decomposition onset temperature and maximum decomposition rate temperature of PA6 dwindle a little following DEP content and it is caused by the decomposition of phosphorus-containing groups at a relatively lower temperature to generate organophosphate compounds that further stimulate the degradation of PA6.
| Sample | Tmax1 (°C) | Tonset2 (°C) | Tmax2 (°C) |
|---|---|---|---|
| a Tmax1: the maximum decomposition rate temperature of MCA. Tonset2: the decomposition onset temperature of PA6. Tmax2: the maximum decomposition rate temperature of PA6. | |||
| PA6 | — | 427.5 | 454.1 |
| PA6/MCA-10 | 336.1 | 422.3 | 452.5 |
| PA6/MCA-14 | 336.4 | 419.1 | 451.6 |
| PA6/MCA/DEP-1 | 336.2 | 420.0 | 449.1 |
| PA6/MCA/DEP-2 | 335.8 | 417.3 | 448.0 |
| PA6/MCA/DEP-3 | 336.0 | 416.8 | 443.1 |
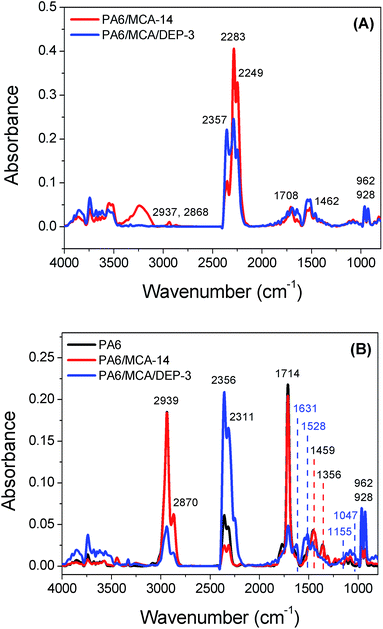
TGA-IR technique was employed to analyze the composition of pyrolysis gas evolved following the thermal degradation. Similarly to the thermogravimetric analysis result, the decomposition process of MCA and PA6 reaches the maxima at 346 °C and 466 °C, respectively. At 346 °C (Fig. 7A), the spectrum of PA6/MCA-14 is substantially overlapped with that of PA6/MCA/DEP-3, indicating that the introduction of DEP does not affect the decomposition process of MCA. The isocyanurate in MCA would decompose at this temperature and produces isocyanate compound20 and oxazolidinone. The former is detected from the absorption peaks in 2283 cm−1 and 2249 cm−1 (–N![[double bond, length as m-dash]](https://www.rsc.org/images/entities/char_e001.gif) C
C![[double bond, length as m-dash]](https://www.rsc.org/images/entities/char_e001.gif) O). Meanwhile, oxazolidinone would further decompose and produce CO2, NH3, fatty amines and other substances, which are detected from the following peaks: 2357 cm−1 (CO2), 962 cm−1 and 928 cm−1 (NH3), 2937 cm−1 and 2868 cm−1 (aliphatic hydrocarbon), 1708 cm−1 (C
O). Meanwhile, oxazolidinone would further decompose and produce CO2, NH3, fatty amines and other substances, which are detected from the following peaks: 2357 cm−1 (CO2), 962 cm−1 and 928 cm−1 (NH3), 2937 cm−1 and 2868 cm−1 (aliphatic hydrocarbon), 1708 cm−1 (C![[double bond, length as m-dash]](https://www.rsc.org/images/entities/char_e001.gif) O) and 1462 cm−1 (C–C).
O) and 1462 cm−1 (C–C).
At 466 °C (Fig. 7B), PA6 would decompose and generates caprolactam, CO2, NH3 and other products. The strong signals at 1459 cm−1, 1356 cm−1, 1714 cm−1, 2939 cm−1 and 2870 cm−1 confirm the presence of caprolactam. The peaks at 2939 cm−1 and 2870 cm−1 might also be originated from the absorption of aliphatic hydrocarbons. The characteristic peaks of CO2 appear at 2356 cm−1 and 2311 cm−1, while the peaks at 962 cm−1, 928 cm−1 and 3500–3750 cm−1 are attributed to NH3. The above-mentioned absorption peaks could all be observed in the spectra of PA6/MCA-14 and PA6/MCA/DEP-3. Particularly, no additional peaks are distinguished in PA6/MCA-14. As for PA6/MCA/DEP-3, several new peaks are detected and attributed as follows: 1631 cm−1 and 1528 cm−1 (aromatic compounds), 1047 cm−1 (P–O) and 1158 cm−1 (P![[double bond, length as m-dash]](https://www.rsc.org/images/entities/char_e001.gif) O). Accordingly, the result signifies the fact that the decomposition process of DOPO moiety in DEP could produce phosphorus-containing species ˙PO2 and ˙PO, and aromatic compounds21 to exert the flame retardancy effect in gaseous phase. In correlation with the reported literatures, it is supposed that no chemical interaction occurs between the decomposition products in the degradation pathways of MCA and DEP.
O). Accordingly, the result signifies the fact that the decomposition process of DOPO moiety in DEP could produce phosphorus-containing species ˙PO2 and ˙PO, and aromatic compounds21 to exert the flame retardancy effect in gaseous phase. In correlation with the reported literatures, it is supposed that no chemical interaction occurs between the decomposition products in the degradation pathways of MCA and DEP.
Chain extension
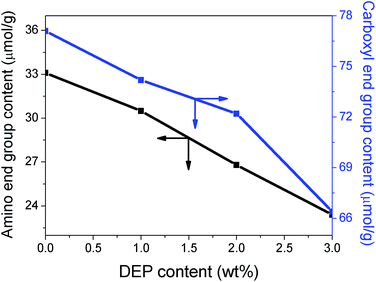
It is well known that epoxy group reacts readily with the terminal amino or carboxyl group of PA6 during processing. Accordingly, the content of such groups were measured to investigate the occurrence of chain extension reaction (Fig. 8). The DEP content in this context refers to the ratio of DEP on PA6/MCA/DEP (MCA content of 10 wt%) before removing MCA particles from the system prior to the titration. The concentration of both amino and carboxyl end groups of PA6 dwindles at different magnitudes following the DEP content. In the case of 3 wt% DEP, the amino and carboxyl end group content is 23.4 μmol g−1 and 66.4 μmol g−1, dropping by 29.3% and 13.8%, respectively, compared to those of neat sample. The different extent signifies the higher reactivity of epoxy with amino rather than with carboxyl. It is noteworthy that both curves are rather linear, that is the negative slope remains substantially constant in the measurement range, implying that the coupling reaction does not reach saturation.Dynamic rheological measurements were conducted to assess the impact of chain extension on the elastic and viscous behavior of PA6 melt. The main parameters of rheological properties are listed in Table 5.
| Parameter | PA6 | PA6/MCA-10 | PA6/MCA/DEP-1 | PA6/MCA/DEP-2 | PA6/MCA/DEP-3 |
|---|---|---|---|---|---|
a  : the complex viscosity in the angular frequency of 1.0 rad s−1. STI: the negative slope of complex viscosity in the high frequency region (50–628 rad s−1). G′1.0: the storage modulus in the angular frequency of 1.0 rad s−1. G′′1.0: the loss modulus in the angular frequency of 1.0 rad s−1. tan : the complex viscosity in the angular frequency of 1.0 rad s−1. STI: the negative slope of complex viscosity in the high frequency region (50–628 rad s−1). G′1.0: the storage modulus in the angular frequency of 1.0 rad s−1. G′′1.0: the loss modulus in the angular frequency of 1.0 rad s−1. tan![[thin space (1/6-em)]](https://www.rsc.org/images/entities/char_2009.gif) δmax: the peak value of loss factor. ωtan δmax: the peak value of loss factor. ωtan![[thin space (1/6-em)]](https://www.rsc.org/images/entities/char_2009.gif) δ,max: the angular frequency at maximum loss factor. δ,max: the angular frequency at maximum loss factor. |
|||||
 (Pa s) (Pa s) |
370 | 658 | 892 | 1110 | 1421 |
| STI | 0.20 | 0.17 | 0.28 | 0.29 | 0.31 |
| G′1.0 (Pa) | 37.8 | 46.1 | 75.3 | 98.6 | 191.0 |
| G′′1.0 (Pa) | 367 | 654 | 885 | 1101 | 1402 |
tan![[thin space (1/6-em)]](https://www.rsc.org/images/entities/char_2009.gif) δmax δmax |
16.8 | 20.6 | 12.4 | 11.4 | 7.8 |
ωtan![[thin space (1/6-em)]](https://www.rsc.org/images/entities/char_2009.gif) δ,max (rad s−1) δ,max (rad s−1) |
4.72 | 3.60 | 1.29 | 0.79 | 0.55 |
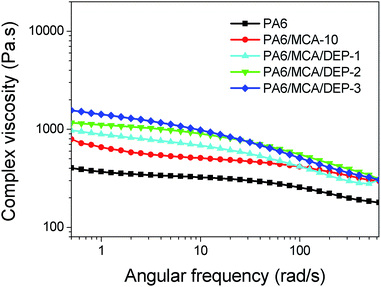
The complex viscosity (Fig. 9) of neat PA6 remains almost constant in the frequency range below 10 rad s−1 but decreases gradually following the further increase of angular frequency, signifying the typical shear thinning behavior. The introduction of MCA enhances the complex viscosity over the whole frequency range due to the following two characteristics of MCA: (1) the high polarity makes MCA finely disperse in PA6 matrix and therefore strengthens the friction of molecular chain segments of the polymer melt, (2) the bulky rigid structure causes the steric hindrance effect to obstruct the movement of molecular chain segments of PA6.22 The complex viscosity of PA6/MCA escalates with the increasing amount of DEP. As listed in Table 5, the complex viscosity of PA6/MCA/DEP-3 at the angular frequency of 1.0 rad s−1 is 1421 Pa s, increased by 1.2 times compared to that of PA6/MCA-10. The increment of complex viscosity indicates the increase in molecular weight by the reason of chain extension, which would not only increase the number of segments in molecular chains but also lead to the entanglement among the molecular chains, consequently increasing the energy to change the conformation and to overcome the friction toward the flow of polymer melt.
The molecular weight and the molecular weight distribution (MWD) of polymer may be evaluated by the shear rate-dependent rheological parameters (η(![[small gamma, Greek, dot above]](https://www.rsc.org/images/entities/i_char_e0a2.gif) )). According to Cox–Merz rule, for almost all polymer melt, the shape of η*(ω) curve is identical with the η(
)). According to Cox–Merz rule, for almost all polymer melt, the shape of η*(ω) curve is identical with the η(![[small gamma, Greek, dot above]](https://www.rsc.org/images/entities/i_char_e0a2.gif) ) curve.23 Therefore, the negative slope of η*(ω) curve in high-frequency region is defined as the shear thinning index (STI) of polymer melt (Table 5). The STI of PA6/MCA-10 is smaller than that of neat PA6, indicating that the melt viscosity of the former is less sensitive to the shear rate. The result denotes the reduction of viscoelasticity of PA6 by the addition of rigid fillers. The introduction of DEP significantly increase the STI value, and it is corresponded with the larger molecular weight and narrower MWD.24,25 The former causes the bigger structural change between before and after the shearing. From the macroscopic viewpoint, the polymer melt becomes more sensitive to stress frequency, and this might be beneficial for injection molding. Since the mobility of lower molecular weight fraction of polymers is relatively easier, which end groups possess the higher reactivity and favor the coupling reaction with the epoxy of DEP, giving the narrower MWD for the modified polymer.
) curve.23 Therefore, the negative slope of η*(ω) curve in high-frequency region is defined as the shear thinning index (STI) of polymer melt (Table 5). The STI of PA6/MCA-10 is smaller than that of neat PA6, indicating that the melt viscosity of the former is less sensitive to the shear rate. The result denotes the reduction of viscoelasticity of PA6 by the addition of rigid fillers. The introduction of DEP significantly increase the STI value, and it is corresponded with the larger molecular weight and narrower MWD.24,25 The former causes the bigger structural change between before and after the shearing. From the macroscopic viewpoint, the polymer melt becomes more sensitive to stress frequency, and this might be beneficial for injection molding. Since the mobility of lower molecular weight fraction of polymers is relatively easier, which end groups possess the higher reactivity and favor the coupling reaction with the epoxy of DEP, giving the narrower MWD for the modified polymer.
Storage modulus (G′) measures the capability for storing the elastic deformation energy of material (Fig. 10A), representing the elastic nature of polymer melt. It shows that the storage modulus of PA6/MCA-10 is higher than that of neat PA6 over the whole frequency test, confirming the filler effect of MCA in PA6 matrix.26 The introduction of DEP further improves the storage modulus of PA6/MCA. The storage modulus of PA6/MCA/DEP-3 at the angular frequency of 1.0 rad s−1 is 191 Pa, which is three times more than that of PA6/MCA-10, signifying the occurrence of chain extension.
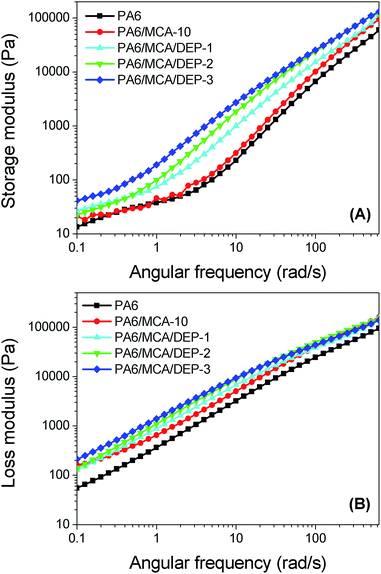 | ||
| Fig. 10 (A) Storage modulus, and (B) loss modulus, as a function of angular frequency for PA6 and flame-retarded PA6. | ||
Loss modulus (G′′) indicates the energy loss from the irreversible deformation of polymer material (Fig. 10B), representing the viscous nature of polymer melt. The loss and storage moduli of PA6/MCA/DEP system exhibit the same and gradually increased tendency. The result demonstrates that the filling and chain extension could affect the viscous flow of PA6 melt due to the intensification of friction force of inter-molecular chains toward the flow.
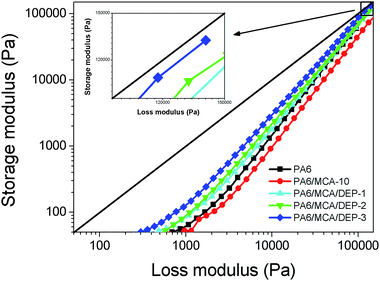
Since the storage modulus and loss modulus represent the elastic portion and viscous portion of polymer melt, respectively, they can be plotted with the former as ordinate and the latter as abscissa, the obtained curve is defined as the Han plot (Fig. 11). The diagonal line (G′ = G′′) divides the figure into two parts and determines the transition from viscous behavior (corresponding to G′ < G′′) to elastic behavior (corresponding to G′ > G′′). Comparing with the neat PA6, the curve of PA6/MCA-10 locates a lower position from the diagonal line over measurement range, indicating that the elastic contribution on melt deformation becomes smaller and further proving the reduction of elasticity of PA6 melt following the introduction of MCA. With the inclusion of DEP, the curves tend to approach the diagonal line gradually, and this is corresponded to the greater elasticity of polymer melt. However, even with 3 wt% of DEP loading, the curve is still not able to pass across the diagonal, presuming that the chain extension effect of DEP in PA6/MCA system predominantly elongates the molecular chain linearly rather than inducing the formation of long branching structure or crosslinking.27
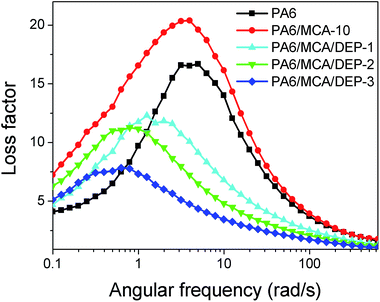
To quantitatively analyze the contribution of elastic part and viscous part on the polymer melt, the ratio of loss modulus and storage modulus is defined as the loss factor (tan![[thin space (1/6-em)]](https://www.rsc.org/images/entities/char_2009.gif) δ). Fig. 12 illustrates the loss factor curves and the peak values are listed in Table 5. According to the results, PA6/MCA-10 possesses the highest loss factor peak. The chain extension effect of DEP leads to the decrease in the peak value of loss factor, which is contributed from the enhancement of elasticity.28 The angular frequency at maximum loss factor ωtan
δ). Fig. 12 illustrates the loss factor curves and the peak values are listed in Table 5. According to the results, PA6/MCA-10 possesses the highest loss factor peak. The chain extension effect of DEP leads to the decrease in the peak value of loss factor, which is contributed from the enhancement of elasticity.28 The angular frequency at maximum loss factor ωtan![[thin space (1/6-em)]](https://www.rsc.org/images/entities/char_2009.gif) δ,max is also listed in Table 5. Referring to the time–temperature superposition principle, the elevation of temperature and prolongation of observation time (equivalent with the reduction of excitation frequency) give the equivalent impact for the molecular motion and viscoelastic behavior of polymer. Therefore, two tan
δ,max is also listed in Table 5. Referring to the time–temperature superposition principle, the elevation of temperature and prolongation of observation time (equivalent with the reduction of excitation frequency) give the equivalent impact for the molecular motion and viscoelastic behavior of polymer. Therefore, two tan![[thin space (1/6-em)]](https://www.rsc.org/images/entities/char_2009.gif) δ–ω curves that are obtained at different temperatures in dynamic mechanical test could overlap using one shift factor. In other words, the shape of tan
δ–ω curves that are obtained at different temperatures in dynamic mechanical test could overlap using one shift factor. In other words, the shape of tan![[thin space (1/6-em)]](https://www.rsc.org/images/entities/char_2009.gif) δ–ω and tan
δ–ω and tan![[thin space (1/6-em)]](https://www.rsc.org/images/entities/char_2009.gif) δ–τ curves is identical, that is the low frequency corresponds to high temperature and the high frequency to low temperature. It is well known that the temperature at which the loss factor reaches its peak value in tan
δ–τ curves is identical, that is the low frequency corresponds to high temperature and the high frequency to low temperature. It is well known that the temperature at which the loss factor reaches its peak value in tan![[thin space (1/6-em)]](https://www.rsc.org/images/entities/char_2009.gif) δ–T curve is determined as the glass transition temperature of the polymer. It can be concluded that the decrease in ωtan
δ–T curve is determined as the glass transition temperature of the polymer. It can be concluded that the decrease in ωtan![[thin space (1/6-em)]](https://www.rsc.org/images/entities/char_2009.gif) δ,max indirectly suggests an increase in glass transition temperature, which might be originated from the greater rigidity and larger molecular weight. The former explains the presence of rigid filler (MCA) while the latter further proves the chain extension effect of DEP.
δ,max indirectly suggests an increase in glass transition temperature, which might be originated from the greater rigidity and larger molecular weight. The former explains the presence of rigid filler (MCA) while the latter further proves the chain extension effect of DEP.
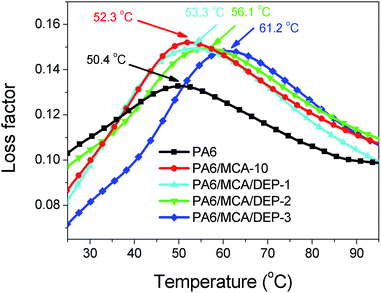
To confirm the aforesaid relevancy, dynamic mechanical analysis was conducted to obtain the loss factor-temperature (tan![[thin space (1/6-em)]](https://www.rsc.org/images/entities/char_2009.gif) δ–T) curve (Fig. 13). The peak value shifts progressively toward the higher temperature following the introduction of MCA and DEP, signifying the increase of glass transition temperature (Tg) of the polymer. For instance, the Tg value raises from 50.4 °C of PA6 to 52.3 °C of PA6/MCA-10. The chain extension effect of DEP causes a bigger extent of escalation, in which PA6/MCA/DEP-3 attains the Tg value of 61.2 °C, increasing by 8.9 °C compared to that of PA6/MCA-10. The outcome is consistent with the tendency in tan
δ–T) curve (Fig. 13). The peak value shifts progressively toward the higher temperature following the introduction of MCA and DEP, signifying the increase of glass transition temperature (Tg) of the polymer. For instance, the Tg value raises from 50.4 °C of PA6 to 52.3 °C of PA6/MCA-10. The chain extension effect of DEP causes a bigger extent of escalation, in which PA6/MCA/DEP-3 attains the Tg value of 61.2 °C, increasing by 8.9 °C compared to that of PA6/MCA-10. The outcome is consistent with the tendency in tan![[thin space (1/6-em)]](https://www.rsc.org/images/entities/char_2009.gif) δ–ω curve and corroborates the relationship establishment. Besides, the increment of glass transition temperature implies the heat resistance improvement for the material, and this feature is beneficial for the application in higher usage temperature.
δ–ω curve and corroborates the relationship establishment. Besides, the increment of glass transition temperature implies the heat resistance improvement for the material, and this feature is beneficial for the application in higher usage temperature.
Mechanical properties
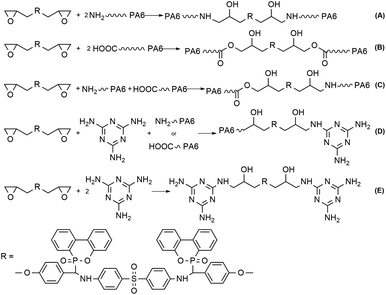
The mechanical properties were measured to assess the impact of filler MCA and chain extender DEP on PA6 matrix, the results are listed in Table 6. In addition to the rigid particle characteristic of MCA that is beneficial for improving the stiffness of polymeric material, the amino group in its structure could interfere with the existing intermolecular bonds of PA6 and form stronger hydrogen bonds to enhance the interaction force between PA6 macromolecular chains. As the result, the rigidity of material that is exemplified by tensile and flexural strengths is increased. However, since MCA was blended in PA6 matrix by physical means, the dispersed particles would turn as a stress concentration under external force and propagate crack to result in the decrease in impact strength, which is sensitive to such structural defect. The tensile and flexural strengths of PA6/MCA increases gradually following the loading of DEP. In fact, PA6/MCA/DEP-3 attains the tensile and flexural strength values of 76.9 MPa and 105.2 MPa, increased by 14.1% and 11.3%, respectively, compared with those of PA6/MCA-10. Such improvement in tensile and flexural strengths is originated from the extension of PA6 molecular chain by the coupling reaction of epoxy with amino or carboxyl end group of PA6 (Scheme 2(A)–(C)). Once the molecular weight raises, the amount of chain entanglement increases, more stress might be transferred within the system and the subjected material would be able to withstand larger load, perpendicular to and collinear with the longitudinal axis, prior to breaking. In addition, epoxy group also possesses high reactivity with the amino group in melamine molecule.29 One epoxy group in DEP could react with the amino group of MCA, (Scheme 2(D)), resulting in the improved compatibility between MCA particle and PA6 matrix, which would also endow a beneficial effect on the tensile and flexural strengths of material due to the facilitation of stress transfer by the emergence of chemical interaction. Moreover, two epoxy groups of DEP might both react with the amino groups of MCA (Scheme 2(E)), chemical agglomeration of the particle would ensue, and this leads to the enlargement of MCA particle size and the deterioration of its dispersion in PA6 matrix. Macroscopically, stress concentration might readily emerge in such uneven system to propagate crack when sudden load is applied and it is evidenced by the decrease of impact strength. For comparison, the intermediate product D-DDS, which does not bear epoxy groups, is used to substitute the same amount of DEP (3 wt%) in PA6/MCA/DEP-3. The impact strength of PA6/MCA/D-DDS-3 is 54.8 J m−1 and it is higher than that of PA6/MCA/DEP-3 (47.4 J m−1). In fact, the value is almost equal to that of PA6/MCA-14 (54.9 J m−1). Such result indicates that the utilization of diepoxide in the molecular structure of DEP could cause the agglomeration of MCA due to the reactivity between the two epoxy groups of DEP and amino groups of MCA.| Sample | Tensile strength (MPa) | Flexural strength (MPa) | Izod impact strength (J m−1) |
|---|---|---|---|
| PA6 | 63.0 ± 0.1 | 86.1 ± 0.1 | 86.3 ± 0.2 |
| PA6/MCA-10 | 67.4 ± 0.8 | 94.5 ± 0.2 | 75.9 ± 1.3 |
| PA6/MCA-14 | 67.0 ± 0.2 | 92.5 ± 0.8 | 54.9 ± 0.4 |
| PA6/MCA/DEP-1 | 75.3 ± 0.1 | 99.9 ± 0.1 | 49.1 ± 0.1 |
| PA6/MCA/DEP-2 | 76.4 ± 0.2 | 102.3 ± 1.1 | 48.4 ± 0.1 |
| PA6/MCA/DEP-3 | 76.9 ± 0.6 | 105.2 ± 0.2 | 47.4 ± 0.5 |
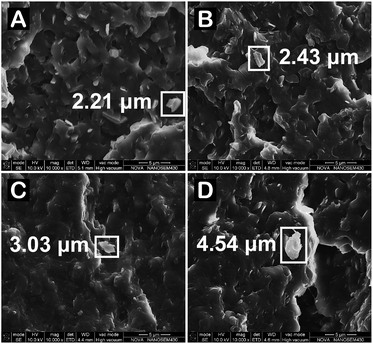
To confirm such postulation, the morphology of fracture surface of the samples was imaged (Fig. 14) and the featured size of agglomerated particles is marked on the figures. The MCA particles of PA6/MCA disperse evenly at a uniform size with sharp interface in PA6 matrix. As the DEP content increases, the particle interfaces become indistinct and it manifests the improvement of interfacial adhesion by the compatibilization effect. Moreover, the agglomerated MCA particle could be clearly seen in PA6/MCA/DEP samples, in which the featured size is enlarged following the DEP content. The visualization result of SEM is consistent with the quantitative measurements of mechanical properties.
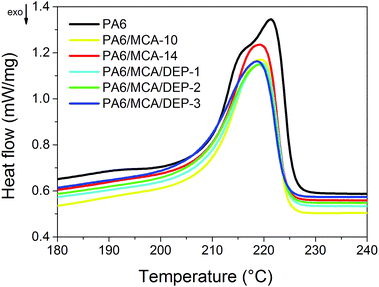
DSC analysis was conducted to investigate the impact of MCA and DEP on the crystallinity of PA6. The melting curves are illustrated in Fig. 15 while the melting enthalpy and the calculated crystallinity are listed in Table 7. It is clearly seen from the melting curve that upon the addition of MCA, the low-temperature peak, which corresponds to the γ-crystalline form, disappears and the high-temperature peak, which corresponds to the α-crystalline form, becomes lower. The result indicates that the filler property of MCA does not induce the heterophase nucleation of PA6.30 The bulky rigid MCA molecule would interfere with the existing hydrogen bonds of PA6 and obstruct the movement of molecular chain segments, leading to the decrease in crystallinity. Furthermore, the crystallinity of PA6/MCA decreases gradually following the increase of DEP content and it is caused by the reason of chain extension.31 In fact, the reduction of crystallinity might be beneficial for increasing the impact strength due to the more production of disordered amorphous phase that is capable for absorbing deformation energy. However, it is found that such result is opposite to the changing trend of impact strength in our study. Therefore, it is considered that the reduced crystallinity affects the impact strength of PA6/MCA/DEP insignificantly.
| Sample | ΔHm (J g−1) | Xc (%) |
|---|---|---|
| a ΔHm: the melting enthalpy. Xc: the crystallinity. | ||
| PA6 | 49.97 | 26.30 |
| PA6/MCA-10 | 40.98 | 21.57 |
| PA6/MCA-14 | 40.73 | 21.44 |
| PA6/MCA/DEP-1 | 38.64 | 20.34 |
| PA6/MCA/DEP-2 | 37.74 | 19.86 |
| PA6/MCA/DEP-3 | 37.32 | 19.64 |
Conclusions
The introduction of DEP endowed PA6/MCA with an improvement on the flame retardancy, in which the addition of 2 wt% and 3 wt% of DEP successfully assisted PA6/MCA (10 wt% of MCA) to attain the UL-94 V-0 rating with the high LOI value of 32.3% and 33.1%, respectively. The total heat and smoke release of PA6/MCA/DEP-3 were decreased by 40% and 31%, respectively, compared with those of neat PA6. The significant increase in residual mass of PA6/MCA/DEP-3 suggested the intensification of charring originated from flame-retarding mechanism by DEP on condensed phase. The occurrence of chain extension reaction was verified by the significant increase in complex viscosity, storage and loss moduli. The quantitative measurement of PA6 terminal group showed that the amino and carboxyl group contents decreased gradually following the DEP content. It can be deduced that DOPO-based diepoxide compound (DEP) not only strives a great chain extension effect on PA6 matrix by the reactivity of epoxide groups, but is also capable of concurrently improving the flame retardancy through the co-action of DOPO moiety with various flame-retardant, such as AlPi and MCA.Acknowledgements
We gratefully acknowledge the support from the National Natural Science Foundation of China (U1201243), the Key Project in Science and Technology of Guangzhou City (201604010089) and the Key Project in Science and Technology of Guangdong Province (2015B090925001).Notes and references
- S.-Y. Lu and I. Hamerton, Prog. Polym. Sci., 2002, 27, 1661–1712 CrossRef CAS.
- A. R. Horrocks and D. Price, Fire retardant materials, Woodhead Publishing Limited, Cambridge, England, 2001, pp. 1–11 Search PubMed.
- Y. Chen, Q. Wang, W. Yan and H. Tang, Polym. Degrad. Stab., 2006, 91, 2632–2643 CrossRef CAS.
- H. Inata and S. Matsumura, J. Appl. Polym. Sci., 1985, 30, 3325–3337 CrossRef CAS.
- Z. Qian, X. Chen, J. Xu and B. Guo, J. Appl. Polym. Sci., 2004, 94, 2347–2355 CrossRef CAS.
- A. Wirasaputra, J. Zhao, Y. Zhu, S. Liu and Y. Yuan, RSC Adv., 2015, 5, 31878–31885 RSC.
- C. Lu, L. Chen, R. Ye and X. Cai, J. Macromol. Sci., Part B: Phys., 2008, 47, 986–999 CrossRef CAS.
- G. P. Karayannidis and E. A. Psalida, J. Appl. Polym. Sci., 2000, 77, 2206–2211 CrossRef CAS.
- A. Wirasaputra, L. Zheng, S. Liu, Y. Yuan and J. Zhao, Macromol. Mater. Eng., 2016, 301, 614–624 CrossRef CAS.
- U. Braun, H. Bahr and B. Schartel, eXPRESS Polym. Lett., 2010, 14, 443–456 Search PubMed.
- A. Casu, G. Camino, M. De Giorgi, D. Flath, V. Morone and R. Zenoni, Polym. Degrad. Stab., 1997, 58, 297–302 CrossRef CAS.
- P. Kiliaris, C. D. Papaspyrides and R. Pfaendner, Macromol. Mater. Eng., 2008, 293, 740–751 CrossRef CAS.
- W. He, Z. Yuan, Y. Liu, Y. Wang and L. Tang, Asian J. Chem., 2014, 26, 8319–8324 CrossRef CAS.
- J. Zhang, M. Lewin, E. Pearce, M. Zammarano and J. W. Gliman, Polym. Adv. Technol., 2008, 19, 928–936 CrossRef CAS.
- Y. Hu, S. Wang, Z. Ling, Y. Zhuang, Z. Chen and W. Fan, Macromol. Mater. Eng., 2003, 288, 272–276 CrossRef CAS.
- J. E. Waltz and G. B. Taylor, Anal. Chem., 1947, 19, 448–450 CrossRef CAS.
- S. V. Levchik, A. I. Balabanovich, G. F. Levchik and L. Costa, Fire Mater., 1997, 21, 75–83 CrossRef CAS.
- Q. Luo, Y. Yuan, C. Dong, S. Liu and J. Zhao, RSC Adv., 2015, 5, 68476–68484 RSC.
- G. Stern and H. Horacek, Int. J. Polym. Mater., 1994, 25, 255–268 CrossRef CAS.
- Y. Liu and Q. Wang, J. Polym. Res., 2009, 16, 583–589 CrossRef CAS.
- A. König and E. Kroke, Fire Mater., 2012, 36, 1–15 CrossRef.
- H. Azizi and I. Ghasemi, Polym. Compos., 2010, 30, 429–435 CrossRef.
- W. Cox and E. Merz, J. Polym. Sci., 1958, 28, 619–622 CrossRef CAS.
- Y. Jahani, M. Ghetmiri and M. Vaseghi, RSC Adv., 2015, 5, 21620–21628 RSC.
- M. Shaw and W. Tuminello, Polym. Eng. Sci., 1994, 34, 159–165 CAS.
- D. Gurovich, C. Macosko and M. Tirrell, Rubber Chem. Technol., 2004, 77, 1–12 CrossRef CAS.
- J. Chen, W. Wei, Q. Qian, L. Xiao, X. Liu, J. Xu, B. Huang and Q. Chen, Rheol. Acta, 2014, 53, 67–74 CrossRef CAS.
- M. Mihai, M. A. Huneault and B. D. Favis, Polym. Eng. Sci., 2010, 50, 629–642 CAS.
- L. Ricciotti, G. Roviello, O. Tarallo, F. Borbone, C. Ferone, F. Colangelo, M. Catauro and R. Cioffi, Int. J. Mol. Sci., 2013, 14, 18200–18214 CrossRef PubMed.
- T.-M. Wu and E.-C. Chen, Polym. Eng. Sci., 2002, 42, 1141–1150 CAS.
- F. Awaja, F. Daver, E. Kosior and F. Cser, J. Therm. Anal. Calorim., 2004, 78, 865–884 CrossRef CAS.
| This journal is © The Royal Society of Chemistry 2017 |


