 Open Access Article
Cellulose/SnS2 composite with enhanced visible-light photocatalytic activity prepared by microwave-assisted ionic liquid method
Chunxiang Lin ab,
Moshuqi Zhua,
Teng Zhangc,
Yifan Liua,
Yuancai Lva,
Xiaojuan Lia and
Minghua Liu*ab
aCollege of Environment & Resources, Fuzhou University, Fuzhou 350108, P. R. China. E-mail: mhliu2000@fzu.edu.cn
bState Key Laboratory of Photocatalysis on Energy and Environment, College of Chemistry, Fuzhou University, Fuzhou 350002, P. R. China
cCollege of Materials Science and Engineering, Fuzhou University, Fuzhou 350108, China
First published on 21st February 2017
Abstract
A facile method was used to synthesize cellulose/SnS2 composites (CE/SnS2) by a microwave-assisted ionic liquid (MAIL) method. The effects of ionic liquid types on the structure and properties of SnS2 samples were investigated. Results showed that the ionic liquid played an important role in the control over the morphology, size and photocatalytic performance of the SnS2 particles. The as-synthesized CE/SnS2 composites were systematically investigated by XRD, SEM, TEM, BET, XPS, UV-visible and PL. It was demonstrated that the obtained CE/SnS2 composites showed three-dimensional architecture and excellent visible-light photocatalytic activity as photocatalyst for RhB degradation. The superior visible-light photocatalytic performances for composites were ascribed to their composite structure and the synergistic effects between flower-like SnS2 and cellulose.
1 Introduction
In the past decades, semiconductor nanomaterials have gained much attention due to their potential applications in solar energy conversion and environmental purification.1–4 Among them, tin disulfide (SnS2), which has a layered CdI2-type structure with tin atoms sandwiched between two layers of sulfur atoms,5 has attracted particular interest in recent years. Compared with the TiO2 (3.2 eV), SnS2 has a narrower band gap of ∼2.2 eV, implying more sensitive to visible light. Moreover, it is inexpensive, non-poisonous, and chemically stable, therefore it has proved to be a promising candidate as a photocatalyst for pollutant degradation.6–8It is known that the performance of the nanostructured materials are closely relative to its crystallinity, morphology, size, crystal defect and surface property, which ultimately depend on the preparation methods and preparation conditions. Thus tremendous efforts have been dedicated to the novel methods for the synthesis of high quality nanoparticles with controlled sizes and shapes.9–12 To date, a variety of methods have been adopted for the synthesis of well defined SnS2 nanostructures with different morphologies including solvothermal process, hydrothermal process, mechanochemical route, solid state reactions, pyrolysis of organotin precursor, and tetrabutyltin precursor.13–17 However, many of them involved harsh reaction conditions such as high temperature, high pressure or complex preparation procedures. Therefore, it remains a big challenge to develop a simple and facile synthesis which requires only mild reaction conditions under normal atmospheric pressure and room temperature. Most importantly, they can be completely synthesized in a short period of time.
Microwave-assisted ionic liquid (MAIL) method is a novel green chemosynthesis which combines the advantages of microwave (MW) irradiation and room temperature ionic liquids. The particularity of microwave irradiation makes it an effective and attractive method for synthesis of nanomaterials with controllable size and shape.18 Compared with conventional heating, it has a more homogeneous heating process and shorter reaction time, generating smaller and more uniform particles.19 Many novel nanomaterials with higher photocatalytic activities were prepared by this simple method.20–22 On the other hand, ionic liquids (ILs) are drawing increasing attention for the synthesis of inorganic materials owing to their appealing physicochemical properties.23,24 Synthesis of photocatalysts in the ILs medium is an exciting and burgeoning area of intense research and has been widely studied recently. It has been reported that the use of ILs as the reaction medium for the synthesis of both pure and modified TiO2 photocatalysts can have a profound effect on the activity, crystallinity and morphology.25–27 Research also showed that ILs played an important role to control the size and morphology of the nanomaterials.28,29 Additionally, ILs can absorb microwave energy efficiently due to their high polarity. Thus, the combination of ILs and MW irradiation makes MAIL method a useful and rapid way for nanomaterials synthesis with well-defined shapes.30
In addition, it is of particular interest to immobilize nanoparticles on supporting materials for the improvement of photocatalytic efficiency, because the composite could observably reduce the recombination and enhance the separation rate of photogenerated charge carriers31 and own a larger specific surface area, which can benefit the absorption and transportation for pollutant molecules and facilitate the rapid diffusion during the reaction. Of various supports, cellulose can be a suitable binder for immobilization and stabilization of semiconductor nanoparticles due to the significant advantages of cost effectiveness, abundant resources, easier accessibility and possession of a lot of surface hydroxyl groups.32
Herein, we report a facile one-pot method, MAIL, for the synthesis of cellulose/SnS2 composite by taking advantage of the dissolution of cellulose in an ionic liquid, and thereby obtaining a uniform SnS2 coating onto cellulose. The effect of different types of ILs on the phase structure and microstructure of SnS2 were discussed and the photocatalytic activities of the composite were evaluated by degrading rhodamine B (RhB) under visible light.
2 Experimental
2.1 Materials
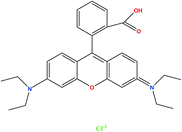
A series of 1-alkyl-3-methylimidazolium salts [CnMIM]X ionic liquids (n = 4, 6; X = BF4, Br, Cl, Aco; purity > 99%; named IL(1)–IL(5), representative [C4MIM]BF4, [C4MIM]Br, [C6MIM]Cl, [C4MIM]Cl and [C4MIM]AcO respectively) were purchased from Shanghai Chengjie Chemical Co., Ltd, China, and their general structures are shown in Scheme 1. All other reagents used in this research were of analytical grade and utilized as-received without further purification. For reference, the structure of RhB is shown in Scheme 2.2.2 Preparation CE/SnS2 composite via microwave-assisted IL method
In a typical procedure, 0.7 g CE was dissolved in 15 g IL(4) to form a transparent solution, and then 3 mmol SnCl4·5H2O and 6 mmol thioacetamide were ultrasound dissolved in this CE/IL mixture. Then the mixture was sealed in a specialized glass tube under microwave irradiation at 120 °C for 120 min (pressure: ∼2 bar) in a single mode microwave reactor (Nova, EU Microwave Chemistry). The as-formed precipitates were collected by centrifuging, copious washing with ethanol and drying.To investigate the effect of ILs on the structure of SnS2, the pristine SnS2 material was prepared by a similar procedure except for the dissolution of cellulose, the corresponding products were labelled as IL1–IL5, respectively. For comparison, this experiment was also done by using glycol instead of ILs as medium, and was labelled as NIL.
2.3 Materials characterization
The crystalline phases of SnS2 and CE/SnS2 composites were evaluated by X-ray diffraction (XRD, MinFlex600, Cu K, λ = 0.15418 nm). Fourier transform infrared (FTIR) spectroscopy was performed using a Nicolet iS10 FT-IR spectrometer by KBr disk. Thermal stability of samples was examined on a thermogravimetric analyzer (NETZSCH STA449C, Germany) in N2 atmosphere. The morphologies and microstructures of the prepared samples were analysed by field-emission scanning electron microscopy (FE-SEM, Nova NanoSEM 230) equipped with an energy-dispersive X-ray spectroscopy (EDX) system, and transmission electron microscopy (TEM TECNAI G2F20). The surface compositions of the catalyst were evaluated by X-ray photoelectron spectra (XPS, Thermo Scientific ESCALAB 250). N2 adsorption–desorption isotherms were obtained at −196 °C on a Micromeritics ASAP 2020 Sorptometer using static adsorption procedures, and the BET surface areas and pore size distributions were calculated by using N2 adsorption–desorption isotherms. UV-vis diffuse reflectance spectroscopy (DRS) was recorded on a Carry 500-Scan spectrophotometer.The photoluminescence (PL) spectra were recorded at room temperature using a FL/FS 900 spectrophotometer equipped with a 300 W xenon lamp as the excitation source.
2.4 Photoelectrochemical measurements and photocatalytic test
Photocurrents were measured with an electrochemical analyzer (CHI650E) in a standard three-electrode system using the prepared samples as the working electrodes with an active area of ca. 0.5 cm2, a Pt wire as the counter electrode, and Ag/AgCl (saturated KCl) as a reference electrode. A 300 W xenon arc lamp through a UV-cutoff filter (≤420 nm) served as a visible-light source, and 0.5 M Na2SO4 solution was used as the electrolyte.Photocatalytic activity of the samples was evaluated by the photocatalytic degradation of rhodamine B (RhB, 20 mg L−1) in an aqueous solution under visible-light irradiation. The photocatalytic system included a 300 W Xe arc lamp with a UV-cut off filter (λ > 420 nm), circulation of water through an external cooling coil and a ventilating fan, which were used to prevent any thermal catalytic effects. All experiments were conducted at room temperature in air. In a typical photocatalytic experiment, 0.03 g photocatalyst was added into 100 ml pollutant solution in a reaction cell with a Pyrex jacket. Prior to irradiation, the suspension was magnetically stirred in the dark for 1 h to reach an adsorption–desorption equilibrium of the pollutant on the catalyst surface. Then these suspensions were exposed to visible-light irradiation under magnetic stirring. At given time intervals, about 5 ml suspensions were collected and centrifuged (13![[thin space (1/6-em)]](https://www.rsc.org/images/entities/char_2009.gif) 000 rpm, 15 min) to remove the photocatalyst particles. The pollutant concentration of the obtained solution was analyzed by a UV-VIS spectrophotometer (Hitachi, U-3310) by checking the absorbance at 553 nm.
000 rpm, 15 min) to remove the photocatalyst particles. The pollutant concentration of the obtained solution was analyzed by a UV-VIS spectrophotometer (Hitachi, U-3310) by checking the absorbance at 553 nm.
3 Results and discussion
3.1 Effect of ionic liquids on structures and properties of SnS2 samples
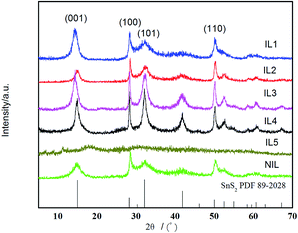
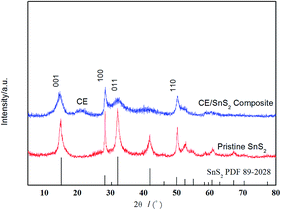
In order to perform the effect of different kinds of ionic liquid on the structures and properties of SnS2 under microwave radiation, pristine SnS2 samples were prepared via MAIL method using IL(1)–IL(5) as medium without cellulose addition.Fig. 1 shows the XRD patterns of the different samples prepared in IL(1)–IL(5). It can be seen that IL1–IL4 and NIL show peaks at 2θ = 15.02°, 28.25°, 32.14°, 50.04°, which could be indexed to reflections from (001), (100), (011), (110) planes of pure hexagonal SnS2 and they are also in good agreement with the standard card (PDF#89-2028). No trace of impurity peaks could be detected in these samples, indicating the phase purity of the products. While IL5 shows amorphous structure, which may be ascribed to the effect of anion in IL(5). The above results indicate that the completely crystalline and pure-phase SnS2 nanoparticles could be obtained by this facile MAIL route using IL(1)–IL(4). Moreover, the intensity of the characteristic diffraction peaks of IL1–IL4 increased in comparison with NIL (sample prepared in glycol).
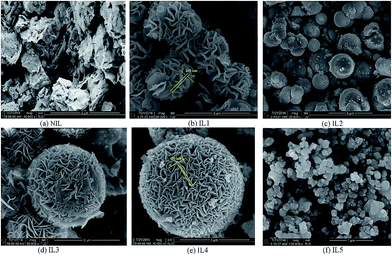
Ionic liquid also have great influence on the morphology of as-prepared SnS2 samples. The morphologies of all samples were characterized by FE-SEM images, as shown in Fig. 2. When only microwave technique was used (without any IL), a large quantity of nanosheet morphology is observed (Fig. 2a). Depending on the IL used, different shapes are obtained. The SEM image of IL1 clearly shows carnation flower-like architectures assembled from 2D nanopetals building blocks with thicknesses of 150–200 nm. In IL2 micro-sized spherical-like particles is observed where each sphere is around 2–4 μm in diameter. The SEM images of IL3 and IL4 show 3D flowerlike microspheres with different sizes of diameter (2–3 μm for IL3 and 4–6 μm for IL4) that are composed of hundreds of nanosheets with thicknesses of 30–50 nm (Fig. 2d and e). Just like a Red Embroidery Ball. The 2D nanosheets interweave together to form an open porous structure. While the morphology of IL5 presents uniform and reunited nanoparticles with diameter of 100–200 nm. These results reveal that the ILs can play an important role in controlling the growth of SnS2 crystals and formation of uniform morphology. Moreover, the length of alkyl side chain in the cation has no effect on morphology of SnS2 but affect the particle size, while the types of anions in imidazolium ILs have great influence on morphology and shape.
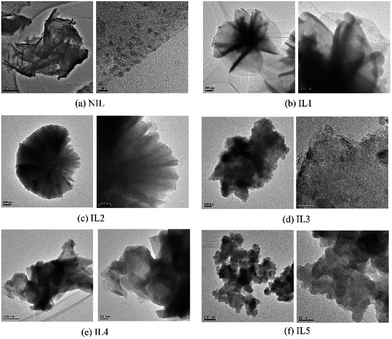
TEM images were performed to further investigate the structure of the as-synthesized SnS2 in different ILs. When no ILs used, it is clear that the irregular nanosheets is made up of numerous uniformly sized nanoparticles (Fig. 3a). While the TEM images of SnS2 presented in Fig. 3b–f reveal that the 3D micro/nano structures prepared by using ILs are assembled by 2D nanosheets. The TEM results showed in Fig. 3b–f exhibit that the products are flower-like, spherical-like, irregular nanosheets and nanoparticles structures, respectively, similar to the SEM results (Fig. 2b–f).
The specific surface areas and pore sizes of SnS2 samples were determined by nitrogen adsorption–desorption isotherms according to Brunauer–Emmett–Teller (BET). As observed in Fig. 4, the isotherms of all the as-synthesized SnS2 are type IV isotherm with a hysteresis loop according to IUPAC classification, which indicates the presence of mesopores in the products.33 The specific surface areas of all samples, calculated by the multi-point Brunauer–Emmett–Teller (BET) method, are listed in Table 1. It is observed that the surface area increases IL2 < NIL < IL1 < IL4 < IL3 < IL5.
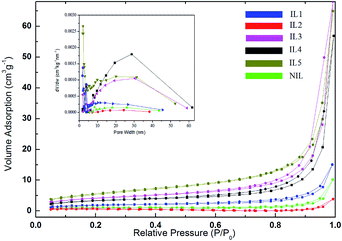 | ||
| Fig. 4 N2 adsorption–desorption isotherm of SnS2 samples prepared in ILs (IL1–IL5) and glycol (NIL). | ||
| ILs | NIL | IL1 | IL2 | IL3 | IL4 | IL5 |
|---|---|---|---|---|---|---|
| Specific surface areas | 3.34 | 6.5060 | 1.89 | 16.6950 | 14.4730 | 23.1462 |
The optical property of all SnS2 samples were investigated with UV-vis diffuse reflectance spectrometer (DRS) as shown in Fig. 5a, from which we see that the IL1–4 exhibit much higher light absorption intensity than NIL and IL5, which may be ascribe to the higher crystalline of IL1–IL4. The optical band gap energy can be calculated by the following formula:
| αhν = A(hν − Eg)1/2 | (1) |
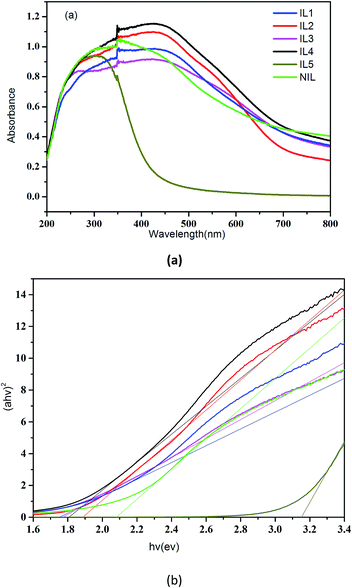 | ||
| Fig. 5 UV-vis solid absorption spectra of SnS2 samples (a) and the corresponding band gap values (b). | ||
The above results confirm that the size, morphology and structure of the nanomaterials can influence the optical properties greatly, thus offer an effective way of tuning the band gap.37
To examine the photocatalytic activities of the all SnS2 samples, the degradation of aqueous solutions of RhB (20 mg L−1) under visible light (λ > 420 nm) irradiation were performed. A blank test (RhB without any catalyst) exhibits no degradation under visible light irradiation, which indicates the photolysis of RhB could be ignored. It can be seen from the curves of RhB absorption rates (Fig. 6) that the adsorption–desorption equilibrium of RhB on the all samples have been achieved in 60 min before visible-light irradiation. As can be seen from Fig. 6, IL5 possesses strong adsorption ability towards RhB with 87.3% of adsorptive ratios before visible light irradiation. That may be due to the larger specific surface area of IL5. The other samples show different photocatalytic activities towards RhB whose photocatalytic activity can be judged roughly by the slope of the degradation curves, which decrease IL4 > IL1 > IL3 > NIL > IL2. It can be presented that IL1, IL3 and IL4 show higher photocatalytic activity than other samples, the possible reason may be ascribed to the combination of smaller band gap energy and the larger specific surface area compared with other samples.
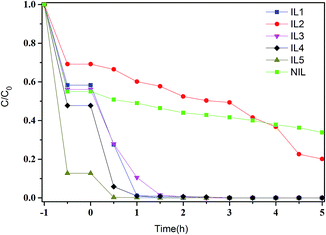 | ||
| Fig. 6 Photocatalytic activities for degradation of RhB dye under visible-light irradiation in the presence of SnS2 samples. | ||
Based on the above results, it is found that although the synthetic conditions are identical for samples prepared in different ILs, SnS2 nano/micro particles show different crystalline, structures, morphologies, size and performance. It can be concluded that the ionic liquid plays an important role in the control over the morphology and size of the product, the reason may be ascribe to different mechanisms, including hydrogen bonds, π–π stack interactions, self-assembly mechanism, electrostatic attraction, and so on.38,39 Meanwhile, it's also presented that the SnS2 samples prepared in imidazole chloride salts, IL(3) and IL(4), exhibit higher photocatalytic performance than other samples.
In the following parts, IL(4), as an efficient solvent for cellulose, was selected as the reaction medium due to the good performance of SnS2 prepared in it; we will discuss the effects of cellulose support on the structures, morphologies and photocatalytic properties of final products using IL(4) as reaction medium under microwave irradiation.
3.2 CE/SnS2 composites synthesis and characterization
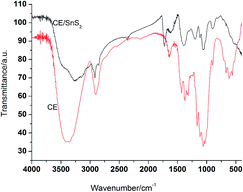
The chemical structure of as-synthesized CE/SnS2 composite has been examined using FT-IR spectra, as shown in Fig. 8. It can be seen that the FTIR spectrum of CE/SnS2 composite is similar with CE and contains all the characteristic absorption of CE. However, the bands centered at around 3400 cm−1, correspond to –OH vibration in CE/SnS2 composite, weakened or shifted due to the interaction between CE and SnS2. In addition, the weak peak corresponds to Sn–S bond that would be appeared at about 630 cm−1 is hard to observe due to overlapping with other peaks.
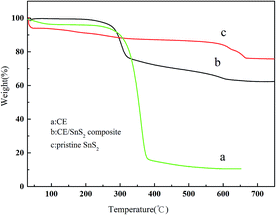
Thermal gravimetric analysis (TGA) was use to reveal the degradation profiles of as-synthesized products. As shown in Fig. 9, the initial weight losses of three lines below 200 °C (5–7%) are attributed to some of the adsorbed water in the products. The main peaks corresponding to the thermal degradation of CE (line a) were observed between 270 and 280 °C and undergoes two stages.
The first weight of loss continues up to 370 °C during which there is 72% weight loss. And the second stage starts at 370 °C, and a residue of 10.5 wt% remains after heating to 650 °C. While the thermal stability of CE/SnS2 composite presents much higher (line b), which shows an initially decomposition of 18% mass loss in the temperature range of 270–320 °C, followed by another 13% mass loss at temperatures between 320 and 750 °C, leaving significantly high (around 62%) residue at 750 °C. The improved thermal stability is ascribed to the complex of SnS2 (line c) by MAIL method. Moreover, the TGA analysis can be also employed to determine the amount of CE presents in CE/SnS2 composite. The weight loss of composites are mainly attributed to the CE composition and phase transformation from SnS2 to SnO2 (the substitution of S by O atoms), which can be calculated from line a and line c, respectively. Thus, the weight fraction of the CE supporter is determined to be ∼20%.
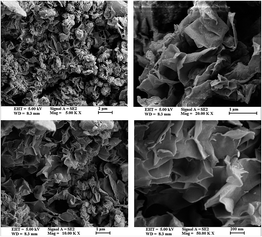
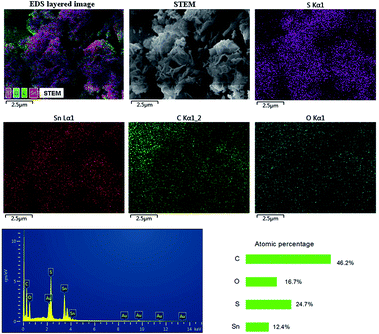
The general morphology of CE/SnS2 composites is shown in Fig. 10. The composites display a 3D flower-like structure composed of 2D SnS2 nanoplates which are tightly anchored on the surface of CE. Without using CE in the synthetic process, the pristine SnS2 materials prepared in IL(4) (Fig. 2e) exhibit a characteristic of 3D Red-Embroidery-Ball-like structure with thicker nanosheets than that of the CE/SnS2 composites, implying that the crystal growth and self-assembly process of SnS2 materials was hindered by the presence of CE.
Also, the scanning transmission electron microscopy (STEM) images of the composite (Fig. 10) and the corresponding elemental mapping images show matched spatial distribution of S, Sn and C, indicating that the SnS2 particles are generated on the surface of CE, in accordance with the SEM observation.
Moreover, energy dispersive X-ray spectroscopy (EDS) analysis (shown in Fig. 11) indicates that the Sn/S molar ratio is approximately 1![[thin space (1/6-em)]](https://www.rsc.org/images/entities/char_2009.gif) :
:![[thin space (1/6-em)]](https://www.rsc.org/images/entities/char_2009.gif) 2, further confirming the formation of SnS2 on the CE surface.
2, further confirming the formation of SnS2 on the CE surface.
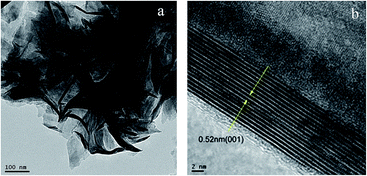
Further insight into the morphology and microstructure of SnS2 nanoparticles loaded on CE is displayed in the TEM image in Fig. 12a. It is clear that the as-synthesized composites are built by the intertwining of single crystalline nanosheets. The relatively light regions are thin sheets lying along the substrate, while the dark regions mean that nanosheets arrange perpendicular to the substrate or convolute during the reaction process. The HRTEM image in Fig. 12b exhibits parallel fringes with a spacing of 0.52 nm, in good agreement with the interlayer spacing of SnS2.
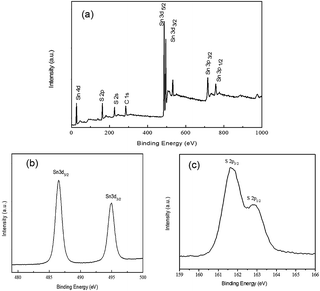
The surface composition of the CE/SnS2 composite was analyzed by XPS as shown in Fig. 13. The binding energy values obtained in the XPS analysis were standardized by referencing the C 1s peak to 284.60 eV. Fig. 13a is a typical XPS survey spectrum of different atoms, which shows that the CE/SnS2 composite is composed of Sn, S and C. The C element is ascribed to the cellulose support. Fig. 13b shows the high-resolution XPS spectrum of the Sn 3d. The two strong peaks at around 486.5 and 495.0 eV are assigned to Sn 3d3/2 and 3d5/2,40 respectively, which is characteristic of Sn4+ in SnS2. The XPS spectrum of S 2p is shown in Fig. 13c. The main peak located at 161.7 and shoulder peak at 162.8 eV can be attributed to S 2p3/2 and S 2p1/2, respectively, which is in agreement with the reported data.41,42
The atomic ratio of Sn/S calculated by the integral area of Sn 3d to S 2p is about 1![[thin space (1/6-em)]](https://www.rsc.org/images/entities/char_2009.gif) :
:![[thin space (1/6-em)]](https://www.rsc.org/images/entities/char_2009.gif) 1.92, which is close to stoichiometric ratio of pure SnS2, and it is also consistent with the result of EDS shown in Fig. 11.
1.92, which is close to stoichiometric ratio of pure SnS2, and it is also consistent with the result of EDS shown in Fig. 11.
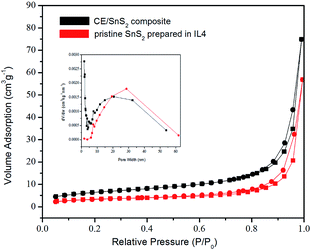
The results of BET analysis of CE/SnS2 composite with the nitrogen adsorption–desorption isotherm are shown in Fig. 14. The well-defined steps of the isotherm illustrate the mesoporous structure of CE/SnS2 composite. The BET surface area of CE/SnS2 composite was measured to be 23.1462 m2 g−1, which is larger than the value of pristine SnS2 nanoflowers (14.4730 m2 g−1, shown in Table 1). Both pristine SnS2 and CE/SnS2 composite exhibit a multi-modal mesoporous nature (BJH analysis, the inset of Fig. 14). The small pores presumably arise from the nanopetals, whereas the large pores may be attributed to the inter-nanopetals spaces. Compared with the pristine SnS2, the enhanced specific surface area of the composite can enlarge the inner space for absorption or desorption of degradation pollutant, which enhance greatly photocatalytic efficiency of the composite.
3.3 Photocatalytic performance of the CE/SnS2 composite
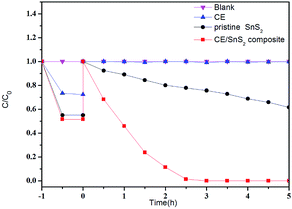
The photocatalytic degradation of rhodamine B (RhB) under visible light irradiation was used to evaluate the photocatalytic performances of CE/SnS2 composite. As a comparison, pristine SnS2 or CE was also tested under identical conditions. The blank test shows that RhB cannot be degraded under visible light irradiation without catalysts, indicating that the RhB are stable molecules and the photolysis can be ignored. It can be seen from the Fig. 15 that the adsorption–desorption equilibrium of RhB on the catalyst or cellulose surfaces have been almost achieved in 60 min before visible-light irradiation. The influence of pollutant adsorption on the photocatalysts can be largely neglected in the photocatalytic process by using the pollutant concentration after the adsorption–desorption equilibrium as the original concentration (C0) for the degradation rates measurements.As shown in Fig. 16, almost no RhB degradation is observed in the presence of CE. In comparison, both of adsorptive ratios and degradation rates are remarkably enhanced when pristine SnS2 and CE/SnS2 are used as the photocatalysts. The degradation rate of RhB is 66.2% after 300 min irradiation, while this value reached almost 100% for the CE/SnS2 composite after 150 min. The results indicate clearly that the introduction of CE can enhance the photocatalytic performance of SnS2.
To find out the reason for enhanced visible light photocatalytic activity of CE/SnS2 composite, the UV-vis DRS was used to determine the band gap energy of the synthesized samples (Fig. 17). Compared to pristine SnS2, CE/SnS2 composite shows an increased optical absorbance in both UV and visible range. The composite can allow multiple scattering of UV-vis light, suggesting that the optical path length for light transporting through those CE/SnS2 composite structures might be longer than that for pristine SnS2. The longer optical path length can increase the quantity of photogenerated electrons and holes available to participate in the photocatalytic decomposition of the contaminants. The band gap of pristine SnS2 was evaluated to be 1.80 eV, whereas the band-gap of CE/SnS2 composite was reduced to 1.69 eV, which could be attributed to the chemical bonding between SnS2 and the specific sites of CE. The narrower band gap of CE/SnS2 composite indicates the enhanced ability to absorb visible light, which is beneficial to the photocatalytic performance.
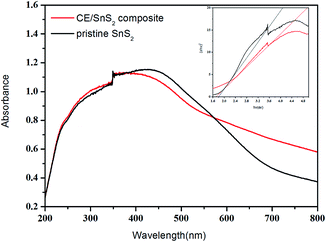 | ||
| Fig. 17 UV-vis solid absorption spectra and the corresponding band gap values (inset) of CE/SnS2 composites. | ||
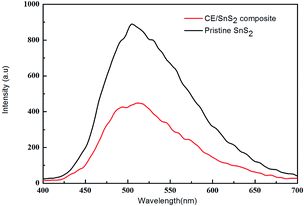
The migration, transfer and recombination processes of photo-generated electron–hole pairs in CE/SnS2 composite was investigated via photoluminescence (PL) technique. As shown in Fig. 18, pristine SnS2 has a strong, wide peak in the PL spectrum excited at 365 nm, while the PL peak of the CE/SnS2 composite decreases remarkably, which indicates that the recombination of electrons and holes is hindered greatly. Photocurrents were measured for pristine SnS2 and CE/SnS2 composite to investigate the transmission of photogenerated carriers (Fig. 19). Under visible light irradiation, the photocurrents of CE/SnS2 composite are much higher than that of pristine SnS2, indicating the enhanced separation and transition of electrons and holes. Moreover, it is generally accepted that the catalytic process is related to the adsorption of reactant molecules on the surface of catalyst.43,44 The larger specific surface area of composite can result in a more unsaturated surface coordination sites exposed to the solution and enlarge the absorption of reactant molecules, thus enhancing the photocatalytic efficiency. Additionally, the high surface-to-volume ratios of the CE/SnS2 composite are in favor of the transfer of electrons and holes45,46 and facilitate the degradation of pollution molecules.
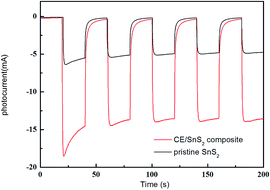 | ||
| Fig. 19 Transient photocurrent responses of pristine SnS2 and CE/SnS2 composite under visible light. | ||
3.4 Stability of the CE/SnS2 composite
The stability and reusability of photocatalysts is another important issue for their practical applications. Therefore, the circulating runs in the photocatalytic degradation of RhB in the presence of SnS2 under visible-light were checked. In this work, SnS2 was recycled for four times in the same photocatalytic reactions. After each reuse cycle which lasted for 3 h, the composite was separated from the aqueous suspension by filtration, washed with deionized water and ethanol, dried, and weighed for the next reuse cycle. Taking into account the mass loss of composite during each reuse cycle, the former reuse cycle must be conducted twice in order to accumulate enough samples for the latter reuse cycle. Fig. 20 shows the photocatalytic performance of CE/SnS2 composite in the first four reuse cycles. Obviously, the photocatalytic activities of CE/SnS2 composite deteriorated gradually with the increase in the number of reuse cycles. Nevertheless, even in the fourth reuse cycle of CE/SnS2, the degradation ratio of RhB can still reach 87.6% upon visible light irradiation for 180 min.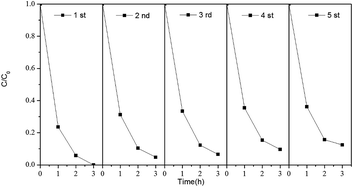 | ||
| Fig. 20 Cycling runs for the photocatalytic degradation of RhB by CE/SnS2 composite under visible light irradiation. | ||
4 Conclusions
In summary, a novel CE/SnS2 composite was successfully synthesized by a one-step microwave-assisted ionic liquid method using SnCl4·5H2O, thioacetamide and CE as starting materials. The proposed method has the advantages of fast and simple process. The morphology variations of the as-synthesized SnS2 were achieved by simply varying the types of ILs in the system. The obtained CE/SnS2 composite exhibits higher photocatalytic activity than that of pristine SnS2 on the degradation of RhB under visible light irradiation. The enhanced photocatalytic activities of CE/SnS2 composite can be ascribed to their increase optical absorbance in the available light energy region, higher BET surface area and efficient rate of separation and transporting of the photogenerated electrons and holes in the CE/SnS2 composite. The resulting high visible light-driven photocatalytic activity and good stability of CE/SnS2 composite are very promising photocatalysts for degrading organic pollutants and the present method may open up the opportunity to design and synthesize other novel semiconductor materials with special properties.Acknowledgements
This research was supported by National Natural Science Foundation of China (No. 21577018, No. 2140070158), the Science and Technology Project of Fujian Province Educational Department (No. JZ160416), Natural Science Foundation of Fujian Province, China (No. 2015J01049), the Independent Research Project of State Key Laboratory of Photocatalysis on Energy and Environment, China (No. 2014C02).References
- H. Choi, A. C. Sofranko and D. D. Dionysiou, Adv. Funct. Mater., 2006, 16, 1067–1074 CrossRef CAS.
- M. D. Hernandez-Alonso, F. Fresno, S. Suarez and J. M. Coronado, Energy Environ. Sci., 2009, 2, 1231–1257 CAS.
- S. G. Kumar and L. G. Devi, J. Phys. Chem. A, 2011, 115, 13211–13241 CrossRef CAS PubMed.
- H. Liu, W. R. Cao, Y. Su, Y. Wang and X. H. Wang, Appl. Catal., B, 2012, 111–112, 271–279 CrossRef CAS.
- Y. C. Zhang, Z. N. Du, S. Y. Li and M. Zhang, Appl. Catal., B, 2010, 95, 153–159 CrossRef CAS.
- J. Li, T. Wang and X. Du, Sep. Purif. Technol., 2012, 101, 11–17 CrossRef CAS.
- R. Lucena, F. Fresno and J. C. Conesa, Appl. Catal., A, 2012, 415, 111–117 CrossRef.
- J. T. Zai, X. F. Qian, K. X. Wang, C. Yu, L. Q. Tao, Y. L. Xiao and J. S. Chen, CrystEngComm, 2012, 14, 5627–5633 RSC.
- H. Tong, Y. J. Zhu, L. X. Yang, L. Li and L. Zhang, Angew. Chem., Int. Ed., 2006, 45, 7739–7742 CrossRef CAS PubMed.
- C. Pacholski, A. Kornowski and H. Weller, Angew. Chem., Int. Ed., 2002, 41, 1188–1191 CrossRef CAS PubMed.
- Z. Y. Tang, N. A. Kotow and M. Giersig, Science, 2002, 297, 237–240 CrossRef CAS PubMed.
- A. Kudo and S. Hijii, Chem. Lett., 1999, 10, 1103–1104 CrossRef.
- H. S. Kim, Y. H. Chung, S. H. Kang and Y. E. Sung, Electrochim. Acta, 2009, 54, 3606–3610 CrossRef CAS.
- X. Liu and H. Bai, Powder Technol., 2013, 237, 610–615 CrossRef CAS.
- P. Balaz, T. Ohtani, Z. Bastl and E. Boldizarova, J. Alloys Compd., 2002, 337, 76–82 CrossRef CAS.
- S. Y. Hong, R. Popovitz-Biro, Y. Prior and R. Tenne, J. Am. Chem. Soc., 2003, 125, 10470–10474 CrossRef CAS PubMed.
- A. Yella, E. Mugnaioli, H. A. Therese, M. Panthofer, U. Kolb and W. Tremel, Angew. Chem., Int. Ed., 2009, 48, 6426–6430 CrossRef CAS PubMed.
- T. T. Huong, L. T. Vinh, H. T. Phuong, H. T. Khuyen, T. K. Anh, V. D. Tu and L. Q. Minh, J. Lumin., 2016, 173, 89–93 CrossRef CAS.
- H. T. Hu, X. B. Wang, F. M. Liu, J. C. Wang and C. H. Xu, Synth. Met., 2011, 161, 404–410 CrossRef CAS.
- Y. Chen, W. Li, J. Y. Wang, Y. Gan, L. Liu and M. Ju, Appl. Catal., B, 2016, 191, 94–105 CrossRef CAS.
- P. Giesz, G. Celichowski, D. Puchowicz, I. Kaminska, J. Grobelny, D. Batory and M. Cieslak, Cellulose, 2016, 23, 2143–2159 CrossRef CAS.
- D. W. Synnott, M. K. Seery, S. J. Hinder, J. Colreavy and S. C. Pillai, Nanotechnology, 2013, 24, 045704 CrossRef PubMed.
- J. A. Dahl, B. L. S. Maddux and J. E. Hutchison, Chem. Rev., 2007, 107, 2228–2269 CrossRef CAS PubMed.
- M. Antonietti, D. Kuang, B. Smarsly and Y. Zhou, Angew. Chem., Int. Ed., 2004, 43, 4988–4992 CrossRef CAS PubMed.
- K. L. Ding, Z. J. Miao, Z. M. Liu, Z. F. Zhang, B. X. Han, G. M. An, S. D. Miao and Y. Xie, J. Am. Chem. Soc., 2007, 129, 6362–6363 CrossRef CAS PubMed.
- E. Kowsari and G. Faraghi, Mater. Res. Bull., 2010, 45, 939 CrossRef CAS.
- W. W. Wang and Y. J. Zhu, Cryst. Growth Des., 2005, 5, 505 CAS.
- M. Sabbaghan, J. Beheshtian and S. A. M. Mirsaeidi, Ceram. Int., 2014, 40, 7769–7774 CrossRef CAS.
- A. Taubert and Z. Li, Dalton Trans., 2007, 7, 723–727 RSC.
- Y. Chen, W. Z. Li, J. Y. Wang, Y. L. Gan, L. Liu and M. T. Ju, Appl. Catal., B, 2016, 191, 94–105 CrossRef CAS.
- J. Di, J. X. Xia, S. Yin, H. Xu, M. Q. He, H. M. Li, L. Xu and Y. P. Jiang, RSC Adv., 2013, 3, 19624–19631 RSC.
- H. Zhang, J. Wu, J. Zhang and J. He, Macromolecules, 2005, 38, 8272 CrossRef CAS.
- D. V. Bavykin, V. N. Parmon, A. A. Lapkin and F. C. Walsh, J. Mater. Chem., 2004, 14, 3370–3377 RSC.
- U. G. Akpan and B. H. Hameed, J. Hazard. Mater., 2009, 170, 520–529 CrossRef CAS PubMed.
- C. Chang, L. Y. Zhu, Y. Fu and X. L. Chu, Chem. Eng. J., 2013, 233, 305–314 CrossRef CAS.
- G. Cheng, J. Y. Xiong, F. J. S. Tadler and J. Florian, New J. Chem., 2013, 37, 3207–3213 RSC.
- S. X. Weng, B. B. Chen, L. Y. Xie, Z. Y. Zheng and P. Liu, J. Mater. Chem. A, 2013, 1, 3068–3075 CAS.
- Y. Jiang and Y. J. Zhu, J. Phys. Chem. B, 2005, 109, 4361–4364 CrossRef CAS PubMed.
- X. Liu, J. Ma and W. Zheng, Rev. Adv. Mater. Sci., 2011, 27, 43–51 CAS.
- C. A. Formstone, E. T. Fitzgerald, P. A. Cox and D. Ohare, Inorg. Chem., 1990, 29, 3860–3866 CrossRef CAS.
- Y. C. Zhang, Z. N. Du, K. W. Li and M. Zhang, Sep. Purif. Technol., 2011, 81, 101–107 CrossRef CAS.
- Y. Lei, S. Song, W. Fan, Y. Xing and H. Zhang, J. Phys. Chem. C, 2009, 113, 1280–1285 CAS.
- D. Ma, S. Huang, W. Chen, S. Hu, F. Shi and K. Fan, J. Phys. Chem. C, 2009, 113, 4369–4374 CAS.
- X. Xiao and W. D. Zhang, RSC Adv., 2011, 1, 1099–1105 RSC.
- L. P. Zhu, G. H. Liao, N. C. Bing, L. L. Wang, Y. Yang and H. Y. Xie, CrystEngComm, 2010, 12, 3791–3796 RSC.
- X. Xiao and W. D. Zhang, J. Mater. Chem., 2010, 20, 5866–5870 RSC.
| This journal is © The Royal Society of Chemistry 2017 |


