 Open Access Article
Creative Commons Attribution 3.0 Unported Licence
Understanding the chemical state of palladium during the direct NO decomposition – influence of pretreatment environment and reaction temperature†
Gunugunuri K. Reddy *,
Chen Ling*,
Torin C. Peck and
Hongfei Jia
Material Research Department, Toyota Research Institute of North America, Ann arbor MI – 48105, USA. E-mail: krishna.gunugunuri@toyota.com; Chen.Ling@toyota.com
First published on 3rd April 2017
Abstract
Direct decomposition of NO into N2 and O2 offers an ideal solution to the abatement of NO from automotive and various combustion processes. Although its decomposition is thermodynamically favorable (ΔG = −86.6 kJ mol−1 at 25 °C), yet kinetically hindered due to a high activation barrier of 335 kJ mol−1, making use of catalyst indispensable. Supported Pd catalysts have been investigated recently for the reaction ranging from 300 °C to 1000 °C. However, the function of palladium during the reaction at various reaction temperatures is still unclear. SiO2 supported palladium was studied as a model catalyst system for direct NO decomposition over temperatures ranging from 100 to 800 °C both in dynamic and steady state mode to understand the changes in the palladium chemical state with respect to the reaction temperature. Three different types of catalyst compositions of palladium namely Pd, PdO and mixture of Pd–PdO, were created on silica surface by controlling pretreatment environments for systematic comparison. Combining characterization and catalytic performance, it has been revealed that the reaction in the lower temperature region (<500 °C), is not catalytic and NO chemically reacts with metallic Pd and forms PdO. The oxidation ability of metallic Pd is sensitive to the particle size of the metallic Pd. The catalyst pretreated in helium yields Pd–PdO composite structure and higher active metallic surface area compared to the hydrogen pretreated catalyst and exhibited higher NO conversion at lower reaction temperatures (<500 °C). At temperatures higher than 500 °C the PdO converts to metallic Pd by releasing oxygen, resulting in stable direct NO activity. Our results suggest retarding metallic Pd oxidation is key factor to develop a sustainable catalyst for direct NO decomposition at lower temperatures.
1. Introduction
The increase of the worldwide population has led to an increase of the energy demand and an increase of environmental pollution. Among the various pollutant gases, nitrogen oxides are considered as one of the primary pollutants of the atmosphere, since they are responsible for environmental problems like photochemical smog, acid rain, tropospheric ozone, ozone layer depletion and global warming.1,2 The laws on NO emissions are increasingly strict and the research of NO abatement remains a hot topic.3 The current techniques used for the abatement of NO such as selective catalytic reduction (SCR) and non-selective catalytic reduction (NSCR) and NO storage-reduction (NSR) all rely on introducing reducing agents such as ammonia, diesel soot, carbon monoxide or hydrocarbons4–8 to drive the reduction of NO into N2.9,10 An alternative solution for NO removal is the direct NO decomposition into harmless N2 and O2, which in principle is ideal method for the solution of NO problem.NO is a thermodynamically unstable molecule and its decomposition into elements is favored at temperatures below 1000 °C,11 however, the direct decomposition is kinetically hindered due to a high activation barrier of 335 kJ mol−1.11 Consequently, catalysts that help lower the kinetic barrier is essential to achieve efficient direct NO decomposition. Catalysts that have been reported to be active in the decomposition of NO can be divided into three major groups: metal oxides, zeolites, and supported metals.12 Among various direct NO catalysts, perovskites exhibit very good activity at temperatures higher than 600 °C.13 Recent development of rare earth and Y–Zr solid solutions and C-type rare earth oxides has marked the activity in the appropriate range for high temperature applications.14 Although, at lower temperatures zeolites such as Cu/ZSM-5 shows the attractive activity, however, the activity is seriously inhibited by the presence of oxygen and SO2.15
Despite the achievements made for direct NO decomposition at high temperatures, the development of a catalyst that works at low temperatures, which is particularly attractive for automobile emission control, has received less attention. For instance, the performance of supported noble metal catalyst, which is the commercialized component of three-way catalyst, was only addressed in a few reports for direct NO decomposition.16–30 Pt based catalysts were investigated in early 20th century and found out that the catalysts deactivates quickly at lower temperatures.16–19 Recently, studies have been focused on investigating palladium based catalysts for direct NO decomposition because of its better thermal stability and low cost compared to Pt based catalysts.20–30 Most of the reports concentrated on the performance of supported palladium catalyst in direct NO decomposition at various reaction temperatures (from 300 °C to 900 °C).20–30 However, a very deep understanding about the function and chemical state of the palladium during direct NO decomposition at different reaction temperatures has not been attained. For example, Baibich group26–29 evaluated several supported and bimetallic Pd catalysts for direct NO decomposition and reported that metallic Pd catalysts deactivate with time irrespective of support and foreign metal. On the other hand, Naito et al.30 reported that metallic Pd supported on SiO2 catalyst exhibits a stable NO conversion after forming few oxygen layers on the surface. However, no effort has been made on investigating chemical state of palladium during and after the direct NO decomposition in both cases. The lack of such fundamental knowledge consequently prevents any further development or optimization. As we already know that, in three-way catalysis (TWC) the performance of the catalyst depends on the chemical state of the Pd during the reaction.31 There are several possibilities which need to be considered. Either metallic Pd or PdO is the active species or both are active species for direct NO decomposition. There may be possibility that PdO reduced to Pd metal and re-oxidizes to PdO in the cyclic manner. The active species may also be different at different reaction temperatures.
In the current report we present the systematic study about the mechanism of Pd catalyzed direct NO decomposition. Through analyzing the several palladium compositions, we show unambiguous evidence that the only active species for direct NO decomposition is metallic Pd. It is in sharp contrast with three-way catalyst where both metallic Pd and PdO are considered to be active. In addition, our study provides the first mechanistic understanding about direct NO decomposition at low temperatures, hence paving the road towards the development of more efficient catalyst in future.
2. Experimental
2.1. Catalyst preparation
Palladium-based catalyst supported on silica was synthesized using wet impregnation method. Before the synthesis, the silica (Cab-O-Sil EH-5 fumed silica) was treated with water at 100 °C to generate hydroxyl groups on the surface. In a typical synthesis procedure, 5 g of silica was mixed with 50 mL of water. Then the required quantity of palladium nitrate was dissolved separately in deionized water and combined with the SiO2 suspension. The mixture was heated to 80 °C with continuous stirring. The powder obtained was then dried in an oven at 120 °C for 12 h under air. Finally, the catalyst was calcined at 450 °C for 3 h with a 1 °C min−1 ramp.2.2. Catalyst characterization
2.3. Direct NO decomposition measurements
The direct NO decomposition measurements were performed at atmospheric pressure in a continuous flow fixed bed quartz reactor. The 300 mg of as-synthesized catalyst was placed in the reactor in between two glass wool plugs. All the gas flows were measured and calibrated using a digital flow meter. The reactor was heated externally via a tubular furnace regulated by a temperature controller, with a thermocouple inserted into the catalyst bed. The measurements were performed using ∼1% NO balance helium with a gas hourly space velocity of 2100 h−1 and in the temperature region of 100 °C–800 °C. Prior to the reaction, catalysts were pretreated in different environments (O2 – 450 °C, He – 800 °C, H2 – 800 °C) to investigate the effect of pretreatment environment on the activity. After the pretreatment, the bed temperature was decreased to 100 °C and direct NO decomposition measurements were collected. The reactant and product concentrations were measured using Cirrus 2 quadrupole mass spectrometer. The Ar present in the reactant stream acted as tracer of constant concentration and the Ar signal at m/z = 40 was used to normalize each of the mass spectrum traces. The 100% and 0% conversion of NO was defined as the normalized mass spectrum intensity at m/z = 30 under inert flow only, and in the presence of the NO bypassing the reactor, respectively.3. Results and discussion
3.1. Characterization
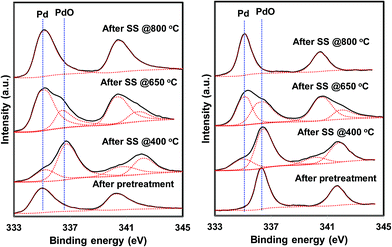
5 wt% Pd on SiO2 support was synthesized using wet impregnation method. After the synthesis, the catalyst was pretreated in various environments in order to create different chemical states of palladium. As expected, the catalyst pretreated with oxygen was primarily composed of oxidized phase (PdO) while the hydrogen pretreatment generated metallic Pd, as evidenced by XRD and XPS measurements (Fig. 1 and 2). Interestingly, catalyst pretreated in inert He environment exhibited XRD peaks corresponding to both PdO and Pd, while XPS only showed peaks due to PdO.35 The discrepancy between XRD and XPS can be attributed to the different penetration depth of light source employed in these two techniques. While XRD is able to detect the information of the bulk phase, XPS is usually regarded as a surface technique and provides information only related to surface species. To get the bulk information using XPS, the catalyst was pre-sputtered after the hydrogen and helium pretreatment in the XPS chamber and Pd 3d spectra was measured. The Pd 3d XPS profiles after the sputtering are presented in Fig. 3. There is not much change in the Pd 3d spectra after the sputtering for the hydrogen pretreated catalyst. The catalyst exhibits peaks mainly due to Pd metal. On the other hand, the Pd 3d XPS profile of the helium pretreated catalyst is different after the sputtering. The catalyst after the sputtering exhibits peaks due to both PdO and Pd. Hence, both XRD and Pd 3d XPS results show that there is a formation of PdO–Pd composite after the helium pretreatment where PdO is likely distributed primarily on the surface layer.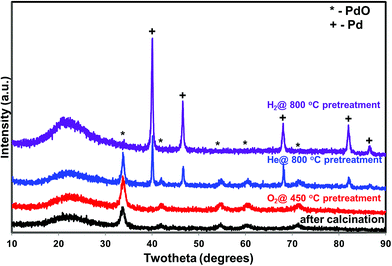 | ||
| Fig. 1 X-ray diffraction of the PdO/SiO2 catalyst after the calcination and after various pretreatments (O2 – 450, He – 800, H2 – 800 °C). | ||
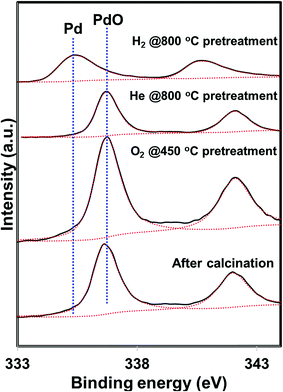 | ||
| Fig. 2 Pd 3d XPS profiles of the PdO/SiO2 catalyst after the calcination and after various pretreatments (O2 – 450, He – 800, H2 – 800 °C). | ||
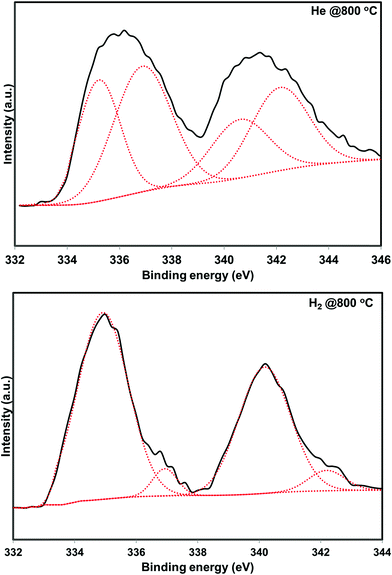 | ||
| Fig. 3 Pd 3d X-ray photo electron profiles of the He – 800 °C, and H2 – 800 °C pretreated PdO/SiO2 catalysts after pre sputtering. | ||
3.2. Dynamic direct NO decomposition
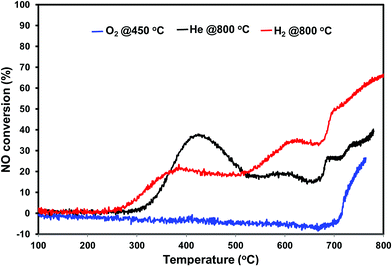
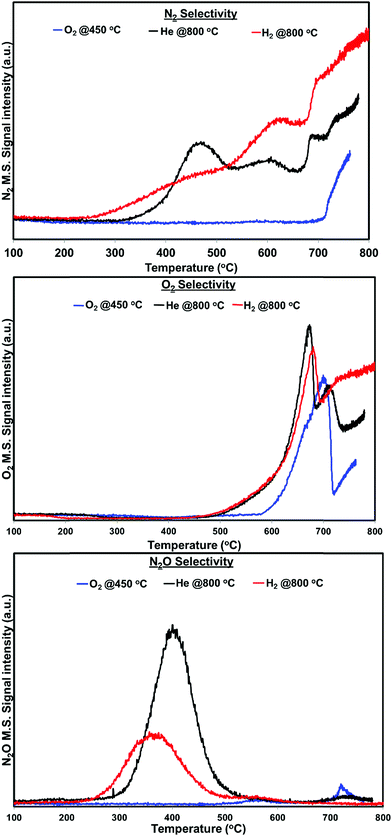
The direct NO decomposition was first performed in a dynamic reaction mode by ramping the temperature from 100–800 °C to evaluate the catalyst performance in the broad temperature region. A blank experiment was performed initially with quartz wool and silica sand in the temperature region 100 to 800 °C. No activity was observed during the blank experiment. The dynamic direct NO decomposition profiles of the various pretreated PdO/SiO2 catalysts with respect to the temperature are presented in Fig. 4. The product distribution profiles are presented in Fig. 5. As shown in Fig. 4, the oxygen pretreated catalyst exhibited NO conversion only after 700 °C and the conversion increased with reaction temperature afterwards. The product distribution profiles show that the catalyst first released oxygen in the temperature region 580 °C–700 °C without detecting the formation of N2 or N2O. After oxygen signal dropped to base line, the NO conversion started and exhibited N2 and O2 as products. In addition, small amount of N2O formation was observed at 700 °C and terminated at 720 °C. The N2 formation started from 725 °C and increased with increasing reaction temperature.The NO conversion profiles of helium and hydrogen pretreated catalysts are different compared to the oxygen pretreated catalyst. As we can see from Fig. 4, the NO conversion started at 250 °C for hydrogen pretreated sample and increases with increasing reaction temperature until 380 °C. Similarly, the NO conversion for helium pretreated sample started at 300 °C and increased with increasing reaction temperature until 420 °C. Then both samples exhibited a decrease in the NO conversion with reaction temperature up to 520 °C. After 520 °C, both catalysts exhibited a slight increase in the NO conversion followed by a slight decrease in the NO conversion up to 670 °C. After 670 °C, the NO conversion increases with reaction temperature for both catalysts. The helium pretreated catalyst exhibit higher NO conversion at lower reaction temperatures (<500 °C) and hydrogen pretreated catalyst exhibit higher NO conversion at higher reaction temperatures (>500 °C).
Fig. 4 shows the N2, N2O and O2 product distribution profiles during the dynamic NO decomposition with respect to reaction temperature. No NO2 formation was observed in the entire temperature region for any of the pretreated catalyst. As shown in Fig. 4, the products were different at lower (<500 °C) and higher reaction temperatures (>500 °C) for both helium and hydrogen pretreated catalysts. N2 and N2O were observed as products at lower temperatures, and formation of N2 and O2 were observed at higher temperatures. The N2O formation was started at 260 °C for hydrogen pretreated catalyst and reached maximum at 360 °C then terminated at 460 °C. Similarly, helium pretreated catalyst releases N2O from 300 °C reached maximum at 400 °C and terminated at 500 °C. The N2 formation was observed followed by the N2O formation and increases with increasing the reaction temperature for both the catalysts. O2 formation started at 500 °C, reached maximum at around 680 °C and went down with further increase in the temperature until 690 °C for both catalysts. After 690 °C, the oxygen signal increased with increasing reaction temperature up to 800 °C for hydrogen pretreated catalyst. However, for the helium pretreated catalyst, the oxygen signal increased slightly with increasing reaction temperature from 690 °C to 705 °C and decreased with further increase in the reaction temperature until 735 °C. After 735 °C the oxygen signal increased steadily with increasing reaction temperature up to 800 °C.
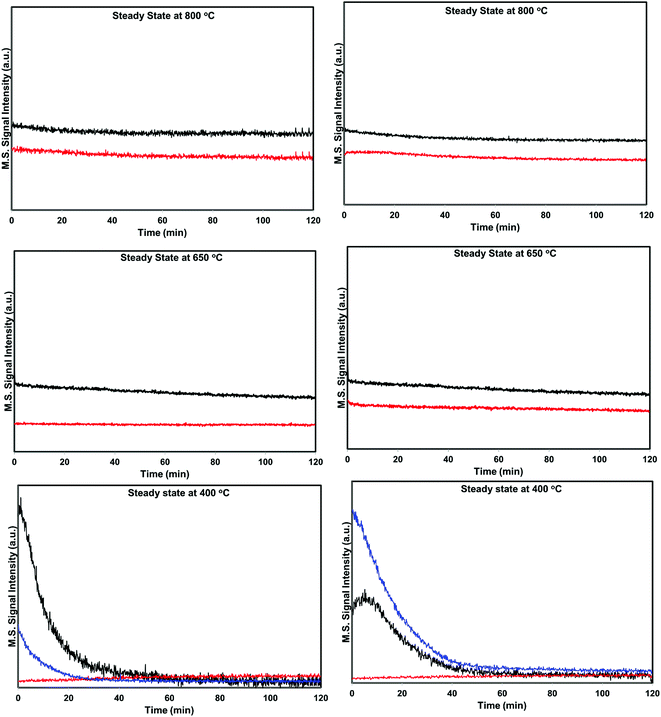
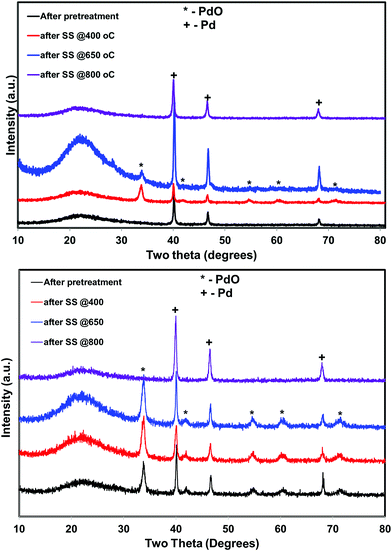
Based on the NO conversion and product distribution profiles of hydrogen and helium pretreated catalysts, the reaction was divided into three temperature regions i.e. low temperature (300–500 °C), medium temperature (500–700 °C), and high temperature (above 700 °C). Steady state catalytic measurements were performed at 400 °C, 650 °C and 800 °C over these catalysts to understand the catalyst behavior in the broad temperature region. The spent catalysts after the steady state measurements were analyzed using XRD and XPS to understand the function and chemical state of palladium during the direct NO decomposition at different reaction temperatures.
3.3. Steady state NO decomposition measurements
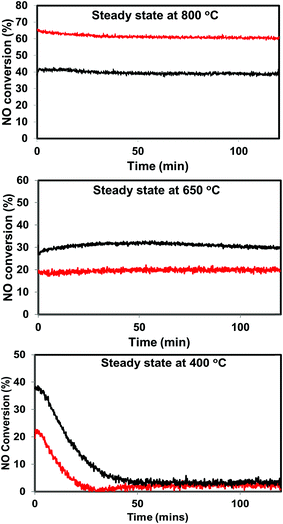 | ||
| Fig. 6 Steady state activity measurements over He – 800 °C, H2 – 800 °C pretreated PdO/SiO2 catalysts at 400 °C, 650 °C, and 800 °C (black: helium pretreated, red: hydrogen pretreated). | ||
3.4. Chemical state–activity relationship
The chemical state of Pd during the reaction was well defined in three-way catalysis (TWC) and the performance of the catalyst strongly depends on the chemical state of Pd in TWC.31 Different active Pd species like PdO, metallic Pd, pseudo metallic Pd (Pd(I)) were reported by different groups for three-way catalysis. Fernández-García et al.36 reported that presence of hydrocarbon and the support stabilizes the Pd species with average oxidation state as Pd(I) which retains a certain metallic-like character due to the existence of Pd–Pd bonds. Liu et al.37 described that the fresh catalyst with fully oxidized Pd is quickly reduced to the metallic Pd, and this Pd(0) species remains within the whole temperature range regardless of the air/fuel ratio. Iglesias-Juez et al.38 performed reaction under cycling conditions with 5% CO and 5% (NO + O2; 1![[thin space (1/6-em)]](https://www.rsc.org/images/entities/char_2009.gif) :
:![[thin space (1/6-em)]](https://www.rsc.org/images/entities/char_2009.gif) 4.5) gas mixtures and found that both Pd(0) and Pd(I) can be present upon the CO reducing step of the CO/(NO + O2) cycle, but it is strongly dependent on the loading and particle size of the Pd. In the review article by wang et al. stated that “Although the fully oxidized Pd can be the active phase for a fresh catalyst, the continuous existence of reduced Pd should be considered during the real working conditions because of the presence of CO and hydrocarbons in the three-way catalysis”.31
4.5) gas mixtures and found that both Pd(0) and Pd(I) can be present upon the CO reducing step of the CO/(NO + O2) cycle, but it is strongly dependent on the loading and particle size of the Pd. In the review article by wang et al. stated that “Although the fully oxidized Pd can be the active phase for a fresh catalyst, the continuous existence of reduced Pd should be considered during the real working conditions because of the presence of CO and hydrocarbons in the three-way catalysis”.31
The reaction conditions are different in the direct NO decomposition compared to the three-way catalysis. Here we have only one reactant NO without any reducing agent. The catalyst pretreated in O2 at 450 °C which has only PdO over the silica surface did not exhibit any activity until 700 °C. Also, the catalyst releases oxygen in the temperature region 580 °C to 720 °C first and then started to exhibit NO conversion. The PdO/SiO2 (O2 at 450 °C) spent catalyst after the dynamic direct NO decomposition contains mixture of PdO and Pd on silica surface. These results showed that during the oxygen release in the temperature region 580 °C to 720 °C, the PdO converted to metallic Pd and the direct NO decomposition activity observed after the 700 °C was mainly due to the metallic Pd. These observations show that only metallic Pd is the active component for direct NO decomposition and PdO is not active unlike TWC where both oxidized and metallic Pd are active components.31
The situation is different for helium and hydrogen pretreated catalysts where palladium composition is different before the reaction. The catalyst exhibits PdO–Pd composite structure after the helium pretreatment and metallic Pd particles after the hydrogen pretreatment. The dynamic NO conversion measurements show that both helium and hydrogen pretreated catalysts started to exhibit NO conversion around 250 °C–300 °C and the NO conversion increases with increasing reaction temperature up to 400 °C. The further increase in the reaction temperature up to 500 °C leads to a decrease in the NO conversion. The product distribution profiles show only N2 and N2O as products in this temperature region and no oxygen release was observed. The steady state time on stream measurements at 400 °C show that the NO conversion reaches to zero with in the first 20 min of the reaction irrespective of the pretreatment. X-ray diffraction patterns of the spent catalysts after the steady state at 400 °C show reflections due to the mixture of oxidized and metallic Pd. The Pd 3d XPS profiles show peaks mainly due to the oxidized Pd for both helium and hydrogen pretreated spent catalysts after the steady state at 400 °C. Hence, the activity and characterization measurements suggest that most of the surface metallic Pd oxidized to PdO during the steady state at 400 °C. The decrease in the NO conversion after some time, no oxygen release below 500 °C and formation of PdO after the steady state at 400 °C suggest that the NO decomposition in the lower temperature region (<500 °C) is a chemical reaction between metallic Pd and NO instead of catalytic decomposition on the surface of Pd/SiO2.
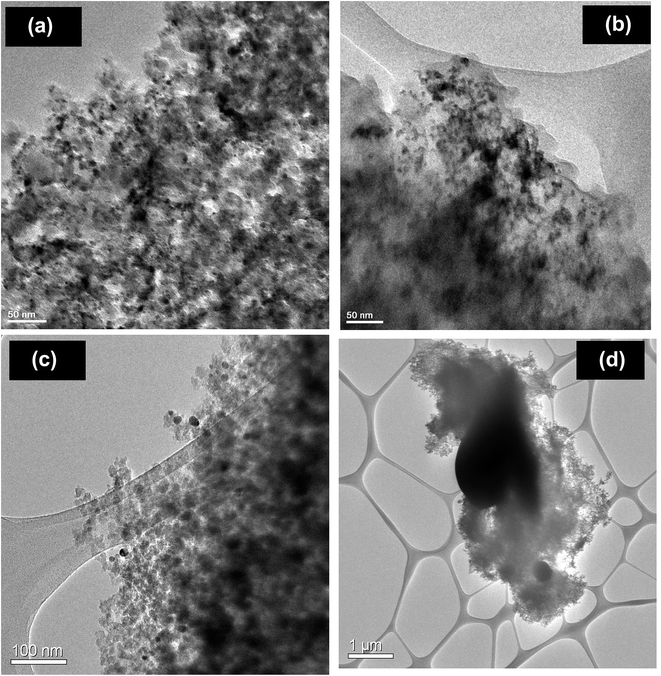
The characterization measurements show the 100% metallic Pd formation after the hydrogen pretreatment and PdO–Pd composite formation after the helium pretreatment. The above observation conforms that most of the NO conversion in the lower temperature region is due to the oxidation of metallic Pd to the PdO. However, helium pretreated catalyst exhibit higher NO conversion (40%) compared to the hydrogen pretreated catalyst (20%) in the lower temperature region. Additional characterization measurements were performed to understand the interesting behavior of helium pretreated catalyst. The morphology of the palladium particles was measured using transmission electron microscope (TEM) after the various pretreatments. The TEM images of the fresh and various pretreated PdO/SiO2 catalysts are presented in Fig. 10. As expected, the fresh catalyst after the calcination exhibit small spherical PdO particles (10–20 nm) over the silica surface. There is not much change in the morphology and particle size of PdO after the pretreatment in oxygen at 450 °C. On the other hand, agglomeration of Pd metal particles was observed after the hydrogen pretreatment and the Pd metal particles are more than 1 μm in size. Interestingly, the catalyst exhibit particle sizes between 50–150 nm after the helium pretreatment. The crystallite sizes of PdO and metallic Pd after various pretreatment were also measured using Debye–Scherrer equation33 from the X-ray diffraction patterns and presented in Table 1. In accordance with the TEM measurements, the crystallite size of metallic Pd is much higher after the hydrogen pretreatment compared to the helium pretreatment.
| Treatment | Crystallite sizea (nm) | Particle sizeb | Active metallic surface areac (m2 g−1 metal) | Active particle diameterc (nm) | |
|---|---|---|---|---|---|
| PdO | Pd | ||||
| a Determined from Debye–Scherrer equation.b Determined from TEM images.c Determined from CO pulse chemisorption. | |||||
| Fresh | 8.9 | — | 0 | 0 | |
| O2 – 450 °C | 9.2 | — | 0 | 0 | |
| He – 800 °C | 13.5 | 34 | 50–150 nm | 6.84 | 78 nm |
| H2 – 800 °C | — | 50 | ∼1 μm | 2.3 | 216 nm |
To complement the particle size measurements, active particle diameter and active metallic surface of metallic Pd particles were measured using CO pulse chemisorption experiment (Table 1). As explained in experimental section, slightly different method was adopted in the present study. The pulse CO chemisorption experiments were performed after the various pretreatments. As expected, both fresh and oxygen pretreated catalysts did not consume any CO during the pulse experiment. As shown in Table 1, the catalyst after the helium pretreatment exhibits three times higher metallic surface area compared to the hydrogen pretreated catalyst. Both particle size and pulse chemisorption experiments show that formation of PdO–Pd composite resist the sintering of metallic Pd particles during the helium pretreatment and yield higher active metallic surface area compared to the hydrogen pretreated catalyst and exhibit higher NO conversion in the lower reaction temperature region (>500 °C).
To further confirm the sintering phenomena, the PdO/SiO2 was pretreated at 300 °C in the presence of hydrogen and performed direct NO decomposition. The dynamic NO decomposition profiles of the He – 800 °C, H2 – 800 °C and H2 – 300 °C catalysts are presented in Fig. 11. The catalysts pretreated at 300 °C exhibits higher NO conversion compared to the catalyst pretreated at 800 °C in the lower temperature region (<500 °C). TEM measurements suggest that the catalyst pretreated at 300 °C exhibit lesser metallic Pd particle size compared to the catalyst pretreated at 800 °C (not shown). On the whole activity and characterization measurements show that the NO decomposition activity over PdO/SiO2 catalyst at lower reaction temperature (<500 °C) is mainly due to the oxidation of metallic Pd to PdO and the activity is sensitive to the metallic Pd particle size.
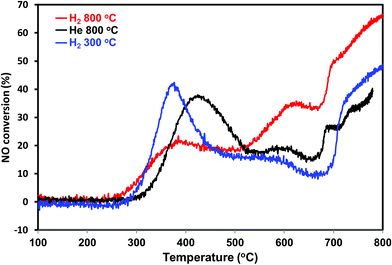 | ||
| Fig. 11 NO conversion profiles of PdO/SiO2 catalyst after He – 800 °C, H2 – 300 °C, H2 – 800 °C pretreatments in the temperature region 100–800 °C (GHSV – 2100 h−1, 2% NO in helium). | ||
As explained above, most of the surface metallic Pd oxidized to PdO during NO decomposition at low temperature (<500 °C) for both helium and hydrogen pretreated catalysts. The dynamic product distribution measurements show that both helium and hydrogen pretreated catalysts releases oxygen between 500 °C and 700 °C like oxygen pretreated catalyst. The oxygen release is due to the formation of metallic Pd from PdO formed during the low temperature reaction. The reduction of PdO to metallic Pd occurred in one stage for hydrogen pretreated catalyst and two stages for helium pretreated catalyst. This may be due to the presence of two types PdO in the helium pretreated catalyst (PdO in the PdO–Pd composite structure and PdO formed from oxidation of metallic Pd to PdO during the low temperature direct NO decomposition).
The steady state activity measurements at 650 °C show that both helium and hydrogen pretreated catalysts exhibit stable NO conversion for 2 hours with both N2 and O2 as products. The XRD and Pd 3d X-ray photo electron spectra of exhibit peaks due to both PdO and metallic Pd after the steady state at 650 °C. These results show PdO releases oxygen and convert to metallic Pd after 500 °C and the NO conversion in this temperature region is mainly due to the Pd–PdO oxidation–reduction cycle. The Pd metal reacts with NO and forms PdO and then PdO release oxygen and convert to Pd metal.
The dynamic NO conversion profiles show that all the PdO converted to metallic Pd by 700 °C for the hydrogen pretreated catalyst, whereas it extended to 750 °C for the helium pretreated catalyst. Steady state measurements at 800 °C exhibit a stable NO conversion with N2 and O2 as products. The XRD and Pd 3d XPS profiles exhibit presence of only metallic Pd after the steady state at 800 °C. These results show that NO directly decomposes into N2 and O2 on metallic Pd surface in this temperature region without any oxidation. The complete reaction mechanism in a broad temperature region (100–800 °C) over both helium and hydrogen pretreated catalyst in presented in Scheme 1.
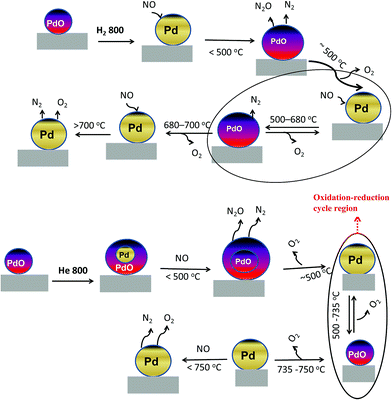 | ||
| Scheme 1 Mechanism of the direct NO decomposition over PdO/SiO2 catalysts in low, medium and high temperature regions over hydrogen and helium pretreated catalysts. | ||
Iglesias-Juez et al.38 reported that the performance and chemical state of Pd strongly depends on the Pd loading in TWC. They observed different chemical states for different loading of Pd on alumina support. The influence of Pd loading on the oxygen release temperature of PdO/SiO2 has been investigated. For this purpose, 0.5, 1 and 3 wt% of palladium was deposited over silica support and compared with 5 wt% PdO/SiO2 catalyst. The oxygen product distribution profiles of the various Pd loaded SiO2 catalysts are presented in Fig. 12. The samples were pretreated in the presence of hydrogen at 300 °C before the reaction. All the samples exhibit oxidation of metallic Pd to PdO irrespective of Pd loading in the lower reaction temperature region. Interestingly, there is not much change in the PdO to metallic Pd reduction temperature with changing Pd loading (Fig. 12). The oxygen signal intensity increases with increasing Pd loading. This is due to higher amount of metallic Pd oxidation to PdO in the lower reaction temperature region.
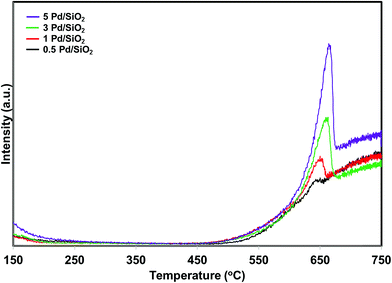 | ||
| Fig. 12 O2 product release profiles of the PdO/SiO2 catalysts with different PdO loadings during direct NO decomposition. | ||
Our study shows that the mechanism of the direct NO decomposition is different than the three-way catalysis. In three-way catalysis both PdO and metallic Pd are active components for the reaction. Only metallic Pd is active for the direct NO decomposition. In three-way catalysis the chemical state of palladium (Pd(II) or Pd(I) or metallic Pd) depends on the several factors like support, Pd loading, particle size, synthesis method, promoter etc. In direct NO decomposition the chemical state of palladium strongly depends on the reaction temperature. Irrespective of pretreatment, and palladium loading most of the metallic Pd oxidized to PdO during the direct NO decomposition in the lower reaction temperature region (<500 °C). The oxidized Pd releases oxygen after 500 °C and converted to metallic Pd. These results show that the techniques developed for three-way catalysis not necessarily work for direct NO decomposition and completely different approach needed to develop a Pd-based catalyst for direct NO decomposition in the lower reaction temperature region (<500 °C).
4. Conclusions
Influence of pretreatment and reaction temperature on the mechanism of the direct NO decomposition has been investigated over PdO/SiO2 model system. Our activity and characterization measurements suggest that the mechanism of the NO decomposition is completely different at lower, medium and higher reaction temperatures. At lower reaction temperatures (<500 °C) the activity is mainly due to the oxidation of the Pd metal to PdO and the oxidation ability of Pd metal depends on the particle size and active metallic surface area. The Pd–PdO composite formation occurs during the helium pretreatment and resists the sintering of Pd metal and leads to the higher NO conversion at lower reaction temperatures compared to the hydrogen pretreated catalyst. Irrespective of pretreatment and loading, supported palladium catalysts release oxygen after 500 °C due to the reduction of the PdO to Pd metal. Then, the simultaneous oxidation–reduction cycle occurs in the medium temperature region (500–680 °C) and mainly responsible for the NO conversion in this region. PdO completely reduces to Pd metal after 700 °C for hydrogen pretreated catalyst and after 750 °C for helium pretreated catalyst and NO directly decomposes into N2 and O2 on the Pd metal surface and no further oxidation of Pd metal occurs.Acknowledgements
Gunugunuri K. Reddy thank Michael jones from TRI-NA for assistance with the XPS measurements.Notes and references
- Z. Liu and S. L. Woo, Catal. Rev.: Sci. Eng., 2006, 48, 43 CAS.
- A. Fritz and V. Pitchon, Appl. Catal., B, 1997, 13, 1 CrossRef CAS.
- N. Imanaka and T. Masui, Appl. Catal., A, 2012, 431–432, 1–8 CrossRef CAS.
- D. Reichert, H. Bockhorn and S. Kureti, Appl. Catal., B, 2008, 80, 248–259 CrossRef CAS.
- T. Nakatsuji, T. Yamaguchi, N. Sato and H. Ohno, Appl. Catal., B, 2008, 85, 61–70 CrossRef CAS.
- C. He and K. Ko, Phys. Chem. Chem. Phys., 2006, 8, 898–905 RSC.
- J. D. A. Bellido and E. M. Assaf, Fuel, 2009, 88, 1673–1679 CrossRef CAS.
- E. A. Efthimiadis, S. C. Christoforou, A. A. Nikolopoulous and L. A. Vasalos, Appl. Catal., B, 1999, 22, 91–106 CrossRef CAS.
- Z.-S. Zhang, M. Crocker, B.-B. Chen, Z.-F. Bai, X.-K. Wang and C. Shi, Catal. Today, 2015, 256, 115–123 CrossRef CAS.
- S. S. C. Chuang and C.-D. Tan, J. Phys. Chem. B, 1997, 101, 3000–3004 CrossRef CAS.
- H. Beyer and K. Kohler, Appl. Catal., B, 2010, 96, 110–116 CrossRef CAS.
- A. Fritz and V. Pitchon, Appl. Catal., B, 1997, 13, 1–25 CrossRef CAS.
- J. Zhu and A. Thomas, Appl. Catal., B, 2009, 92, 225–233 CrossRef CAS.
- H. Masaki, T. Masui and N. Imanaka, J. Alloys Compd., 2008, 451, 406–409 CrossRef CAS.
- M. Iwamoto and H. Hamada, Catal. Today, 1991, 10, 57–71 CrossRef CAS.
- J. Zawadski and G. Pertinsky, Compt. Rendus Chem., 1934, 198, 260 Search PubMed.
- R. R. Sakaida, R. G. Rinker, Y. L. Wang and W. H. Corcoran, AIChE J., 1961, 7, 658–663 CrossRef CAS.
- M. Shelef, K. Otto and H. Gandhi, Atmos. Environ., 1969, 3, 107–122 CrossRef CAS PubMed.
- A. Amirnazmi, J. E. Benson and M. Boudart, J. Catal., 1973, 30, 55 CrossRef CAS.
- M. Iwamotoi and H. Hamada, Catal. Today, 1991, 10, 67–71 Search PubMed.
- Y. F. Y. Yao, J. Catal., 1984, 87, 152–162 CrossRef CAS.
- R. J. Wu, T. Y. Chou and C. T. Yeh, Appl. Catal., B, 1995, 6, 105–116 CrossRef CAS.
- A. Ogata, A. Obuchi, K. Mizuno, A. Ohi, H. Aoyama and H. Ohuchi, Appl. Catal., 1990, 65, L11–L15 CrossRef CAS.
- Y.-J. Huang, H. P. Wang, C.-T. Yeh, C. C. Tai and C. Y. Peng, Chemosphere, 1999, 39, 2279–2287 CrossRef CAS PubMed.
- M. Haneda, Y. Kintaichi, I. Nakamura, T. Fujitani and H. Hamada, Chem. Commun., 2002, 2816–2817 RSC.
- J. Peralta, E. V. Benvenutti, J. A. C. Ruiz, H. O. Pastore and I. M. Baibich, J. Mol. Catal. A: Chem., 2006, 246, 33–38 CrossRef.
- R. M. Dallagoa and I. M. Baibich, J. Braz. Chem. Soc., 2009, 20, 873–879 CrossRef.
- A. M. de Oliveira, I. M. Baibich, N. R. C. F. Machado, M. L. Mignoni and S. B. C. Pergher, Catal. Today, 2008, 133–135, 560–564 CrossRef.
- A. M. de Oliveira, L. E. Crizel, R. S. da Silveira, S. B. C. Pergher and I. M. Baibich, Catal. Commun., 2007, 8, 1293 CrossRef.
- S. Naito, M. Iwahashi, I. Kawakami and T. Miyao, Catal. Today, 2002, 73, 355–361 CrossRef CAS.
- J. Wang, H. Chen, Z. Hu, M. Yao and Y. Li, Catal. Rev.: Sci. Eng., 2015, 57, 79–144 CAS.
- H. P. Klug and L. E. Alexander, X-ray Diffraction Procedures for Polycrystalline and Amorphous Materials, Wiley, New York, 2nd edn, 1974 Search PubMed.
- A. Patterson, Phys. Rev., 1939, 56, 978–982 CrossRef CAS.
- C. D. Wagner, W. M. Riggs, L. E. Davis, and J. F. Moulder, Handbook of X-ray Photoelectron Spectroscopy, ed. G.E. Muilenberg, Perkin-Elmer Corp., Waltham, MA, 1978 Search PubMed.
- G. B. Hoflund, H. A. E. Hagelin, J. F. Weaver and G. N. Sailata, Appl. Surf. Sci., 2003, 205, 102–112 CrossRef CAS.
- M. Fernández-García, A. Iglesias-Juez, A. Martínez-Arias, A. B. Hungría, J. A. Anderson, J. C. Conesa and J. Soria, J. Catal., 2004, 221, 594–600 CrossRef.
- Y. Lu, M. S. Kumar, G. L. Chiarello, P. D. Eggenschwiler, C. Bach, M. Weilenmann, A. Spiteri, A. Weidenkaff and D. Ferri, Catal. Commun., 2013, 39, 55–59 CrossRef CAS.
- A. Iglesias-Juez, A. Kubacka, A. Martínez-Arias, M. Di Michiel and M. A. Newton, J. Am. Chem. Soc., 2011, 133, 4484–4489 CrossRef CAS PubMed.
Footnote |
| † Electronic supplementary information (ESI) available. See DOI: 10.1039/c7ra00836h |
| This journal is © The Royal Society of Chemistry 2017 |

