 Open Access Article
Creative Commons Attribution 3.0 Unported Licence
An azo-phenol derivative probe: colorimetric and “turn-on” fluorescent detection of copper(II) ions and pH value in aqueous solution
Yanchun Lia,
Xiaojun Han b and
Yan Song
 *c
*c
aDepartment of Chemistry and Pharmaceutical Engineering, Jilin Institute of Chemical Technology, Jilin, 132022, People's Republic of China
bState Key Laboratory of Urban Water Resource and Environment, School of Chemistry and Chemical Engineering, Harbin Institute of Technology, 92 West Da-Zhi Street, Harbin, 150001, China
cDepartment of Chemical and Materials Engineering, Jilin Institute of Chemical Technology, Jilin, 132022, People's Republic of China. E-mail: songyan199809@163.com
First published on 10th April 2017
Abstract
The optical properties of a novel, rhodamine-based derivative, synthesized by reacting rhodaminehydrazide and an azo-phenol derivative in ethanol, were investigated in ethanol–water solution. The novel sensor displayed selectivity for Cu2+ ions, as evidenced by a colourless to dark red colour change, which was characterized using UV visible spectroscopy and which also allowed visual detection of Cu2+. In contrast, selectivity towards pH was determined from changes in the absorption spectra in the micromolar range. This represents the first reported rhodamine-based sensor capable of detecting both Cu2+ and pH using two different modes. In addition, the rhodamine-based sensor has been successfully applied in the biomedical research field to the fluorescence imaging of Cu2+ in HeLa cells.
1. Introduction
Cu2+ has caused serious harm to the environment and human health. It can cause serious injury to human kidneys, lungs, bone and the nervous system, which results in renal dysfunction, calcium metabolism disorders and an increased incidence of certain forms of cancer.1 However, the mechanisms involved in Cu2+-uptake and carcinogenesis remain undefined.2,3 The EPA (United States Environmental Protection Agency) gives an enforceable drinking water standard for Cu of 5 ppb to prevent kidney damage and other related diseases, while the WHO (World Health Organization) provides a more strict guideline value for Cu of 3 ppb for drinking water. Therefore, developing reliable methods for Cu2+ trace quantification in environmental samples and in living cell/tissue samples is of great significance for clarifying Cu2+-carcinogenesis and other biological effects.In recent years, the development of fluorescent chemosensors for sensing and reporting heavy transition-metal ions has been receiving considerable attention.4,5 Fluorescence techniques have become powerful tools for sensing and imaging metal ions in trace amounts because of its simplicity, high sensitivity and real-time monitoring with in short response time. Sensitive and reliable fluorescent molecular sensors seem to be the ideal tool for evaluating and dynamically mapping the intracellular fluctuations of metal ions by using microscopy techniques to allow real-time local imaging.6–11 Up to now, many fluorescent sensors for Cu2+ have been reported,12,13 but only a few of them are applicable to cellular imaging,14,15 their practical application is still restrained due to their poor water solubility, UV-excitation and pH-dependent fluorescence in physiological environments. To date, it is still a tremendous challenge to design Cu2+-selective sensors, in particular, fluorescent chemosensor for the accurate detection of Cu2+ in aqueous solutions and biological environments.
A practical fluorescent chemosensor must produce a strong fluorescent response upon binding the analyte. Rhodamine, as a dye, is an ideal mode for construction of fluorogenic-labeling and fluorescent chemosensors because of their particular spirolactam structures and excellent photophysical properties, including high absorption coefficient, high fluorescence quantum yield and high photostability.16,17 By virtue of these fascinating properties, the excellent examples of rhodamine-based fluorescent chemosensor have been designed and successfully applied for detecting metal ions.18–23 And most rhodamine-based chemosensors are fluorescence enhancement, which is of great importance for metal ions detection.24,25 Nevertheless, there is a relatively few reports concerned the chemosensor based on rhodamine derivative for selective detection of metal ions in aqueous and application in cell imaging.26–28
In this paper, we report the synthesis and fluoroionophoric properties of a novel fluorescent sensor aimed at the selective recognition of Cu2+ ions in aqueous solution and living cells. Sensor 1 is composed of an rhodamine fluorophore and a receptor of the N,N′-bis(salicylidene)-diethylenetriamine attached via a space linker. Sensor 1 exhibits Cu2+-selective TURN-ON and Cu2+-selective TURN-OFF type signaling behaviors that can be used to distinguish Cu2+ ions. Moreover, to the best of our knowledge, this is the first example of a cation-induced TURN-ON and TURN-OFF type of fluorescent signal control behavior which was applied to intracellular imaging of Cu2+.
2. Experiment section
2.1 Materials
Rhodamine B 98% purity, (Beijing Hengyue Zongyuan Chemical CO., LTD). N,N-Dimethylform amide (DMF) was distilled and dried by anhydrous magnesium sulfate. Aniline (99% purity), salicylaldehyde, hydrazine hydrate, and all other reagents were purchased from Sinopharm Chemical Reagent Co., Ltd., and used as received. The solutions of metal ions were prepared from NaCl, KCl, CaCl2, MgSO4, FeCl3, Mn(NO3)2·6H2O, CoCl2·6H2O, NiCl2·6H2O, Zn(NO3)2, CuCl2, CuCl2·2H2O, Hg(NO3)2, AgNO3, Pb(NO3)2, respectively, and were dissolved in deionized water. Aqueous Tris–HCl (0.1 mol L−1) solution was used as buffer to keep pH value (pH = 7.14), and to maintain the ionic strength of all solutions in experiments.2.2 Characterization
The synthesis of sensor 1 is shown in Scheme 1. The intermediate, compound (1), was synthesized from salicylaldehyde and aniline following a literature procedure.29 Compound (2) was prepared in 50.8% yield of pure product by coupling Rhodamine B with hydrazine hydrate. Sensor 1 was easily synthesized by compound (1) and (2) in 75.6% yield, and characterized by ESI-MS, 1H-NMR and 13C-NMR.1H NMR spectra were measured on a Bruker AV-300 spectrometer with chemical shifts reported as parts per million (in CDCl3, TMS as internal standard). IR spectra were recorded on a Bruker Vector-22 spectrometer. The pH values of the test solutions were measured with a glass electrode connected to a Mettler-Toledo Instruments DELTA 320 pH meter (Shanghai, China) and adjusted if necessary. Fluorescence spectra were determined on a Hitachi F-4500. UV-Vis spectra were recorded on a Hitachi U-3010 UV-Vis spec.
3. Synthesis
3.1 Synthesis of intermediate (1)
To a solution of aniline (5 mL, 0.05 mol) in a small quantity of water was slowly added 20 mL of 50% HCl solution at 0–5 °C with stirring. Then, the solution of NaNO2 (4 g NaNO2 + 20 mL H2O) was added to the above-mentioned mixture and the resulting solution was stirred for 1 h to give a bright yellow solution. Salicylaldehyde (5 mL, 0.05 mol) was dissolved in the solution of Na2CO3 (18 g Na2CO3 + 120 mol H2O). Then the solution of salicylaldehyde was added dropwise to the bright yellow solution for 1 h. After stirring for 4 h, the reaction mixture was neutralized with HCl, the brown crude solid was filtered and recrystallized from ethanol to afford a pure yellow product. Yield: 62.8%.3.2 Synthesis of intermediate (2)
Rhodamine B (5.0 g, 10.46 mmol) was dissolved in 150 mL of anhydrous ethanol; 10 mL (excess) hydrazine hydrate (85%) was then added. After the addition, the stirred mixture was heated to reflux in an air bath for 2 h. The solvent was evaporated under reduced pressure, 1 M NaOH was added slowly with stirring until the pH of the solution reached.30,31 The resulting precipitate was filtered and washed 3 times with water. The crude material was purified by flash column chromatography to give white product RHB-hydrazine (CH2Cl2/EtOH/Et3N, 5![[thin space (1/6-em)]](https://www.rsc.org/images/entities/char_2009.gif) :
:![[thin space (1/6-em)]](https://www.rsc.org/images/entities/char_2009.gif) 1
1![[thin space (1/6-em)]](https://www.rsc.org/images/entities/char_2009.gif) :
:![[thin space (1/6-em)]](https://www.rsc.org/images/entities/char_2009.gif) 0.1), yield: 50.8%.
0.1), yield: 50.8%.
3.3 Synthesis of sensor 1
To 30 mL anhydrous ethanol containing (2) (0.50 g, 1.1 mmol), an excessive (1) (0.34 g, 1.5 mmol) was added and the mixture was stirred vigorously at 90 °C for 24 h. After completion of the reaction, the formed precipitate was filtered, washed with cold ethanol (3 × 10 mL) and then dried in vacuum, affording 0.65 g crude product, which was purified by flash column chromatography to give white product RHB-hydrazine. (CH2Cl2/EtOH/Et3N, 5![[thin space (1/6-em)]](https://www.rsc.org/images/entities/char_2009.gif) :
:![[thin space (1/6-em)]](https://www.rsc.org/images/entities/char_2009.gif) 1
1![[thin space (1/6-em)]](https://www.rsc.org/images/entities/char_2009.gif) :
:![[thin space (1/6-em)]](https://www.rsc.org/images/entities/char_2009.gif) 0.1), yield: 75.6%. 1H NMR (300 MHz, CDCl3, δ): 8.06 (d, J = 7.6 Hz, 6H), 7.89 (s, 7H), 7.86 (d, J = 2.2 Hz, 7H), 7.80 (s, 5H), 7.60 (d, J = 5.1 Hz, 10H), 7.52 (d, J = 7.7 Hz, 8H), 7.48 (d, J = 6.9 Hz, 5H), 7.28–7.17 (m, 6H), 7.02 (d, J = 8.7 Hz, 6H), 6.56 (s, 19H), 6.35 (s, 10H), 3.39 (d, J = 7.0 Hz, 40H), 1.33–1.12 (m, 59H); 13C NMR (300 MHz, CDCl3, δ): 168.67, 159.93, 152.70, 151.89, 151.09, 148.56, 146.93, 145.00, 134.01, 130.81, 129.29, 128.85, 128.48, 127.57, 125.42, 123.83, 123.34, 123.06, 122.17, 120.06, 117.28, 108.19, 104.91, 97.42, 65.54, 43.61, 12.27; IR (KBr, cm−1): ν = 3437, 2972, 2929, 2893, 1692, 1615, 1548, 1515, 1481, 1466, 1428, 1401, 4135, 1375, 1307, 1267, 1220, 1120, 1079, 814, 788, 769, 759, 700 and 690; HRMS (ESI, m/z): [M + H]+ cal. Cu for C41H40N6O3, 664.3162; found, 665.3459.
0.1), yield: 75.6%. 1H NMR (300 MHz, CDCl3, δ): 8.06 (d, J = 7.6 Hz, 6H), 7.89 (s, 7H), 7.86 (d, J = 2.2 Hz, 7H), 7.80 (s, 5H), 7.60 (d, J = 5.1 Hz, 10H), 7.52 (d, J = 7.7 Hz, 8H), 7.48 (d, J = 6.9 Hz, 5H), 7.28–7.17 (m, 6H), 7.02 (d, J = 8.7 Hz, 6H), 6.56 (s, 19H), 6.35 (s, 10H), 3.39 (d, J = 7.0 Hz, 40H), 1.33–1.12 (m, 59H); 13C NMR (300 MHz, CDCl3, δ): 168.67, 159.93, 152.70, 151.89, 151.09, 148.56, 146.93, 145.00, 134.01, 130.81, 129.29, 128.85, 128.48, 127.57, 125.42, 123.83, 123.34, 123.06, 122.17, 120.06, 117.28, 108.19, 104.91, 97.42, 65.54, 43.61, 12.27; IR (KBr, cm−1): ν = 3437, 2972, 2929, 2893, 1692, 1615, 1548, 1515, 1481, 1466, 1428, 1401, 4135, 1375, 1307, 1267, 1220, 1120, 1079, 814, 788, 769, 759, 700 and 690; HRMS (ESI, m/z): [M + H]+ cal. Cu for C41H40N6O3, 664.3162; found, 665.3459.
4. Results and discussion
4.1 pH-titration and spectral responses
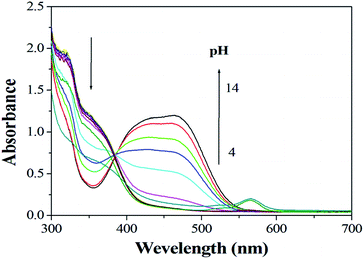
The effects of pH on the absorption of sensor 1 in the absence and presence of Cu2+ are determined over the range 4–14. The pH dependence of absorption spectra is shown in Fig. 1 and 2. As we can see the sensor and the complex are stable in the wide range of pH 4–10, suggesting that it could be used for the estimation of Cu2+ under complex physiological conditions for biological applications.4.2 Cu2+-titration and spectral responses
In order to gain an insight into the signalling properties of the sensor 1 toward Cu2+, fluorescence titration was conducted. Fluorescence titration of the sensor 1 was investigated in ethanol–water (1![[thin space (1/6-em)]](https://www.rsc.org/images/entities/char_2009.gif) :
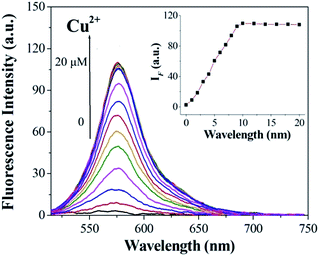
:![[thin space (1/6-em)]](https://www.rsc.org/images/entities/char_2009.gif) 10, v/v) solution ([Cu2+] = 2.0 × 10⁻⁶ mol L−1, 0.1 M Tris–HCl buffer at pH = 7.14, λex = 500 nm, λem = 565 nm). Upon addition of Cu2+, about a 14-fold increase in fluorescence intensity was observed at 575 nm (Fig. 3). When more than 1.0 equiv. Cu2+ was added, the maximum fluorescence intensity was retained. The reaction responsible for these changes reached completion well within the time frame (<30 s) of the measurement. Significantly, the enhancement of fluorescence intensity of sensor 1 corresponded to the concentration of Cu2+ in a linear manner (linearly dependent coefficient: R = 0.9929) (Fig. 4), which indicated that sensor 1 had potential use for the quantitative determination of Cu2+. It should be noted that this switch on sensing process could be readily detected not only by fluorescence spectroscopy but also by the naked eye. Moreover, a Job's plot, which exhibited a maximum at 0.5 mole fraction of sensor 1, indicated the 1
10, v/v) solution ([Cu2+] = 2.0 × 10⁻⁶ mol L−1, 0.1 M Tris–HCl buffer at pH = 7.14, λex = 500 nm, λem = 565 nm). Upon addition of Cu2+, about a 14-fold increase in fluorescence intensity was observed at 575 nm (Fig. 3). When more than 1.0 equiv. Cu2+ was added, the maximum fluorescence intensity was retained. The reaction responsible for these changes reached completion well within the time frame (<30 s) of the measurement. Significantly, the enhancement of fluorescence intensity of sensor 1 corresponded to the concentration of Cu2+ in a linear manner (linearly dependent coefficient: R = 0.9929) (Fig. 4), which indicated that sensor 1 had potential use for the quantitative determination of Cu2+. It should be noted that this switch on sensing process could be readily detected not only by fluorescence spectroscopy but also by the naked eye. Moreover, a Job's plot, which exhibited a maximum at 0.5 mole fraction of sensor 1, indicated the 1![[thin space (1/6-em)]](https://www.rsc.org/images/entities/char_2009.gif) :
:![[thin space (1/6-em)]](https://www.rsc.org/images/entities/char_2009.gif) 1 stoichiometry between Cu2+ and sensor 1 (Fig. 5). Therefore, on the basis of 1
1 stoichiometry between Cu2+ and sensor 1 (Fig. 5). Therefore, on the basis of 1![[thin space (1/6-em)]](https://www.rsc.org/images/entities/char_2009.gif) :
:![[thin space (1/6-em)]](https://www.rsc.org/images/entities/char_2009.gif) 1 stoichiometry and fluorescence titration data, the detection limit was found to be 7.2 × 10⁻⁷ mol L−1 (based on S/N = 3).
1 stoichiometry and fluorescence titration data, the detection limit was found to be 7.2 × 10⁻⁷ mol L−1 (based on S/N = 3).
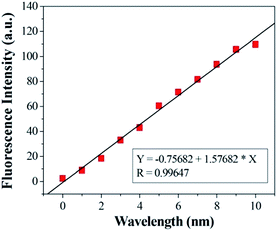 | ||
| Fig. 4 Curve of fluorescence intensity at 525 nm of sensor 1 versus increasing concentrations of Cu2+. | ||
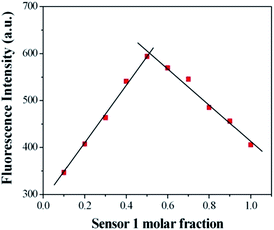 | ||
Fig. 5 Job's plot for sensor 1 (forms 1![[thin space (1/6-em)]](https://www.rsc.org/images/entities/char_2009.gif) : :![[thin space (1/6-em)]](https://www.rsc.org/images/entities/char_2009.gif) 1 complexes) in 0.1 M Tris–HCl solution (ethanol–water = 1 1 complexes) in 0.1 M Tris–HCl solution (ethanol–water = 1![[thin space (1/6-em)]](https://www.rsc.org/images/entities/char_2009.gif) : :![[thin space (1/6-em)]](https://www.rsc.org/images/entities/char_2009.gif) 10, v/v, pH = 7.14). The total concentration of sensor 1 and Cu2+ is 2 μM. 10, v/v, pH = 7.14). The total concentration of sensor 1 and Cu2+ is 2 μM. | ||
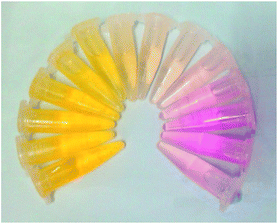
Fig. 6 shows the result of absorption titration of sensor 1 with Cu2+ ions. When no Cu2+ ions were added to the solution of sensor 1, free 1, as expected, exhibited almost no absorption near 500–600 nm, indicating that sensor 1 exists as a spirocyclic form. Upon addition of increasing concentrations of Cu2+ ions to the solution, two absorption bands centered at 380 nm and 560 nm appeared with increasing intensity, which can be ascribed to the formation of the ring-opened amide form of sensor 1 upon Cu2+ ions binding. Moreover, the titration solution exhibited an obvious and characteristic colour change from colourless to red (Fig. 7), suggesting that sensor 1 can serve as a “naked-eye” indicator for Cu2+ ions.
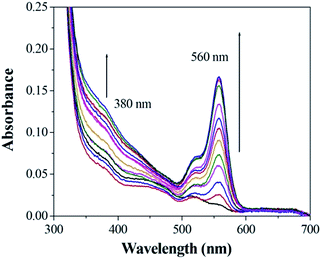 | ||
Fig. 6 The absorption change profile of sensor 1 (1 μM) to different metal ions (2 mM) in 0.1 M Tris–HCl solution (ethanol–water = 1![[thin space (1/6-em)]](https://www.rsc.org/images/entities/char_2009.gif) : :![[thin space (1/6-em)]](https://www.rsc.org/images/entities/char_2009.gif) 10, v/v, pH 7.14). 10, v/v, pH 7.14). | ||
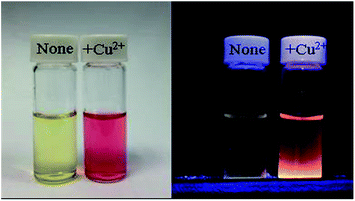 | ||
Fig. 7 Change in color (left) and fluorescence (right) of sensor 1 (10 mM) in buffered (Tris–HCl, pH 7.14, ethanol–water = 1![[thin space (1/6-em)]](https://www.rsc.org/images/entities/char_2009.gif) : :![[thin space (1/6-em)]](https://www.rsc.org/images/entities/char_2009.gif) 10, v/v) upon addition of 1 mM Cu2+ ions. 10, v/v) upon addition of 1 mM Cu2+ ions. | ||
4.3 Response of sensor 1 to various metal ions and competition experiments
Other representative metal ions, such as Na+, K+, Ca2+, Mg2+, Mn2+, Ni2+, Fe3+, Hg2+, Co2+, Pb2+, Zn2+ ions, showed almost negligible effects on the fluorescence behavior of sensor 1 (Fig. 8). In order to further test the interference of other common cations in the determination of Cu2+, competition experiments were performed in which the fluorescent sensor was added to a solution of Cu2+ in the presence of other metal ions (Fig. 9). The competition experiments were conducted in the presence of Cu2+ ion mixed with Na+, K+, Ca2+, Mg2+, Mn2+, Ni2+, Fe3+, Hg2+, Co2+, Pb2+, Zn2+, respectively. Experimental results indicated that these ions showed no obvious interference in the Cu2+ detection. Thus, the sensor 1 exhibited excellent selectivity toward Cu2+, which its practical application.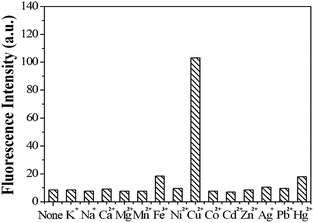 | ||
| Fig. 8 The fluorescence intensity of sensor 1 (1 μM) in the presence of different metal ions (10 μM). | ||
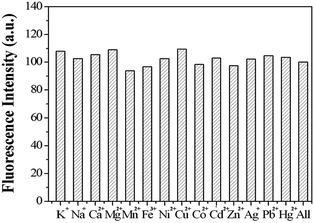 | ||
Fig. 9 The fluorescence intensity of sensor 1 (μM) with 1.5 equiv. of Cu2+, followed by 10 equiv. of Mn+. (Tris–HCl, pH 7.14, ethanol–water = 1![[thin space (1/6-em)]](https://www.rsc.org/images/entities/char_2009.gif) : :![[thin space (1/6-em)]](https://www.rsc.org/images/entities/char_2009.gif) 10, v/v, λex = 500 nm). 10, v/v, λex = 500 nm). | ||
4.4 Potential application of sensor 1 for Cu2+ fluorescence imaging in HeLa cells
To investigate the potential biological application of sensor 1, fluorescence imaging experiments were attempted on HeLa cells (Fig. 10). The cells were incubated with 10 μM of sensor 1 for 30 min at 37 °C, only slightly fluorescence was observed owing to a small quantity of Cu2+ in cancer cells (Fig. 10b), which was confirmed by previous research.32–34 However, the cells were added with 20 μM of Cu2+ for another 30 min, an obviously fluorescence response was observed (Fig. 10c). The fluorescence imaging experiments confirmed that sensor 1 had good cell-permeability and could be used for detecting Cu2+ in living cells. | ||
| Fig. 10 Images of HeLa cells. (a) Bright fields image of HeLa cells incubated sensor 1; (b) fluorescence image of (a); (c) fluorescence image of HeLa cells incubated with sensor 1 and Cu2+. | ||
5. Conclusions
In conclusion, we have synthesized a simple and easy-to-prepare azo-phenol derivative optical chemosensor 1 for the detection of Cu2+ ions. The chemosensor 1 displayed 1![[thin space (1/6-em)]](https://www.rsc.org/images/entities/char_2009.gif) :
:![[thin space (1/6-em)]](https://www.rsc.org/images/entities/char_2009.gif) 1 complex formation with Cu2+ ions. Cu2+-specific binding enabled the opening of the spirolactam ring and consequently successfully exhibited a obvious absorption and fluorescence enhancement response toward Cu2+ ions over other metal ions. Thus the chemosensor 1 behaves as a highly sensitive and selective fluorescent probe for Cu2+ ions detection. Moreover, we have demonstrated the application of sensor 1 by imaging intracellular Cu2+ in HeLa cells, which demonstrated the potentialvalue in living system.
1 complex formation with Cu2+ ions. Cu2+-specific binding enabled the opening of the spirolactam ring and consequently successfully exhibited a obvious absorption and fluorescence enhancement response toward Cu2+ ions over other metal ions. Thus the chemosensor 1 behaves as a highly sensitive and selective fluorescent probe for Cu2+ ions detection. Moreover, we have demonstrated the application of sensor 1 by imaging intracellular Cu2+ in HeLa cells, which demonstrated the potentialvalue in living system.
Acknowledgements
This work was supported by the Scientific and Technological Development Plan Project of Jilin Province (Grant No. 20160101311JC).Notes and references
- K. C. Jones, Environ. Pollut., 1993, 81, 301 CrossRef.
- C. C. Bridges and R. K. Zalups, Toxicol. Appl. Pharmacol., 2005, 204, 274–308 CrossRef CAS PubMed.
- J. H. Lee and G. F. Birch, Environ. Monit. Assess., 2016, 188, 1–17 CrossRef PubMed.
- J. Tian, Q. Liu, A. M. Asiri, A. O. Al-Youbi and X. Sun, Anal. Chem., 2013, 85, 5595–5599 CrossRef CAS PubMed.
- W. Lu, X. Qin, S. Liu, G. Chang, Y. Zhang, Y. Luo, A. M. Asiri, A. O. Al-Youbi and X. Sun, Anal. Chem., 2012, 84, 5351–5357 CrossRef CAS PubMed.
- L. Zeng, E. W. Miller, A. Pralle, E. Y. Isacoff and C. J. Chang, J. Am. Chem. Soc., 2010, 128, 10–11 CrossRef PubMed.
- S. P. Wu, Z. M. Huang, S. R. Liu and P. K. Chung, J. Fluoresc., 2012, 23, 1139–1145 Search PubMed.
- B. Sen, M. Mukherjee, S. Pal, S. Sen and P. Chattopadhyay, RSC Adv., 2015, 5, 50532–50539 RSC.
- P. Chattopadhyay, B. Sen, M. Mukherjee, S. Pal and S. Sen, RSC Adv., 2015, 5, 50532–50539 RSC.
- M. Yang, H. Wang, J. Huang, M. Fang, B. Mei, H. Zhou, J. Wu and Y. Tian, Sens. Actuators, B, 2014, 204, 710–715 CrossRef CAS.
- Y. Wang, H. Q. Chang, W. N. Wu, X. J. Mao, X. L. Zhao, Y. Yang, Z. Q. Xu, Z. H. Xu and L. Jia, J. Photochem. Photobiol., A, 2017, 335, 10–16 CrossRef CAS.
- X. Wang, J. Zhao, C. Guo, M. Pei and G. Zhang, Sens. Actuators, B, 2014, 193, 157–165 CrossRef CAS.
- S. Li and S. Dong, J. Mater. Chem., 2008, 18, 4636–4640 RSC.
- Q. Qu, A. Zhu, X. Shao, G. Shi and Y. Tian, Chem. Commun., 2012, 48, 5473–5475 RSC.
- M. Yu, M. Shi, Z. Chen, F. Li, X. Li, Y. Gao, J. Xu, H. Yang, Z. Zhou and T. Yi, Chemistry, 2008, 14, 6892–6900 CrossRef CAS PubMed.
- W. Wang, Q. Yang, L. Sun, H. Wang, C. Zhang, X. Fei, M. Sun and Y. Li, J. Hazard. Mater., 2011, 194, 185–192 CrossRef CAS PubMed.
- X. Q. Chen, T. Pradhan, F. Wang, J. S. Kim and J. Yoon, Chem. Rev., 2012, 112, 1910–1956 CrossRef CAS PubMed.
- X. Zhang, X. J. Huang and Z. J. Zhu, RSC Adv., 2013, 3, 24891–24895 RSC.
- A. Dhara, A. Jana, N. Guchhait, P. Ghosh and S. K. Kar, New J. Chem., 2014, 38, 1627–1634 RSC.
- Y. Zhou, F. Wang, Y. Kim, S.-J. Kim and J. Yoon, Org. Lett., 2009, 11, 4442–4445 CrossRef CAS PubMed.
- Z. Xu, L. Zhang, R. Guo, T. Xiang, C. Wu, Z. Zheng and F. Yang, Sens. Actuators, B, 2011, 156, 546–552 CrossRef CAS.
- C. Yu, J. Zhang, R. Wang and L. Chen, Org. Biomol. Chem., 2010, 8, 5277–5279 CAS.
- Y. Zhao, X.-B. Zhang, Z.-X. Han, L. Qiao, C.-Y. Li, Li-X. Jian, G.-L. Shen and R.-Q. Yu, Anal. Chem., 2009, 81, 7022–7030 CrossRef CAS PubMed.
- Y. X. Wu, J. B. Li, L. H. Liang, D. Q. Lu, J. Zhang, G. J. Mao, L. Y. Zhou, X. B. Zhang, W. H. Tan, G. L. Shen and R. Q. Yu, Chem. Commun., 2014, 50, 2040–2042 RSC.
- Y. Yuan, S. G. Sun, S. Liu, X. W. Song and X. J. Peng, J. Mater. Chem. B, 2015, 3, 5261–5265 RSC.
- B. Zhu, C. Gao, Y. Zhao, C. Liu, Y. Li, Q. Wei, Z. Ma, B. Du and X. Zhang, Chem. Commun., 2011, 47, 8656 RSC.
- L. M. Zhang, L. E. Guo, X. M. Li, Y. G. Shi, G. F. Wu, X. G. Xie, Y. Zhou, Q. H. Zhao and J. F. Zhang, Tetrahedron Lett., 2014, 55, 6131–6136 CrossRef CAS.
- J. F. Zhang, S. Kim, J. H. Han, S. J. Lee, T. Pradhan, Q. Y. Cao, C. Kang and J. S. Kim, Org. Lett., 2011, 13, 5294–5297 CrossRef CAS PubMed.
- M. R. Maurya, S. J. J. Titinchi and S. Chand, J. Mol. Catal. A: Chem., 2003, 193, 165–176 CrossRef CAS.
- H. Yang, Z. Zhou, K. Huang, M. Yu, F. Li, T. Yi and C. Huang, Org. Lett., 2007, 9, 4729–4732 CrossRef CAS PubMed.
- H. S. Jung, P. S. Kwon, J. W. Lee, J. I. Kim, S. H. Chang, J. W. Kim, S. Yan, Y. L. Jin, J. H. Lee and T. Joo, J. Am. Chem. Soc., 2009, 131, 2008–2012 CrossRef CAS PubMed.
- M. C. Linder and M. Hazegh-Azam, Am. J. Clin. Nutr., 1996, 63, 797S–811S CAS.
- D. Chen, Q. C. Cui, H. Yang, R. A. Barrea, F. H. Sarkar, S. Sheng, B. Yan, G. P. Reddy and Q. P. Dou, Cancer Res., 2007, 67, 1636–1644 CrossRef CAS PubMed.
- R. An, D. Zhang, Y. Chen and Y.-Z. Cui, Sens. Actuators, B, 2016, 222, 48–54 CrossRef CAS.
| This journal is © The Royal Society of Chemistry 2017 |


