 Open Access Article
Structure and crystallization behavior of Al containing glasses in the CaO–B2O3–SiO2 system
Jiao Han *a,
Yuanming Laib,
Yao Xianga,
Shuang Wua,
Yiming Zeng*a,
Hongwei Yanga,
Yongyun Maoa and
Yuwen Yanga
aState Key Laboratory of Advanced Technologies for Comprehensive Utilization of Platinum Metals, Kunming Institute of Precious Metals, Kunming 650106, PR China. E-mail: hanjiao90@sina.com; zengym0871@126.com
bState Key Laboratory of Electronic Thin Films and Integrated Devices, University of Electronic Science and Technology of China, Chengdu 610054, PR China
First published on 6th March 2017
Abstract
The aim of the present work is to investigate the effects of Al2O3 content on both the structure and crystallization behavior of CaO–B2O3–SiO2 (CBS) glass composition using NMR, FT-IR and DSC. The density experimental results showed that the density (ρ) of glasses decreased linearly with increasing Al2O3 content, while the molar volume (Vm) of the glasses increased linearly. The NMR revealed that the Al occurred in the forms of AlIV, AlV and AlVI units. With the increasing Al2O3 content, the amount of Al species show little change, the relative amount of BIIIa and BIIIs units increases while the BIV units decrease, and the Q4 structural units increases clearly but the Q3 decreases. Further, crystallization peaks of CBS glasses shift to higher temperatures, indicating that Al2O3 addition can suppress crystallization of CBS glasses.
1. Introduction
During the second half of the 19th century, borosilicate optical glass was first studied to offer systematic insight into the relationships between the composition of glass and its physical and chemical properties. After this, CaO–B2O3–SiO2 (CBS) glasses have been a popular study point over the years due to their excellent properties in a number of fields, for instance, high emissivity coating materials,1 optical glasses for smart window applications,2 or as bioactive materials to prevent microfouling,3 or also as storage materials for dealing with nuclear waste4 and electronic glasses in low temperature co-fired ceramics (LTCC) technology.5In order to satisfy the need of the technical applications in different fields, the optimization in glasses is carried out in composition and structure of the glasses to achieve the required physical, mechanical and dielectric properties. Introduction of intermediate oxides, such as ZnO,3,6 ZrO2 (ref. 7) and Al2O3,8 in borosilicate glass can be an effective way to change structure of glass. They can act either as glass modifier or glass former, depending upon their amount in glass composition. The oxide addition in glass system will lead to the change of NBOs, resulting in the formation of different structural units within the glass network. This will make great contribution optimize the chemical, thermal stability and various properties (physical properties and dielectric properties) of glasses. Colak et al.6 reported the dramatic effect (modifier or network former) of ZnO in borate glass structure due to the non-bridging oxygen atoms. The ZnO played as a network former when having more than 5% (weight%) ZnO in glasses, on the contrary, the role was modifier. Khan et al.7 did some research about the modification in yttrium calcium borosilicate glasses units by ZrO2 instead of CaO. Interestingly higher content of ZrO2 ≥7.5 mol% may be acts as glass former and below 7.5 mol%, it may act as glass modifier. Also, the variation in structure leads to the change of optical and dielectric properties. Neuville et al.9 found that Al/Si tetrahedral distribution in the glass network in different Qn units depending on the join R![[double bond, length as m-dash]](https://www.rsc.org/images/entities/char_e001.gif) CaO/Al2O3. The results revealed the remarkable function of aluminum in CaO–Al2O3–SiO2 (CAS) ternary glass system. Aluminoborosilicate glasses consist of structural units, such as BO3, BO4,10 SiO4,11 AlO4 and AlO6 (ref. 12) species. The transformation of network formers in aluminosilicate glasses can make the structure of CaO–B2O3–SiO2 glass meet the application need.
CaO/Al2O3. The results revealed the remarkable function of aluminum in CaO–Al2O3–SiO2 (CAS) ternary glass system. Aluminoborosilicate glasses consist of structural units, such as BO3, BO4,10 SiO4,11 AlO4 and AlO6 (ref. 12) species. The transformation of network formers in aluminosilicate glasses can make the structure of CaO–B2O3–SiO2 glass meet the application need.
However, so far, there is no report about utilizing FT-IR spectra, NMR, DSC and XRD to research the structure and crystallization of calcium aluminoborosilicate glasses with varying Al content. Therefore, in this paper, we present a detailed report on the structure and crystallization of CaO–B2O3–SiO2 glass with Al2O3 content, especially the relationship between the Al content and the impacts on the units of glass network, which will provide guiding significance for further optimization of the glass structure.
2. Experimental
2.1 Preparation of glass samples
The (1 − x/100) × (35CaO–37SiO2–28B2O3) + xAl2O3, where x = 0, 1, 2.5, 5, 7.5 and 10 mol%, were prepared using analytically pure CaCO3, H3BO3, SiO2, and Al2O3 as the starting materials. The stoichiometric amounts of chemicals were mixed homogeneously and transferred to Pt crucibles to melt at a temperature of 1400 °C for 2 h in air. After melting, the melt was quickly quenched into deionized water and ground, followed by screened through a 500-mesh stainless steel wire screen to obtain glass powders with particle size less than 25 μm.2.2 Characterization of the samples
The XRD patterns of crushed powder samples were recorded within angular range 10–80° using PANalytical X'Pert PRO with Cu Kα radiation (λ = 1.54 Å). The 2θ angle scans were made at step width of 0.02° and a time per step of 0.5 s.The density of all glasses was examined using AccuPyc®II 1340 (Micromeritics USA). The data was tested ten times to obtain an accurate density value. Fourier transform infrared spectra (FT-IR, Thermo Nicolet Smart-380) were carried out in the range 400–2000 cm−1 at room temperature with a resolution of 2 cm−1 on glass powders. Samples were mixed with spectroscopic grade dry KBr powder and then compressed the mixtures to obtain pellets for FT-IR measurements.
A Differential Scanning Calorimetry (DSC, STA409 PG/PC, Netzsch, Germany) was carried out to determine the glass transition temperature (Tg) and the crystallization behavior. The test was conducted in a flowing atmosphere of dry air from ambient temperature to 1000 °C with a heating rate of β = 5 °C min−1. The DSC experiments were carried out using alumina crucibles with a-Al2O3 powder as a reference material.
11B, 27Al and 29Si magic angle spinning nuclear magnetic resonance spectroscopy (MAS-NMR, Varian Infinity-plus 400) were performed on all glasses to determine the roles of B, Si and Al in glasses system. The definite test condition refers to ref. 13.
3. Results and discussion
3.1 The XRD analysis
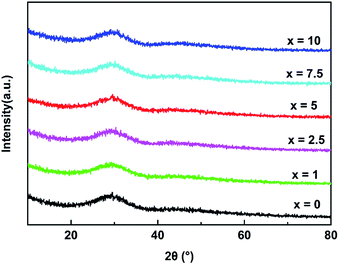
Fig. 1 presented the X-ray diffraction conducted on the glasses, which showed the diffusion peaks and no crystalline phases, indicating the amorphous state of all glasses.3.2 The FT-IR analysis
The FT-IR spectra of all glasses for x = 0, 1, 2.5, 5, 7.5 and 10 mol% between 400 and 2000 cm−1 are shown in Fig. 2(a), respectively. The broad bands showed in FT-IR absorbance spectra confirm the amorphous nature (as showed in Fig. 1) and wide distribution of Qn (Qn notation indicates n bridging oxygen per tetrahedron) units of glasses. All experimental glass compositions showed similar FT-IR spectra and the absorption bands are broad resulting in different component peaks to form overlap easily. Therefore, it is necessary to utilize the deconvolution based on Gaussian function to identify each component peak of all bands in the FT-IR spectra to realize their assignments. Fig. 2(b)–(d) represent the deconvoluted spectra of glasses for x = 0, x = 5 and x = 10 mol% as examples of the glasses investigated, respectively. The high frequency band around 1620 cm−1 is attributed to the molecular water.14 The band near 1450 cm−1 and 1380 cm−1 are characteristic of antisymmetric stretching vibration of [BO3].15 The band at 1234 cm−1 is due to the corresponding mode of borate triangles with non-bridging oxygen (NBO) atoms, which are mainly BO2O− triangles with two bridging and one non-bridging oxygen atom.16 It is notable that the intensity of the band at 1234 cm−1 increases gradually with the Al2O3 content increasing, revealing the enhancement of borate triangles with NBOs proportion in glasses. The band located around 1030 cm−1 assigned to the merging bands of the SiO4 tetrahedral,4 and the band shifted to lower wavenumber, the wavenumber of this band location are separately 1052, 1048, 1043, 1041, 1036, 1024 cm−1 from x = 0 to x = 10, respectively, indicating the addition of Al2O3 may change the combination mode in glasses. The band near 910 cm−1 is due to B–O stretching in BO4 units17 and its intensity becomes weaker as the increasing Al2O3 content. Additionally, the relative areas of the peak corresponding to SiO4 and BO4 units were calculated according to the assignment of the IR spectra, showed in Fig. 3(a). It reveals that the amount of SiO4 increase while the BO4 units reduce in glass system with the increasing x. The appeared band of 722 cm−1 is attributed to stretching vibrations of Al–O bond in [AlO4] tetrahedral18 and the bending vibration of the B–O–B bonds in the borate network;18,19 the band located around 500 cm−1 and 467 cm−1 are attributed to the Al–O stretching vibrations in [AlO6] octahedral and the bending vibration of Si–O–Si.19,20 Their relative areas are depicted in Fig. 3(b). The results show that the bending vibration of Si–O–Si weakens and the Al–O stretching vibrations increase.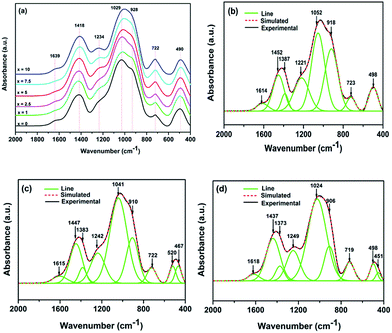 | ||
| Fig. 2 (a) The FT-IR spectra of the glasses; deconvoluted FT-IR spectra of the glasses based on Gaussian function, (b) x = 0, (c) x = 5, (d) x = 10. | ||
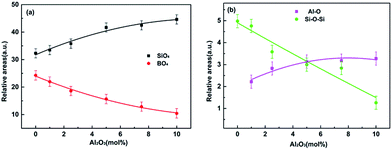 | ||
| Fig. 3 Dependence of the relative area of SiO4, BO4 group (a) and Al–O, Si–O–Si (b) on Al2O3 content. The lines are guide for the eyes. | ||
3.3 MAS-NMR spectroscopy
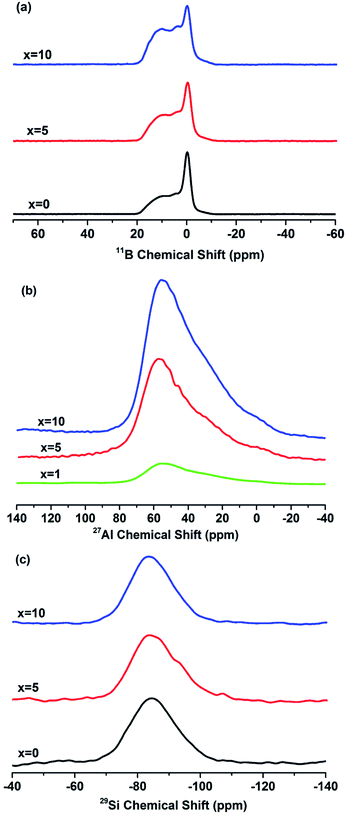
The 11B MAS-NMR spectra of the glasses with different Al2O3 content are shown in Fig. 4(a). The spectra show relatively broad peaks located at 11 ppm and 4 ppm are corresponding to asymmetric (BIIIa, boron with 1 or 2 bridging oxygens) and symmetric trigonal (BIIIs, boron with 0 or 3 bridging oxygens) boron units,21 respectively. The units are showed in the Fig. 5(d), the ball-and-stick models for species in glasses. And another sharper peak centered 0 ppm associated with tetrahedral (BO4, BIV) boron species,21 which is similar to borosilicate mineral superstructures danburite units [B(OB)(OSi)3].22 It is noteworthy that the intensity of [BO3] units increases distinctly with the increasing of x, indicating the rising amount of [BO3] units in glasses. In order to quantitatively figure out the distribution of BIII and BIV units of boron in glasses, the 11B MAS-NMR spectra were deconvoluted and the example of x = 5 was showed in Fig. 5(a), and their NMR parameters, the isotropic chemical shift (δiso) and the relative amount of structure units, were showed in Table 1. The δiso of all boron units shifts to a higher value obviously with the increasing x, i.e. the value shifts from 11.97 to 12.47 for BIIIa, from 3.17 to 3.64 for BIIIs and from −0.28 to −0.04 for BIV. In addition, the relative amount of BIIIa units increases from 26.44% to 32.7% and BIIIs is from 44.68% to 54.98%, while the BIV units decrease from 28.88% to 12.32% with the increasing of Al2O3 content (Table 1). The results are in accordance with previous outcome revealed by the band at 1234 cm−1 and 928 cm−1 in FT-IR. | ||
| Fig. 5 Deconvolution of (a) 11B, (b) 27Al and (c) 29Si NMR spectra for glass with x = 5. (d) The ball-and-stick models for species in glasses. | ||
| Boron site | δiso (ppm) | Amount (%) | |
|---|---|---|---|
| x = 0 | BIIIa | 11.97 | 26.44 |
| BIIIs | 3.17 | 44.68 | |
| BIV(1B,3Si) | −0.28 | 28.88 | |
| x = 5 | BIIIa | 12.33 | 28.14 |
| BIIIs | 3.47 | 53.38 | |
| BIV(1B,3Si) | −0.17 | 18.48 | |
| x = 10 | BIIIa | 12.47 | 32.70 |
| BIIIs | 3.64 | 54.98 | |
| BIV(1B,3Si) | −0.04 | 12.32 |
Fig. 4(b) revealed the 27Al MAS-NMR spectra of the glasses with x = 1, 5 and 10. The spectra showed a narrow peak centered at 55 ppm are associated with AlIV unit23 and the peak is sharper with the increasing of x, which shows the enhancement of Al units in glasses. In addition, the peaks are asymmetrical and broader demonstrating the presence of higher Al coordination,23 such as AlV and AlVI units. In order to quantitatively clarify the fractions and distribution of different Al coordination in glasses, the spectral deconvolution was performed using Gaussian by fitting one line shape and an example of x = 5 was presented in Fig. 5(b), and the isotropic chemical shift (δiso) and the relative amount of different Al coordination units were showed in Table 2. The peaks having chemical shifts around 55, 33 and 6.7 ppm can be attributed to AlIV, AlV and AlVI species (as showed in Fig. 5(d)),13 respectively. With the increasing of x, the relative amount of AlIV units decreases from 61.82% to 57.04% and the AlVI is from 10.85% to 10.08%, while the AlV increases from 27.31% to 32.87%.
| Aluminum site | δiso (ppm) | Amount (%) | |
|---|---|---|---|
| x = 1 | AlIV | 57.14 | 61.82 |
| AlV | 33.27 | 27.31 | |
| AlVI | 6.74 | 10.85 | |
| x = 5 | AlIV | 57.16 | 61.92 |
| AlV | 33.27 | 27.44 | |
| AlVI | 6.74 | 10.63 | |
| x = 10 | AlIV | 55.31 | 57.04 |
| AlV | 32.67 | 32.87 | |
| AlVI | 6.74 | 10.08 |
The 29Si MAS-NMR spectra for x = 0, 5 and 10 were showed in Fig. 4(c). Deconvolution of 29Si spectra was performed using Gaussian to quantitatively analyze the existence form and fractions of Si units. An example of 29Si deconvolution of x = 5 is presented in Fig. 5(c) and their NMR parameters are presented in Table 3. The results showed that two peaks around −84 and −90 ppm for all glasses, which are characteristic of the Q3 and Q4 structural units of silicon (as showed in Fig. 5(d)), respectively. The chemical shifts of Q4 structural units shift from −97.01 to −87.79 ppm and Q3 has no obvious change. Also, the relative amount of Q4 structural units increases clearly from 5.78% to 37.4%, while the Q3 decreases from 94.21% to 62.59% for x = 0 to x = 10.
| Silicon units | δiso (ppm) | Amount (%) | |
|---|---|---|---|
| x = 0 | Q3 | −84.47 | 94.21 |
| Q4 | −97.01 | 5.78 | |
| x = 5 | Q3 | −83.67 | 72.36 |
| Q4 | −94.03 | 27.63 | |
| x = 10 | Q3 | −83.06 | 62.59 |
| Q4 | −87.79 | 37.4 |
The previous structural studies (FT-IR, NMR) have shown that B occurs as BIIIa, BIIIs and BIV(1B,3Si) species, Al occurs in 4, 5, and 6-fold coordination (AlIV, AlV and AlVI) and Si presents in Q3 and Q4 units in the glasses. This shows the intermediate oxides Al2O3 may partly act as glass network former in glasses researched in this paper. The structural changes (Table 1) that the BIV species resolve into symmetric BO3 species and non-bridging oxygen can be shown as:13
| BO4 ↔ BIIIs + NBO | (1) |
The variation occurred in BIIIa and BIIIs species can be written as the following reaction:13
| BIIIs + NBO ↔ BIIIa | (2) |
Moreover, the SiO4 units with n bridging oxygen (Qn) may combine with the non-bridging oxygen to form the Qn−1 unit. The change can be presented as:13
| Qn + NBO ↔ Qn−1 | (3) |
The shift of AlIV, AlV and AlVI species with NBO can be represented as:
| AlV ↔ AlIV + NBO | (4) |
As increasing of Al2O3 content, the relative amount of AlIV units decreases while the AlV increases, and the AlVI remains stable (Table 2). These results shows that the AlIV units can capture more NBO to form the AlV units, however, the AlIV units have not enough NBO to shape the AlVI units. The NBOs captured by AlIV units may be originated in the dissociation of BO4 species (eqn (1)), which was consistent with the result revealed in Table 1. At the same time, due to the competition of Al units to gain the more NBOs, the relative amount of Q4 structural unit increases while the Q3 decreases (Table 3). This can account for the eqn (2). Therefore, the increasing concentration of Al substitution in glasses will lead to the decrease of NBOs, which will make the amount of BO3, Q4 units increase while BO4 and Q3 units decrease.
3.4 Thermal, phase and physical properties of glasses
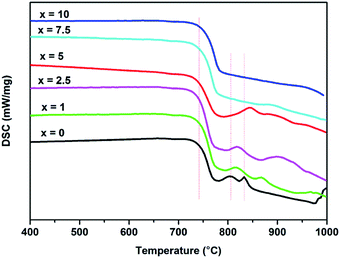
Fig. 6 presents the DSC plots of all the glasses measured at β = 5 °C min−1. The curves show 2 crystallization peaks (TP1 and TP2), related to the formation of the crystalline phase of wollastonite24 and borocalcite,25 respectively. With the increasing of Al2O3 content, the TP1 and TP2 shift in the direction of the higher temperature and gradually disappear. Table 4 presents the values of Tg (glass transition temperature), TP1 and TP2. The Tg is obtained from the onset of slope change of the DSC curves. The values of Tg for all glasses don't appear to be much different considering the error factor. The first crystallization peak TP1 successively increases with Al2O3 content from 805 to 945 °C, however, the second crystallization peak TP2 increases obviously with increasing x up to x = 5 mol%, and then disappears with the further increasing x in the whole measuring temperatures.| Tg (°C) | First peak TP1 (°C) | Second peak TP2 (°C) | ρ (g cm−3) | Vm (cm−3) | ρB units (g cm−3) | |
|---|---|---|---|---|---|---|
| x = 0 | 745 | 805 | 833 | 2.845 ± 0.004 | 26.8 | 3.18 |
| x = 1 | 744 | 816 | 867 | 2.832 ± 0.004 | 27.0 | — |
| x = 2.5 | 746 | 818 | 902 | 2.824 ± 0.003 | 27.3 | — |
| x = 5 | 744 | 845 | 955 | 2.810 ± 0.003 | 27.6 | 2.87 |
| x = 7.5 | 747 | 884 | — | 2.801 ± 0.004 | 27.9 | — |
| x = 10 | 750 | 945 | — | 2.785 ± 0.003 | 28.2 | 2.83 |
Fig. 7(a) shows the XRD patterns of all glasses isothermally treated once for 1 h at temperature of 850 °C with x = 0, 2.5, 7.5 and 10. It could be observed that the peak of crystallization become weaker gradually with the increasing of x, and the glass with x = 10 remains the glassy state. The main diffraction peaks for x = 0, 2.5 and 7.5 can be indexed to the CaSiO3 (JCPDS No. 10-0487), and a few diffraction peaks corresponding to CaB2O4 (JCPDS No. 01-0833) phase. This result conforms to the change of crystallization peaks (TP1 and TP2) in DSC analysis as shown in Fig. 6. The Fig. 7(b)–(d) show the XRD patterns of glasses with x = 0, 5 and 10, respectively. All samples were isothermally treated four times for 1 h at temperature of 850 °C. Fig. 7(b) revealed that the patterns of sample with x = 0 implemented repeated heat treatment were about the same. This result illustrates the sample was crystallized completely when heated at the first time. For sample with x = 5, the repeated heat treatment makes the crystallization more complete. However, for sample with x = 10, the crystallization was emerged until the third time heat treatment. This observation confirms previous findings, that chemically weak inclusions do not provide active foreign nucleation substrates.26 One of the most remarkable things about these patterns is that the crystalline phases, not just the CaSiO3 and CaB2O4 phase, the most is the Ca2SiO4 (JCPDS No. 49-1672). These results revealed that the addition of Al2O3 in glasses may hinder the crystallization of CBS glasses. This can be ascribed to the addition of Al2O3 dopants, dissolved in glass system, modifies the thermodynamic equilibrium of the system and this change is mainly entropy driven and also slowdown the kinetics of crystallization.27 The addition of Al2O3 leads to the reconnection of fractured silicon oxygen tetrahedron and a large extent of atomic rearrangements. This will make the glass need higher thermal energies to crystallize, resulting the increasing of crystallization temperature (Fig. 6 and Table 4).
The density and the molar volume (Vm) of all glasses for x = 0, 1, 2.5, 5, 7.5 and 10 also showed in Table 4. The molar volume (Vm) could be calculated using the following formula:28
 | (5) |
 | (6) |
4. Conclusions
The current study using NMR, FT-IR, DSC and XRD investigated the role of Al on structure and crystallization of CBS glass when added at a small concentration. The Al partly plays the network former role in CBS glasses and the Al goes into the glass network in 4-fold, 5-fold and 6-fold coordination whereas B goes in as both 4- and 3-fold coordination. The Si occurred in the form Q3 and Q4 units. With the increasing of Al2O3 content, the amount of BO3, Q4 units increase while BO4, Q3 units decrease. This is due to the NBOs competition occurred in Al, B and Si units. The density (ρ) of glasses decreased linearly with increasing Al2O3 content, while the molar volume (Vm) of the glasses increases linearly. The glass transition temperatures for all glasses don't appear to be much different, while the crystallization peaks of glasses containing Al shift to higher temperatures and disappear. At the same time, the peaks of crystallization become weaker gradually with the increasing of x. These results indicate that Al can hinder the crystallization of CBS glasses.Acknowledgements
The authors thank the National Center for Magnetic Resonance in Wuhan acquiring the MAS-NMR measurement. This work was supported by the fund of the Basic Applied Research Foundation of Yunnan Province, China (Grant No. 2016FD125, 2016FB083), the 551 project of Kunming and Science &Technology Program of Yunnan Province (No. 2014DC019).References
- G. Shao, X. Wu, Y. Kong, X. Shen, S. Cui, X. Guan, C. Jiao and J. Jiao, J. Alloys Compd., 2016, 663, 360–370 CrossRef CAS.
- M. Y. Hassaan, H. M. Osman, H. H. Hassan, A. S. El-Deeb and M. A. Helal, Ceram. Int., 2017, 43, 1795–1801 CrossRef CAS.
- M. Klinger-Strobel, O. Makarewicz, M. W. Pletz, A. Stallmach and C. Lautenschlager, J. Mater. Sci.: Mater. Med., 2016, 27, 175 CrossRef PubMed.
- M. Sitarz, J. Non-Cryst. Solids, 2011, 357, 1603–1608 CrossRef CAS.
- M. Ma, Z. Liu, F. Zhang, F. Liu, Y. Li and R. Bordia, J. Am. Ceram. Soc., 2016, 99, 2402–2407 CrossRef CAS.
- S. Cetinkaya Colak, I. Akyuz and F. Atay, J. Non-Cryst. Solids, 2016, 432, 406–412 CrossRef CAS.
- S. Khan, G. Kaur and K. Singh, Ceram. Int., 2017, 43, 722–727 CrossRef CAS.
- J.-Z. Liu, X.-F. Wu, N.-X. Xu, Q.-L. Zhang and H. Yang, J. Mater. Sci.: Mater. Electron., 2015, 26, 8899–8903 CrossRef CAS.
- D. R. Neuville, L. Cormier and D. Massiot, Chem. Geol., 2006, 229, 173–185 CrossRef CAS.
- S. Stefanovsky, K. Fox and J. Marra, MRS Proceedings, 2013, 1518, 53–58 CrossRef.
- A. K. Yadav and P. Singh, RSC Adv., 2015, 5, 67583–67609 RSC.
- A. Saini, A. Khanna, V. K. Michaelis, S. Kroeker, F. González and D. Hernández, J. Non-Cryst. Solids, 2009, 355, 2323–2332 CrossRef CAS.
- S. Sen, Z. Xu and J. Stebbins, J. Non-Cryst. Solids, 1998, 226, 29–40 CrossRef CAS.
- K. Singh, I. Bala and V. Kumar, Ceram. Int., 2009, 35, 3401–3406 CrossRef CAS.
- J. Wan, J. Cheng and P. Lu, J. Wuhan Univ. Technol., Mater. Sci. Ed., 2008, 23, 419–421 CrossRef CAS.
- A. Winterstein-Beckmann, D. Möncke, D. Palles, E. I. Kamitsos and L. Wondraczek, J. Non-Cryst. Solids, 2014, 405, 196–206 CrossRef CAS.
- K. Rao, Structural chemistry of glasses, Elsevier, 2002 Search PubMed.
- N. Santha, T. Nideep and S. Rejisha, J. Mater. Sci.: Mater. Electron., 2012, 23, 1435–1441 CrossRef CAS.
- G. J. Mohini, N. Krishnamacharyulu, G. Sahaya Baskaran, P. V. Rao and N. Veeraiah, Appl. Surf. Sci., 2013, 287, 46–53 CrossRef CAS.
- H. Shao, H. Q. Zhou and X. D. Shen, Adv. Mater. Res., 2011, 189–193, 4466–4471 CrossRef CAS.
- A. Gaddam, H. R. Fernandes and J. M. F. Ferreira, RSC Adv., 2015, 5, 41066–41078 RSC.
- B. G. Parkinson, D. Holland, M. E. Smith, A. P. Howes and C. R. Scales, J. Phys.: Condens. Matter, 2007, 19, 415114 CrossRef CAS PubMed.
- S. H. Risbud, R. J. Kirkpatrick, A. P. Taglialavore and B. Montez, J. Am. Ceram. Soc., 1987, 70, C-10–C-12 CrossRef.
- J. H. Jean, C. R. Chang and C. D. Lei, J. Am. Ceram. Soc., 2004, 87, 1244–1249 CrossRef CAS.
- C. R. Chang and J. H. Jean, J. Am. Ceram. Soc., 1999, 82, 1725–1732 CrossRef CAS.
- R. Müller, R. Meszaros, B. Peplinski, S. Reinsch, M. Eberstein, W. A. Schiller and J. Deubener, J. Am. Ceram. Soc., 2009, 92, 1703–1708 CrossRef.
- A. Gaddam, H. R. Fernandes, M. J. Pascual, J. M. F. Ferreira and L. Pinckney, J. Am. Ceram. Soc., 2016, 99, 833–840 CrossRef CAS.
- A. Gaddam, H. R. Fernandes and J. M. Ferreira, RSC Adv., 2015, 5, 41066–41078 RSC.
- H. Doweidar, K. El-Igili and S. A. El-Maksoud, J. Phys. D: Appl. Phys., 2000, 33, 2532 CrossRef CAS.
| This journal is © The Royal Society of Chemistry 2017 |

