 Open Access Article
Protein-directed synthesis of Bi2S3 nanoparticles as an efficient contrast agent for visualizing the gastrointestinal tract†
Yan Zu,
Yuan Yong,
Xiao Zhang,
Jie Yu ,
Xinghua Dong,
Wenyan Yin
 ,
Liang Yan
 *,
Feng Zhao,
Zhanjun Gu
 and
Yuliang Zhao
CAS Key Laboratory for Biomedical Effects of Nanomaterials and Nanosafety, Institute of High Energy Physics, National Center for Nanoscience Technology of China, Chinese Academy of Sciences, Beijing 100049, People's Republic of China. E-mail: yanliang@ihep.ac.cn
First published on 21st March 2017
Abstract
Non-invasive imaging modalities such as computed tomography are often used for diagnosis and assessment of gastrointestinal (GI) disease status over the long-term. The physiology of the GI tract can be assessed with contrast agents. Here, we present common protein (bovine serum albumin, BSA) stabilized bismuth sulfide nanoparticles with robust X-ray attenuation. Under the optimal conditions, this agent can outline the anatomy of the mouse GI tract on 3D computed tomography imaging, with the real-time and non-invasive visualization of nanoparticle distribution and the GI tract. Moreover, the investigation on long-term toxicity and biodistribution of these nanoparticles after oral administration indicate their overall safety. This is a promising agent for GI visualization and disease diagnosis.
Introduction
The gastrointestinal (GI) tract is an organ system within humans and other animals, which takes in food, digests it to extract and absorb energy and nutrients, and expels the remaining waster. However, there are many diseases that can affect the gastrointestinal system, including infections, inflammation and cancer. Examination of the anatomy and pathology of the GI tract is mandatory for the diagnosis of GI diseases to ensure that patients can receive appropriate treatments and have a good quality of life. Traditional endoscope imaging with histologic evaluation of tissue biopsies has been performed frequently as a reference standard.1 Unfortunately, being time-consuming and the induction of the risk for complications heavily limit the clinical application of endoscopy. Therefore, it is necessary to develop new imaging strategies to overcome invasive procedures.2As a complement to traditional examination, non-invasive imaging modalities, such as ultrasound (US), X-ray computed tomography (CT), positron emission tomography (PET), as well as magnetic resonance imaging (MRI), have been used as powerful tools that provide clinicians with significant insights into the GI disease status, treatment efficacy and patient's prognosis.3–5 By distinguishing from the assorted imaging approaches, CT imaging is a mainstay of clinical diagnostic modality with the advantages of high resolution, no depth limitation and allowing for three-dimensional (3D) reconstruction. On the basis of the X-ray absorption coefficient rule, materials with higher density (ρ) or high atomic numbers (Z) tend to absorb more X-rays.6–10 Currently, barium (Z = 56) sulphate (BaSO4) suspension has been routinely used as a contrast agent for X-ray contrast enhancement of GI tract in clinic. However, unknown median lethal dose and incidental false positive are the main limitations of BaSO4 suspension as an oral CT contrast agent in the clinic.11 Other commonly used GI contrast agents are iodine-based molecules. However, due to the limited X-ray absorption efficiency of iodine (Z = 53), large doses of iodine-based contrast agents are required, which may cause serious iodine hypersensitivity reactions in patients if daily used.12,13 Hence, the design and synthesis of novel GI tract contrast agents with low systemic toxicity and high-efficiency imaging are of great interest and highly important.
To date, much effort has been devoted to design and fabricate novel nanomaterials as CT contrast agents, which are highly desired in attempting to achieve more complementary and accurate information of GI disease. For example, several nanosized heavy metal-based CT contrast agents, such as PEGylated W18O49 nanosheets, glutathione modified PbS nanodots, lanthanum-doped BaYbF5 up-conversional nanoparticles (NPs) and pure bismuth (Bi) NPs etc., have been successfully fabricated for the visualization of GI tract.14–17 Among them, bismuth has the largest atomic number (Z = 83) and thus bismuth-based nanomaterials hold great attraction as novel CT contrast agents because of their ultrahigh X-ray attenuation coefficient. In addition, bismuth is one of the biocompatible metals and “bismuth therapy” based on its compounds has been used in GI disease therapies in clinic for at least three centuries.18,19 Thus, bismuth-based nanomaterials may have great potential to be used as contrast agents for CT imaging in a clinical setting with high sensitivity and favorable biocompatibility. Recently, Bi2S3 NPs have been employed as CT contrast agents for in vivo diagnosis arising from their high X-ray attenuation capability, long residence time, low toxicity, no residues in the organism, and cost effectiveness.20–23 Encouraged by the ideal CT imaging property of Bi2S3 NPs, we have designed silica-coated bismuth sulfide nanorods (Bi2S3@SiO2 NRs) with good biocompatibility as a CT contrast agent for visualizing GI tract of mice.24 However, the reported Bi2S3 NPs are usually synthesized through complex procedures and thus frequently encounter additional aqueous modification, limited relaxivity, and insufficient targeting capacity.19–21,23 Thus, it is of great significance to explore a simple yet efficient method to synthesize bismuth-based nanomaterials with highly enhanced contrast efficiency and low systemic toxicity for in vivo GI tract imaging.
Herein, we developed a simple and green method using bovine serum albumin (BSA) as a template for the preparation of BSA modified Bi2S3 (BSA@Bi2S3) NPs and then applied them as CT contrast agents of GI tract of mice. In this process, BSA could act as not only a source of sulphur but also a sacrificial target to stabilize NPs either in the acidic or intestinal environment of GI tract.25–29 In our study, BSA coated on the surface of Bi2S3 NPs could decrease the unwanted leakage of bismuth ions and withstand the harsh conditions of the GI tract. With good biocompatibility and neglectable hemolysis, the as-prepared BSA@Bi2S3 NPs exhibited much significant contrast enhancement for real-time and non-invasive visualization of in vivo GI tract via CT imaging. In addition, the results of histological analysis and biodistribution indicate that the nanoparticles are able to pass through the GI tract without inducing significant toxicological effects. Thus, the BSA@Bi2S3 NPs can be applied as a promising candidate of CT contrast agents for visualization of GI tract in vivo.
Experimental
Materials
All reagents were of analytical grade and were used as received without further purification. Bovine serum albumin (BSA, fraction V) was bought from Sangon Biotech Co., Ltd. (Shanghai, China). Bi(NO3)3·5H2O was purchased from Alfa Aesar (Shanghai, China). BaSO4 was purchased from Qingdao Dongfeng Chemical Co., Ltd. Sodium hydroxide (NaOH) was supplied by Beijing Chemical Reagent Co. China. Deionized water was obtained from a recirculating deionized water system (SHRO-plus DI, 18.2 MΩ cm at 25 °C).Characterization
The morphology and elements distribution of NPs were observed using field emission transmission electron microscopes (TEM, Tecnai G2 F20 U-TWIN) coupled with energy dispersive X-ray spectroscopy (EDS) analysis. Powder X-ray diffraction (XRD) patterns of the dried products were measured using a Japan Rigaku D/max-2500 diffractometer with Cu Kα radiation (λ = 1.5418 Å). Fourier transform infrared (FT-IR) spectra were recorded on an infrared spectrometer (iN10-iZ10, Thermo Fisher). All photographs were taken by Nikon D3100 digital camera. The contents of bismuth element in samples were measured using inductively coupled plasma mass spectrometry (ICPMS, Thermo Elemental X7, USA).Preparation of BSA@Bi2S3 NPs
In a typical route, BSA was selected as the model protein for the synthesis of BSA@Bi2S3 NPs. Briefly, aqueous Bi(NO3)3 (2.8 mL in 3 M HNO3 solution, 25 mM, 25 °C) was added dropwise into BSA solution (40 mL, 66 mg mL−1, 25 °C) under vigorous stirring. After 2 min, NaOH solution (6 mL, 5 M) was introduced and the color of the solution began to change from pale yellow to light brown, and then to dark black in 10 min (Fig. S1†). The resulting mixture was then incubated at 25 °C for another 12 h for complete reaction. Finally, the obtained BSA@Bi2S3 NPs were purified by the dialysis of the solution against Milli-Q water for 48 h to remove any possible remnant.Leaching the leakage of bismuth ions from BSA@Bi2S3 NPs
To evaluate the resistance ability of the GI tract environment of BSA@Bi2S3 NPs, different pH buffer solutions (2.00 and 8.00) were prepared to mimic the environment of GI system. 150 mg of BSA@Bi2S3 NPs were immersed in 15 mL of various buffer solutions (with the concentration 10 mg mL−1 of BSA@Bi2S3 NPs) for 2 days. Then, the solutions of BSA@Bi2S3 NPs were centrifuged at 60![[thin space (1/6-em)]](https://www.rsc.org/images/entities/char_2009.gif) 000 rpm for 30 min. To assess the leakage of bismuth element, the supernatants were collected for ICP-MS analysis.
000 rpm for 30 min. To assess the leakage of bismuth element, the supernatants were collected for ICP-MS analysis.
In vitro CT imaging
To assess CT contrast efficiency, various concentrations of BSA@Bi2S3 NPs were dissolved in the 0.5% agarose gel solution and then set in the 1.5 mL centrifuge tubes for in vitro CT signal detection. For comparison, the corresponding concentrations of BaSO4 suspension were used as the control group. The Gamma Medica-Ideas instrument was employed to accomplish CT imaging, and the Triumph TM X–O TM CT system was further used to obtain the Hounsfield unit values and CT images. The imaging parameters were as follows: effective pixel size, 80 kV, 50 μm, 270 μA; field of view, 1024 pixels × 1024 pixels.In vitro toxicology
HeLa cells (human cervical cancer cells) and BGC-823 cells (human gastric carcinoma cells) were grown in 96-well culture plates with the culture mediums DMEM and RPMI 1640 supplemented with 10% FBS at 37 °C under a humidified 5% CO2 atmosphere, respectively. Cell viabilities were evaluated using the Cell Counting Kit-8 (CCK-8, Dojindo Laboratories, Shanghai, China) assay. The evaluation was performed as follows. Cells were cultured in a 96-well plate at a density of 1 × 10⁴ cells per well. The cells were washed twice with phosphate-buffered saline (PBS, pH = 7.40) and incubated with different concentrations of BSA@Bi2S3 NPs for 24 h. Subsequently, 10 μL of fresh CCK-8 was added into the culture medium, and the cells were incubated for an additional 1.5 h (37 °C under 5% CO2). Finally, the microplate reader (Thermo Scientific, MULTISCAN MNK3) was used to measure the absorbance of the samples at the characteristic peak of 450 nm.In vitro hemolysis assay
To evaluate the in vitro biocompatibility, 1 mL of blood samples (obtained from mice), which were stabilized by ethylenediaminetetraacetic acid (EDTA), was added to 2 mL of PBS, and red blood cells (RBCs) were separated from serum by centrifugation at 2000 rpm for 10 min, washed several times with PBS, and then diluted into 10 mL of PBS. Then, 0.2 mL of diluted red blood cells suspension was taken out to mix with (i) 0.8 mL of PBS as a negative control, (ii) 0.8 mL of deionized water as a positive control, and (iii) 0.8 mL of BSA@Bi2S3 NPs dispersions at concentrations ranging from 0 to 250 μg mL−1. Afterward, all the mixtures were vortexed and kept at room temperature for 4 h and then centrifuged at 12![[thin space (1/6-em)]](https://www.rsc.org/images/entities/char_2009.gif) 000 rpm for 5 min. The absorbance of supernatants at 541 nm was measured by UV-vis spectroscopy. The hemolysis percent of RBCs was calculated using the following equation:
000 rpm for 5 min. The absorbance of supernatants at 541 nm was measured by UV-vis spectroscopy. The hemolysis percent of RBCs was calculated using the following equation:where Asample, Anegative, and Apositive are the absorbance of the samples, negative control, and positive control, respectively.
Animals
Male BALB/c mice (8 weeks, 18–23 g) were purchased from Beijing Vitalriver Experimental Animal Technology Co. Ltd and housed in stainless steel cages under the standard conditions with a 12 h light/dark cycle. Distilled water and sterilized food for mice were available ad libitum. All procedures used in this experiment were performed in compliance with the guidelines of institutional animal care and use committee (Institute of High Energy Physics, Beijing, China) and approved by the ethical committee of the CAS Key Laboratory for Biomedical Effects of Nanomaterials and Nanosafety (China).In vivo CT imaging of GI tract
In vivo CT imaging was performed on small mice X-ray CT (Gamma Medica-Ideas). Imaging parameters: field of view (78.92 mm × 78.92 mm), slice thickness 154 μm, effective pixel size 50 μm, tube current 270 μA, tube voltage 80 kV. The reconstruction was done by the Filtered Back Projection (FBP) method. The reconstruction kernel used a Feldkamp cone beam correction and Shepp–Logan filter. The CT images were analyzed using BALB/c mice were treated with a BSA@Bi2S3 NPs solution or BaSO4 suspension with a concentration of 20 mg mL−1 by oral administration prior to imaging. Thereafter, BALB/c mice were imaged by a small animal X-ray CT at different intervals (0, 5 min, 30 min, 1 h, 2 h, 3 h, 4 h and 1 day). The mice whole body 360° scan lasted for 10 min.Biodistribution of BSA@Bi2S3 NPs via oral administration
To understand the digestion process of BSA@Bi2S3 NPs, the BALB/c mice (n = 4 each time point) were orally administered with a certain volume of BSA@Bi2S3 NPs solution (20 mg mL−1) at different time points. The major tissues and organs, including heart, liver, spleen, lungs, kidneys and stomach, intestine and caecum, were weighed and dissolved in 5 mL of concentrated nitric acid solution (HNO3, BV-III). The samples were then heated to 180 °C for 2 h. Subsequently, 2 mL of concentrated nitric acid solution was added. When the solution cleared and cooled to room temperature, 1 mL of H2O2 solution was added to neutralize the nitric acid solution. The resulting solution was diluted with 2% HNO3 (V/V0) to 5.0 mL and analyzed by induced coupled plasma mass spectrometry (Thermo Elemental X7, USA) to evaluate the remaining of bismuth element in each organ or tissue.Body weight measurements
For in vivo body weight measurements, the BALB/c mice (n = 4 each time point) were orally administered with a certain volume of BSA@Bi2S3 NPs solution (20 mg mL−1). The body weights of these mice in above two groups were recorded for 28 days.Histology analysis using H&E staining
For histology studies, mice were sacrificed 28 days after oral administration of a certain volume of BSA@Bi2S3 NPs solution (20 mg mL−1). Main organs including heart, spleen, liver, lung, kidney, stomach, intestine and caecum were collected. These organs were weighed, set and fixed in 4% paraformaldehyde solution, processed in paraffin, sectioned and stained with H&E. The representative H&E images were analyzed with an inverted fluorescence microscope (Olympus X73, Japan).Blood hematology and biochemistry analysis
Blood samples were collected from the mice fundus artery after oral administration of a certain volume of BSA@Bi2S3 NPs solution (20 mg mL−1). Approximately 100 μL of the collected blood sample solution was set in the anticoagulant tub (potassium EDTA collection tube) for hematology analysis. One milliliter of the residual blood was collected from each mouse, set at room temperature for 2 h, and then centrifuged at 1500 rpm for 5 min to remove blood cells. The obtained blood plasma was used for the biochemistry test. The analyses of biochemistry and blood hematology were finished at the animal department of the Peking University medical laboratory.Statistical analysis
All data were expressed in this article as mean result ± standard deviation (SD). All figures shown in the present work were obtained from several independent experiments with similar results. The statistical analysis was performed by using Origin 8.0 software.Results and discussion
The synthesis of BSA@Bi2S3 NPs and characterization
BSA is the most abundant plasma protein that has been widely used in bionanotechnology applications such as sensing, self-assembly, and imaging.30 Our preparation process of BSA@Bi2S3 NPs is very similar to the biomineralization behavior of organisms in nature: sequestering and interacting with inorganic ions, followed by providing scaffolds for minerals formed, mostly through functional proteins.30–33 As shown in Scheme 1, upon adding Bi3+ ions to aqueous BSA solution, the protein molecules sequestered Bi3+ ion and entrapped them, forming BSA-Bi3+ complexes in the weak acid environment (pH ∼ 4.00). By adjusting the reaction pH to ∼12.00, BSA can be denatured to release numerous residues such as 35 cysteine residues which is an excellent sulfur source for forming Bi2S3 NPs.25,34,35 The as-prepared Bi2S3 NPs were stabilized within BSA molecules as BSA@Bi2S3 bioconjugates. Besides the good biocompatibility, the BSA coating layer on Bi2S3 NPs allows the functionalities on the surface of the nanomaterial for further biological interactions or couplings.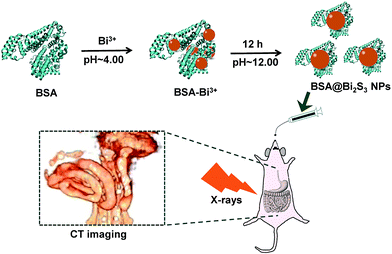 | ||
| Scheme 1 Schematic illustration of the synthetic routine of BSA@Bi2S3 NPs and their CT imaging of GI tract. | ||
Typical transmission electron microscope (TEM) image of the as-synthesized BSA@Bi2S3 NPs showed a uniform size with diameter of about 1–3 nm (Fig. 1a). X-ray diffraction (XRD), energy dispersive X-ray spectroscopy (EDS), and X-ray photoelectron spectroscopy (XPS) were conducted to investigate the chemical composition and purity of the as-prepared BSA@Bi2S3 NPs. Although the X-ray diffraction peaks are poorly resolved as shown in Fig. S2,† the general diffraction patterns are still matched with those of pure Bi2S3 orthorhombic phase found in JCPDS 17-0320. EDS results confirmed that Bi and S were detected in the samples which came from Bi2S3 NPs. Meanwhile, C and O probably came from both the carbon-coated copper grid and BSA protein on the surface of the NPs (Fig. 1b). XPS was employed to identify the oxidation state and composition of BSA@Bi2S3 NPs. The atomic ratio of Bi![[thin space (1/6-em)]](https://www.rsc.org/images/entities/char_2009.gif) :
:![[thin space (1/6-em)]](https://www.rsc.org/images/entities/char_2009.gif) S was approximately 2
S was approximately 2![[thin space (1/6-em)]](https://www.rsc.org/images/entities/char_2009.gif) :
:![[thin space (1/6-em)]](https://www.rsc.org/images/entities/char_2009.gif) 2.6, close to the stoichiometric ratio of BSA@Bi2S3 NPs. As shown in Fig. 1c, two peaks at 158.1 eV and 163.3 eV corresponded to Bi 4f7/2 and Bi 4f5/2 peaks of Bi3+, respectively. Another two weak peaks at 160.1 eV and 162 eV was assigned to S 2p.36 No peaks were detected for metallic Bi and other impurities, which indicates the high purity of the as-prepared BSA@Bi2S3 NPs. Fourier transform infrared (FT-IR) spectroscopy was also adopted to analyze the resulting NPs (Fig. 1d). The bands of BSA@Bi2S3 NPs are in the same regions and have the same features as those of the pure BSA. Since BSA molecules remained anchoring on the nanoparticle surface, the resulting NPs were well stable in water and biocompatible. Moreover, the result of FT-IR spectra also implied that the encapsulation of NPs in BSA molecules did not seem to affect the structure of the BSA scaffolds. Meanwhile, this also facilitates post-synthesis surface modifications with other ligands. The DLS analysis indicated there was no significant change for the size of BSA@Bi2S3 NPs and they were still well dispersed in water, buffer solution (pH 2.00 and 8.00), DMEM cell medium and DMEM cell medium containing 10% FBS after 24 h (Fig. S3†). The favorable colloidal stability ensures their practicability for their biomedical applications.
2.6, close to the stoichiometric ratio of BSA@Bi2S3 NPs. As shown in Fig. 1c, two peaks at 158.1 eV and 163.3 eV corresponded to Bi 4f7/2 and Bi 4f5/2 peaks of Bi3+, respectively. Another two weak peaks at 160.1 eV and 162 eV was assigned to S 2p.36 No peaks were detected for metallic Bi and other impurities, which indicates the high purity of the as-prepared BSA@Bi2S3 NPs. Fourier transform infrared (FT-IR) spectroscopy was also adopted to analyze the resulting NPs (Fig. 1d). The bands of BSA@Bi2S3 NPs are in the same regions and have the same features as those of the pure BSA. Since BSA molecules remained anchoring on the nanoparticle surface, the resulting NPs were well stable in water and biocompatible. Moreover, the result of FT-IR spectra also implied that the encapsulation of NPs in BSA molecules did not seem to affect the structure of the BSA scaffolds. Meanwhile, this also facilitates post-synthesis surface modifications with other ligands. The DLS analysis indicated there was no significant change for the size of BSA@Bi2S3 NPs and they were still well dispersed in water, buffer solution (pH 2.00 and 8.00), DMEM cell medium and DMEM cell medium containing 10% FBS after 24 h (Fig. S3†). The favorable colloidal stability ensures their practicability for their biomedical applications.
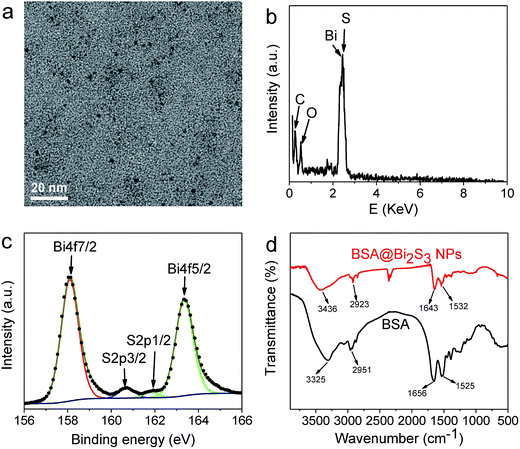 | ||
| Fig. 1 Characterization of BSA@Bi2S3 NPs. (a) TEM image, (b) EDS spectrum, (c) XPS spectra overlaid with fitting curves for Bi 4f and S 2p, (d) FT-IR spectra. | ||
CT imaging in vitro
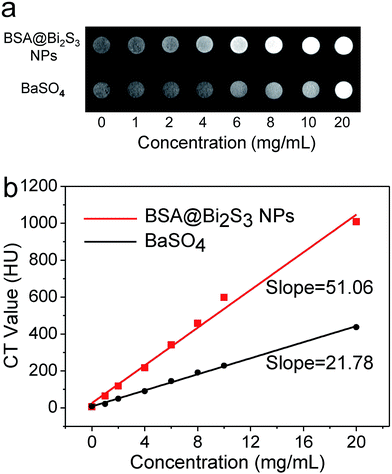
Since bismuth element has a higher photoelectric absorption coefficient than I, Ba, and Au, Bi-based NPs have alternative potentiality for use as a CT contrast agent.37 This is clearly demonstrated from the determined Hounsfield units (HU) values of BSA@Bi2S3 NPs with various concentrations. As shown in Fig. 2, the HU values linearly increased with the concentration of BSA@Bi2S3 NPs, and its slope was about 51.06, which is much higher than that of BaSO4 (21.78). The above results indicate that BSA@Bi2S3 NPs can provide an equivalent contrast at a lower dose relative to clinical BaSO4 suspension. The reduced dose in administration is highly favorable as it could significantly minimize the side effects in patients.Stability assessment and biocompatibility
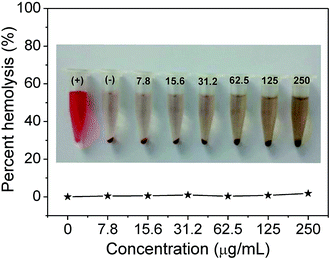
Firstly, to assess whether the as-prepared NPs could withstand harsh acidic environment of GI tract, the pH stability of BSA@Bi2S3 NPs was investigated. The leaching of Bi3+ ions was insignificant after 2 days incubation in simulated stomach fluids (pH 2.00) and a simulated intestine fluids (pH 8.00) (Fig. S4†). Besides, biocompatibility is an essential concern when it comes to the development of nanomaterials for biomedical application. Viabilities of two kinds of cells, including HeLa cell line (human cervical cancer cells) and BGC-823 cell line (human gastric carcinoma cells), were measured after exposed to BSA@Bi2S3 NPs. CCK assay showed that the cell viabilities associated with Hela cells and BGC 823 cells were not influenced by BSA@Bi2S3 NPs up to a concentration of 100 μg mL−1 (Fig. 3a and b). In addition, we also investigated the influence of BSA@Bi2S3 NPs on hemolytic behavior of red blood cells (RBCs) to further evaluate their hemocompatibility, where deionized water and PBS were denoted as positive and negative controls, respectively. It is found that negligible hemolysis of RBCs is detected, indicating that BSA@Bi2S3 NPs possess admirable blood compatibility (Fig. 4). These results demonstrate the excellent stability in harsh GI tract conditions and good biocompatibility of BSA@Bi2S3 NPs.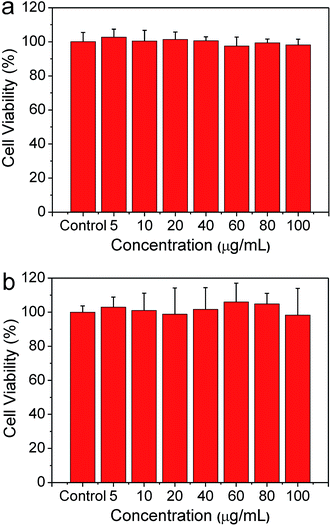 | ||
| Fig. 3 Viabilities of (a) Hela cells and (b) BGC-823 cells incubated with BSA@Bi2S3 NPs with different concentrations for 24 h. | ||
In vivo CT imaging of GI tract
Based on the above results, we then assessed the feasibility of BSA@Bi2S3 NPs as a CT contrast agent to visualize the GI tract. The 3D-renderings CT images of GI tract show the process of BSA@Bi2S3 NPs through the GI tract (Fig. 5). The main organs of digestive system, including stomach, duodenum and a few loops of the small intestine, began to be bright obviously at 5 min after oral administration of the contrast agent. After 30 min, the small intestine was lighted up due to the presence of much more BSA@Bi2S3 NPs. More importantly, the arrangement and sequence of the small intestinal loops could be described clearly. This is particularly valuable for the detection of inflammatory and neoplastic intestinal lesions, and allows accurate detection of extra-intestinal findings.3,38 In contrast, the perfuse effect of BaSO4 suspension to visualize stomach and intestine was unsatisfactory due to its innate insolubility (Fig. S5†). At 180 min after the administration of BSA@Bi2S3 NPs, the small intestinal empting advanced significantly and large intestine began to be filled with NPs. After 1 day, almost all the BSA@Bi2S3 NPs were excreted from the body and only a small amount of the NPs were in the big intestine. Except visualizing the BSA@Bi2S3 NPs distribution in GI tract of mice by the 3D CT images, we also investigated the CT values (HU) of GI tract of mice after oral administration of the NPs. The HU value of the stomach reached the maximum 1304.12 at 5 min after oral administration of BSA@Bi2S3 NPs and then gradually became weak. Meanwhile, the HU value of the intestine gradually increased and reached the maximum 1120.5 at 2 h after the oral administration (Fig. S6a†). In addition, the CT values of the stomach and intestine using BSA@Bi2S3 NPs as contrast agent in GI tract were much higher than that of BaSO4 suspension as contrast agent in GI tract, which was consistent with the comparison of CT images (Fig. S6b†). The above results reveal that BSA@Bi2S3 NPs have a great potential to be used for enhanced CT imaging of the GI tract.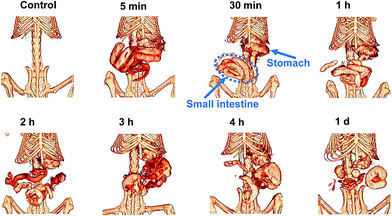 | ||
| Fig. 5 CT imaging of GI tract in vivo. In vivo X-ray CT imaging of GI tract in BALB/c mice at different intervals after oral administration of BSA@Bi2S3 NPs (20 mg mL−1). | ||
In vivo toxicity
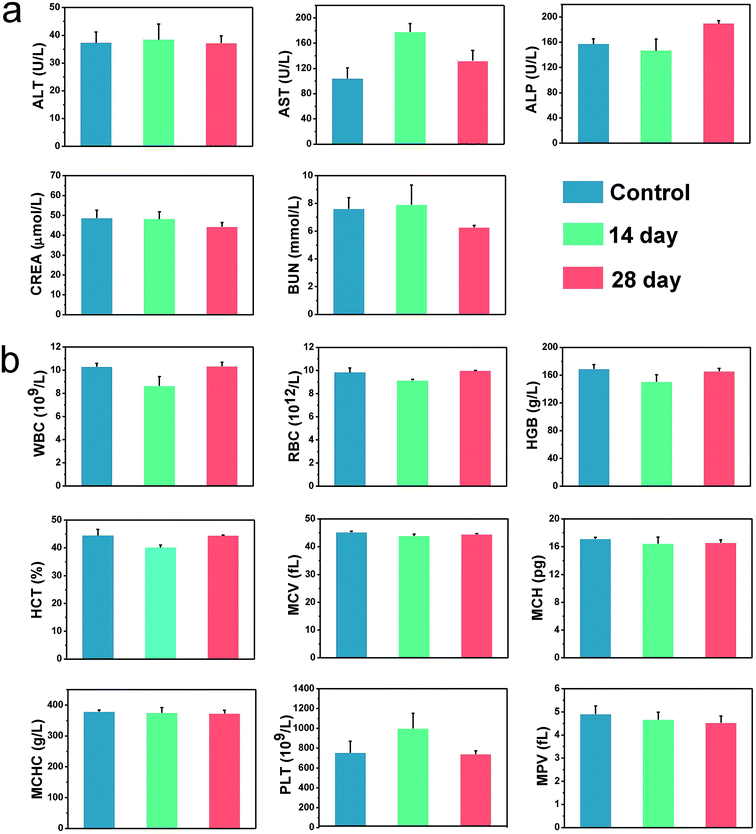
Safety of the nanomaterials is an essential concern when it comes to the design of them for biomedical applications.39–43 Therefore, we then performed a series of experiments in vivo, including the body weight, histological analysis, biodistribution, blood biochemistry and hematology analysis, to ensure the safe application of BSA@Bi2S3 NPs. The results in Fig. S7† reveal that the body weights of mice with oral BSA@Bi2S3 NPs decreased in the first 5 days and then the growth rate of body weight gradually increased and became normal compared with the control group, suggesting that the BSA@Bi2S3 NPs exhibited no long-term systemic effects at the given dose. Histological analysis via hematoxylin and eosin-stained images further revealed that no noticeable tissue damage and adverse effect to these organs could be observed for BSA@Bi2S3 NPs treated groups compared with the control group (Fig. 6 and S8†) at 28 day. The biodistribution results indicate that there is no significant accumulation of BSA@Bi2S3 NPs in the major organs such as heart, liver, spleen, lungs and kidney, but there is only a small quantity of BSA@Bi2S3 NPs in the caecum after 28 days (Fig. S9†). This may be because NPs are in direct contact with GI environment and the caecum has a physiologically complex structure, making it the target organ for the NPs. The NPs pass through the GI tract following the order: stomach, small intestine, caecum and finally the large intestine. They appear to overcome the stomach medium and target the caecum specifically. This biodistribution pattern could inspire us to develop their applications further in GI nanomedicine.44 Liver injury markers such as alanine aminotransferase (ALT), aspartate aminotransferase (AST), and alkaline phosphatase (ALP) were also evaluated to investigate the risks of BSA@Bi2S3 NPs. Although there was a slight disorder in AST at 14 day, all values of ALT and ALP were rather comparable with those of the control group. In addition, the indicators of kidney injury such as urea and creatinine were at regular intervals. These results suggest that BSA@Bi2S3 NPs show no noticeable renal dysfunction induced by the NPs (Fig. 7a). The result of hematology analysis also exhibits that the parameters of several important hematology markers in the test group appear to be nearly normal compared to the control group (Fig. 7b). These preliminary results prove that NPs have low toxicity to mice at our tested dose. Therefore, the proposed high-performance BSA@Bi2S3 NPs held high biocompatibility and low systemic toxicity in vivo, in accordance with the results from in vitro study.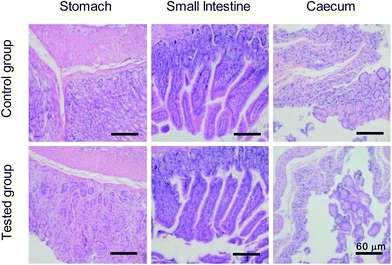 | ||
| Fig. 6 H&E stained images of main organs of GI tract collected from mice 28 days after orally administration of BSA@Bi2S3 NPs with the concentration of 20 mg mL−1. | ||
Conclusion
In summary, we have fabricated a simple yet efficient method for preparation of BSA coated Bi2S3 NPs. Both in vitro and in vivo studies demonstrated that the resulting BSA@Bi2S3 NPs showed good biocompatibility and had the ability of withstanding the harsh environments in GI tract. Moreover, owing to their ultrahigh efficiency in absorbing X-ray, BSA@Bi2S3 NPs can be applied for CT imaging of GI tract, realizing the visualization of gastrointestinal structures, such as the sequence and arrangement of the small intestinal loops. The above results suggest that BSA@Bi2S3 NPs may pave an alternative way for fabrication of the CT contrast agent for direct and non-invasive visualization of GI tract with low toxicity.Author contributions
Yan Zu and Yuan Yong contributed equally to the work in writing the main manuscript text, performing the experiments and preparing the figures, Xiao Zhang, Jie Yu, Xinghua Dong, Wenyan Yin and Feng Zhao helped to analyze the data and provide constructive discussions. Liang Yan, Zhanjun Gu and Yuliang Zhao designed and supervised the research project and revised this paper. All authors reviewed the manuscript.Acknowledgements
This work was supported by the National Natural Science Foundation of China (31600815, 11621505, 21320102003), Innovation Program of the Chinese Academy of Sciences (QYZDJ-SSW-SLH022) and Youth Innovation Promotion Association CAS (2013007).References
- V. Annese, M. Daperno, M. D. Rutter, A. Amiot, P. Bossuyt, J. East, M. Ferrante, M. Götz, K. H. Katsanos, R. Kießlich, I. Ordás, A. Repici, B. Rosa, S. Sebastian, T. Kucharzik and R. Eliakim, J. Crohns Colitis, 2013, 7, 982–1018 CrossRef PubMed.
- B. P. Joshi and T. D. Wang, Nat. Rev. Gastroenterol. Hepatol., 2016, 13, 72–73 CrossRef CAS PubMed.
- J. B. Frøkjær, A. M. Drewes and H. Gregersen, World J. Gastroenterol., 2009, 15, 160–168 CrossRef.
- L. A. Jelicks, J. Neuroparasitology, 2010, 1, N100504 Search PubMed.
- J. V. Jokerst, Nat. Nanotechnol., 2014, 9, 569–570 CrossRef CAS PubMed.
- H. Lusic and M. W. Grinstaff, Chem. Rev., 2013, 113, 1641–1666 CrossRef CAS PubMed.
- Y. Liu, K. Ai and L. Lu, Acc. Chem. Res., 2012, 45, 1817–1827 CrossRef CAS PubMed.
- M. H. Oh, N. Lee, H. Kim, S. P. Park, Y. Piao, J. Lee, S. W. Jun, W. K. Moon, S. H. Choi and T. Hyeon, J. Am. Chem. Soc., 2011, 133, 5508–5515 CrossRef CAS PubMed.
- Z. Liu, Z. Li, J. Liu, S. Gu, Q. Yuan, J. Ren and X. Qu, Biomaterials, 2012, 33, 6748–6757 CrossRef CAS PubMed.
- K. Dong, E. Ju, J. Liu, X. Han, J. Ren and X. Qu, Nanoscale, 2014, 6, 12042–12049 RSC.
- R. S. Kwon, D. V. Sahan and W. R. Brugge, Gastroenterology, 2005, 128, 1538–1553 CrossRef.
- K. E. deKrafft, Z. Xie, G. Cao, S. Tran, L. Ma, O. Z. Zhou and W. Lin, Angew. Chem., Int. Ed., 2009, 48, 9901–9904 CrossRef CAS PubMed.
- F. Hallouard, N. Anton, P. Choquet, A. Constantinesco and T. Vandamme, Biomaterials, 2010, 31, 6249–6268 CrossRef CAS PubMed.
- Z. Liu, E. Ju, J. Liu, Y. Du, Z. Li, Q. Yuan, J. Ren and X. Qu, Biomaterials, 2013, 34, 7444–7452 CrossRef CAS PubMed.
- Z. Liu, J. Liu, R. Wang, Y. Du, J. Ren and X. Qu, Biomaterials, 2015, 56, 206–218 CrossRef CAS PubMed.
- Z. Liu, X. Ran, J. Liu, Y. Du, J. Ren and X. Qu, Biomaterials, 2016, 100, 17–26 CrossRef CAS PubMed.
- B. X. Wei, X. J. Zhang, C. Zhang, Y. Jiang, Y. Y. Fu, C. S. Yu, S. K. Sun and X. P. Yan, ACS Appl. Mater. Interfaces, 2016, 8, 12720–12726 CAS.
- S. L. Gorbach, Gastroenterology, 1990, 99, 863–875 CrossRef CAS.
- K. D. Mjos and C. Orvig, Chem. Rev., 2014, 114, 4540–4563 CrossRef CAS PubMed.
- J. Liu, X. Zheng, L. Yan, L. Zhou, G. Tian, W. Yin, L. Wang, Y. Liu, Z. Hu, Z. Gu, C. Chen and Y. Zhao, ACS Nano, 2015, 9, 696–707 CrossRef CAS PubMed.
- K. Ai, Y. Liu, J. Liu, Q. Yuan, Y. He and L. Lu, Adv. Mater., 2011, 23, 4886–4891 CrossRef CAS PubMed.
- O. Rabin, J. M. Perez, J. Grimm, G. Wojtkiewicz and R. Weissleder, Nat. Mater., 2006, 5, 118–122 CrossRef CAS PubMed.
- J. M. Kinsella, R. E. Jimenez, P. P. Karmali, A. M. Rush, V. R. Kotamraju, N. C. Gianneschi, E. Ruoslahti, D. Stupack and M. J. Sailor, Angew. Chem., Int. Ed., 2011, 50, 12308–12311 CrossRef CAS PubMed.
- X. Zheng, J. Shi, Y. Bu, G. Tian, X. Zhang, W. Yin, B. Gao, Z. Yang, Z. Hu, X. Liu, L. Yan, Z. Gu and Y. Zhao, Nanoscale, 2015, 7, 12581–12591 RSC.
- Y. Wang, Y. Wu, Y. Liu, J. Shen, L. Lv, L. Li, L. Yang, J. Zeng, Y. Wang, L. W. Zhang, Z. Li, M. Gao and Z. Chai, Adv. Funct. Mater., 2016, 26, 5335–5344 CrossRef CAS.
- C. B. Woitiski, R. J. Neufeld, A. J. Ribeiro and F. Veiga, Acta Biomater., 2009, 5, 2475–2484 CrossRef CAS PubMed.
- C. B. Woitiski, B. Sarmento, R. A. Carvalho, R. J. Neufeld and F. Veiga, Int. J. Pharm., 2011, 412, 123–131 CrossRef CAS PubMed.
- H. Sinnecker, K. Ramaker and A. Frey, Beilstein J. Nanotechnol., 2014, 5, 2308–2315 CrossRef PubMed.
- M. Lopes, N. Shrestha, A. Correia, M.-A. Shahbazi, B. Sarmento, J. Hirvonen, F. Veiga, R. Seiça, A. Ribeiro and H. A. Santos, J. Controlled Release, 2016, 232, 29–41 CrossRef CAS PubMed.
- J. Xie, Y. Zheng and J. Y. Ying, J. Am. Chem. Soc., 2009, 131, 888–889 CrossRef CAS PubMed.
- Y. Cui, C. Zhang, L. Sun, Z. Hu and X. Liu, RSC Adv., 2015, 5, 10014–10017 RSC.
- B. H. McDonagh, G. Singh, S. Bandyopadhyay, S. M. Lystvet, J. A. Ryan, S. Volden, E. Kim, I. Sandvig, A. Sandvig and W. R. Glomm, RSC Adv., 2015, 5, 101101–101109 RSC.
- T. Yang, Y. Wang, H. Ke, Q. Wang, X. Lv, H. Wu, Y. Tang, X. Yang, C. Chen, Y. Zhao and H. Chen, Adv. Mater., 2016, 28, 5923–5930 CrossRef CAS PubMed.
- J. Xiang, H. Cao, Q. Wu, S. Zhang, X. Zhang and A. A. R. Watt, J. Phys. Chem. C, 2008, 112, 3580–3584 CAS.
- B. Zhang, X. Ye, W. Hou, Y. Zhao and Y. Xie, J. Phys. Chem. B, 2006, 110, 8978–8985 CrossRef CAS PubMed.
- J. Grigas, E. Talik and V. Lazauskas, Phys. Status Solidi B, 2002, 232, 220–230 CrossRef CAS.
- N. Lee, S. H. Choi and T. Hyeon, Adv. Mater., 2013, 25, 2641–2660 CrossRef CAS PubMed.
- E. R. Ryan and I. S. E. Heaslip, Abdom. Imaging, 2008, 33, 34–37 CrossRef PubMed.
- M. T. Zhu, G. J. Nie, H. Meng, T. Xia, A. Nel and Y. L. Zhao, Acc. Chem. Res., 2013, 46, 622–631 CrossRef CAS PubMed.
- N. Latiff, W. Z. Teo, Z. Sofer, S. Huber, A. C. Fisher and M. Pumera, RSC Adv., 2015, 5, 67485–67492 RSC.
- S. Aula, S. Lakkireddy, K. Jamil, A. Kapley, A. V. N. Swamy and H. R. Lakkireddy, RSC Adv., 2015, 5, 47830–47859 RSC.
- N. Chen, Z. Song, H. Tang, W. Xi, A. Cao, Y. Liu and H. Wang, Int. J. Mol. Sci., 2016, 17, 974 CrossRef PubMed.
- F. Zhao, H. Meng, L. Yan, B. Wang and Y. Zhao, Sci. Bull., 2015, 60, 3–20 CrossRef CAS.
- M. Martin, A. Rodriguez-Nogales, V. Garces, N. Galvez, L. Gutierrez, J. Galvez, D. Rondon, M. Olivares and J. M. Dominguez-Vera, Nanoscale, 2016, 8, 15041–15047 RSC.
Footnote |
| † Electronic supplementary information (ESI) available. See DOI: 10.1039/c7ra01526g |
| This journal is © The Royal Society of Chemistry 2017 |


