 Open Access Article
Creative Commons Attribution 3.0 Unported Licence
Kx(C2H8N2)yFe2−zS2: synthesis, phase structure and correlation between K+ intercalation and Fe depletion†
Zhongnan Guo‡
a,
Liang Zhou‡a,
Shifeng Jinb,
Bingling Hana,
Fan Suna and
Wenxia Yuan *a
*a
aDepartment of Chemistry, School of Chemistry and Biological Engineering, University of Science and Technology Beijing, Beijing 100083, China. E-mail: wxyuanwz@163.com
bResearch & Development Center for Functional Crystals, Beijing National Laboratory for Condensed Matter Physics, Institute of Physics, Chinese Academy of Sciences, Beijing 100190, China
First published on 21st March 2017
Abstract
We report a new layered FeS compound Kx(C2H8N2)yFe2−zS2 synthesized by intercalating K and C2H8N2 into tetragonal FeS via a simple sonochemical route. This new compound crystallizes in a body-centered tetragonal unit cell, with the [K(C2H8N2)] and [FeS] layers alternately stacking along the c direction. The nominal concentration of K, x, can be adjusted from 0.25 to 0.45, and the lattices a and c contract from 3.6971(9) and 20.667(5) Å to 3.691(1) and 20.566(7) Å, respectively. When x < 0.25, the parent FeS is residual and when x > 0.45, K reacts with FeS directly to form K2Fe4S5 impurity. It is found that the C2H8N2 molecule has been co-intercalated in between the [FeS] layers along with K, evidenced by its content, y, having a linear dependence with x. Measurements indicate that Kx(C2H8N2)yFe2−zS2 is a semiconductor and it shows a weak ferrimagnetism below 50 K. More importantly, Fe depletion resulting from the charged K+ intercalation was revealed by composition analysis, which leads to the formation of disordered Fe vacancies in the [FeS] layers and hence hinders the enhancement of original superconductivity in the FeS parent.
Introduction
Tetragonal Fe chalcogenides (FeChs, Ch = Se, S and Te) have attracted great attention in recent years due to the discovery of high-temperature superconductivity in these materials.1–3 These layered FeChs consist of quasi-two dimensional [FeCh] layers, stacking along the c direction and forming the anti-PbO type structure.4 Considering the interaction between layers is the weak van der Waals force, these chalcogenides can be easily operated as the “hosts” for various chemical intercalation by metals, hydroxides and organic molecules.5–8 For example, Guo et al., first reported the potassium intercalation of tetragonal FeSe by solid state reaction, with the space group switching from P4/nmm to I4/mmm, and the critical temperature of superconductivity Tc increasing from 8.5 K to 31 K.5 The significant enhancement of superconductivity is considered to result from the electron doping from the charged K+ intercalation.9 This FeSe-based intercalated family has been rapidly expanded by intercalating several alkali, alkaline-earth and even rare-earth metals into layered FeSe with the liquid ammonia route, resulting in the maximum Tc = 46 K.6,10,11 The organic amines (C2H8N2 and C6H16N2) have also been used as the solvents to induce Li/Na in between the [FeSe] layers, leading to the extremely large [FeSe] layer distances (from 8.7 to 11.4 Å).7,12–15 Additionally, Lu et al. intercalated lithium hydroxide in FeSe using the hydrothermal synthesis. The product (Li1−xFexOH)FeSe with P4/nmm space group shows a favourable stability in the atmosphere and a coexistence of superconductivity and magnetic ordering.8,16As the isologue of FeSe, tetragonal FeS shows the same layered structure with a smaller unit cell compared with the selenide. Since tetragonal FeS is a metastable phase (stabilized below 300 °C), the synthesis needs to be operated in relatively low temperature range.17–19 Lai et al., reported the superconductivity in FeS (Tc = 4.5 K) based on the sample from hydrothermal method,2 and the layered nature makes the parent FeS to be another potential host for intercalation. However, compared to the FeSe-based materials, the chemical intercalation in between tetrahedral FeS layers is still limited. The alkali metal K was used by solid state method to synthesize K0.8Fe1.7S2.20 The other two “guest layers”, LiOH and Fe (with NH3) were carried out by hydrothermal reaction, forming (Li1−xFexOH)FeS and Fe0.25(NH3)Fe2S2, respectively.21–23 More importantly, superconductivity in tetragonal FeS was reported to be unexpectedly degraded after chemical intercalation, contrary to FeSe-based materials. K0.8Fe1.7S2, (Li1−xFexOH)FeS and Fe0.25(NH3)Fe2S2 all showed semiconducting behaviour in the low temperature range with the superconductivity totally disappeared.20–23 Very recently, two research groups reported the observation of superconductivity in (Li1−xFexOH)FeS independently by improving synthesis method, with Tc = 2.7 and 3.5 K respectively,24,25 which are still lower than that of the parent FeS. In this sense, the family of FeS intercalates may need to be enlarged, which requires more diverse synthesis method. And the effect of intercalation on superconductivity in layered FeS needs to be understood, which is important for developing the superconducting FeS-based family.
Ultrasound has been considered as an effective way to intercalate the organic molecule into the layered inorganic solid.26,27 The intercalation rate could be dramatically increased on various layered materials (such as ZrS2, V2O5, TaS2 and MoO3).26,27 An efficient intercalation using ultrasound has been reported recently on tetragonal FeSe, leading to the formation of layered compound Na0.5(C2H8N2)Fe2Se2.28 It inspires us to carry out the similar route to intercalate the layered FeS, to obtain a novel FeS-based compound. In this work, we report a new layered compound Kx(C2H8N2)yFe2−zS2 obtained by using the ultrasonic method, which is the first time to intercalate organic amine in between the [FeS] layers. This compound adopts a tetragonal lattice with I4/m space group and the [FeS] and [Kx(C2H8N2)y] layers alternately stack along the c direction. It has been found that the alkali metal K is indispensable for the phase stability. Meanwhile, the concentration of K, x could be continuously adjusted from 0.25 to 0.45 (nominal composition). Kx(C2H8N2)yFe2−zS2 exhibits as a ferrimagnetic semiconductor, with no superconductivity observed down to 5 K. Based on the composition analysis, we demonstrate the correlation between the K intercalation and the formation of Fe vacancy in [FeS] layers, which reasonably explains the suppression of superconductivity in FeS-based intercalated system.
Experimental section
Kx(C2H8N2)yFe2−zS2 polycrystalline samples were prepared by co-intercalating K and C2H8N2 molecule into tetragonal FeS using the ultrasonic route. Binary FeS, as the precursor, was firstly synthesized by hydrothermal method described in ref. 2 (details are given in ESI†). Then, K pieces (99.99%) and binary FeS host in molar ratio K![[thin space (1/6-em)]](https://www.rsc.org/images/entities/char_2009.gif) :
:![[thin space (1/6-em)]](https://www.rsc.org/images/entities/char_2009.gif) FeS = x
FeS = x![[thin space (1/6-em)]](https://www.rsc.org/images/entities/char_2009.gif) :
:![[thin space (1/6-em)]](https://www.rsc.org/images/entities/char_2009.gif) 2 were added into 5 mL ethylenediamine (x = 0.04, 0.07, 0.14, 0.2, 0.25, 0.3, 0.35, 0.4, 0.45, 0.5, 0.6, 0.7 and 0.8, respectively). The mixture was sealed in quartz tube under Ar atmosphere and irradiated with ultrasonic wave (900 W, 40 KHz) at 60 °C for 40–60 h. It should be mentioned that the dehydration of ethylenediamine for the enough times is crucial for the successful synthesis (details of the dehydration are given in ESI and Fig. S1†). Finally, the excess ethylenediamine in the quartz tube was exhausted by mechanical pump with only the sample left. All the conducts were performed in an Ar-filled glove box to prevent the air and water contamination.
2 were added into 5 mL ethylenediamine (x = 0.04, 0.07, 0.14, 0.2, 0.25, 0.3, 0.35, 0.4, 0.45, 0.5, 0.6, 0.7 and 0.8, respectively). The mixture was sealed in quartz tube under Ar atmosphere and irradiated with ultrasonic wave (900 W, 40 KHz) at 60 °C for 40–60 h. It should be mentioned that the dehydration of ethylenediamine for the enough times is crucial for the successful synthesis (details of the dehydration are given in ESI and Fig. S1†). Finally, the excess ethylenediamine in the quartz tube was exhausted by mechanical pump with only the sample left. All the conducts were performed in an Ar-filled glove box to prevent the air and water contamination.
The samples were characterized by powder X-ray diffraction (PXRD) at room temperature using a PANalytical diffractometer (X'Pert PRO MRD) with Cu Kα radiation (λ = 1.5148 Å). Indexing was performed using the FullProf program.29 The morphology of the samples was investigated via scanning electron microscopy (SEM, Hitachi S-4800) and transmission electron microscopy (together with the selected area electron diffraction (SAED)) (TEM, JEOL JEM-2100F). The component analysis of Fe, S and K was measured both by energy dispersive X-ray spectroscopy (EDS) and inductively coupled plasma-atomic emission spectrometry (ICP-AES). The composition of C2H8N2 molecules in samples were determined by standard micro-Kjeldahl method. The X-ray photoelectron spectroscopy (XPS) was taken on an AXIS-UItra instrument from Kratos using monochromatic Al Kα radiation (225 W, 15 mA and 15 kV). The electrical resistivity was measured with the cold-pressed samples under a uniaxial stress of 600 kg cm−2 via a typical four-probe method. The magnetization susceptibility was measured by using a physical property measurement system (PPMS, Quantum Design).
Results and discussion
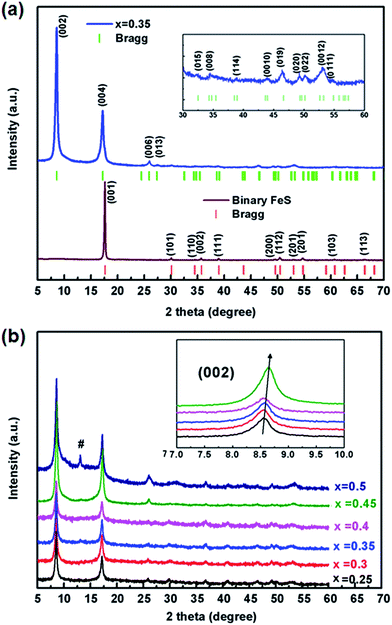
The as-prepared binary FeS precursor crystallizes the P4/nmm space group with the lattice parameters a = 3.6813(2) Å and c = 5.0295(4) Å (Fig. 1a), being in agreement with the reported data.2 Meanwhile, the sharp drop of magnetic susceptibility at 4.5 K was observed in zero-field cooling curve, indicating a superconductivity state (Fig. S2†). After the ultrasonic intercalation, the PXRD pattern of Kx(C2H8N2)yFe2−zS2 shows a body-centered lattice with no impurity being observed (Fig. 1a). It has been found that the single phase of Kx(C2H8N2)yFe2−zS2 can only be obtained in the range of 0.25 ≤ x ≤ 0.45, and the (002) peaks gradually shift to the higher degree by increasing the K content (Fig. 1b). For x < 0.25, the residual binary FeS was observed in the patterns (Fig. S3†). And for x > 0.45, the potassium trends to react with FeS and form K2Fe4S5 (so called 245 phase) directly, without inducing C2H8N2 molecules into the structure (Fig. S3†).Considering the structural model of Na0.5(C2H8N2)Fe2Se2,28 the I4/m space group was adopted to index Kx(C2H8N2)yFe2−zS2 as the tetragonal cell. It is to be noticed that the diffraction peaks except (00l) are rather weak, indicating strong preferred orientation occurred in samples. By indexing all the patterns, the lattice parameter a and the [FeS] interlayer distance d (half of parameter c) of different phases were obtained and their dependences on the K content x was plotted in Fig. 2. It can be seen that compared with the binary FeS, the parameter a is extended in Kx(C2H8N2)yFe2−zS2, indicating the weaker Fe–Fe interaction in the layer. With the x increasing, the value of a decreases monotonously from 3.697(1) to 3.691(1) Å in the single-phase region (Fig. 2a). When the 245 phase forms with x ≥ 0.5, the a axis increases abruptly compared with that of Kx(C2H8N2)yFe2−zS2, mainly because of the formation of √5 × √5 ordered Fe vacancies.30 Concerning the interlayer distance d, the value of Kx(C2H8N2)yFe2−zS2 is much larger than that of the binary FeS, due to the co-intercalation of K and C2H8N2 molecules. However, with the K content x increasing from 0.25 to 0.45, the [FeS] interlayer distance decreases unexpectedly from 10.333(5) to 10.283(7) Å (Fig. 2b). This counterintuitive result could be explained by the larger Coulomb force between [FeS] layers caused by higher K content, since the intercalated K+ reduces the [FeS] into electronegative [FeS]σ− and the bonding along c direction in the structure is hence dominated by ionic force. This phenomena was also observed in Kx(NH3)yFe2Se2 system, where the K0.3(NH3)0.47Fe2Se2 phase shows the parameter c = 15.56 Å, while the c axis of K0.6(NH3)0.37Fe2Se2 with more K content is much smaller (14.84) Å.31 After the 245 phase appears, d decreases to 6.783(6) Å as expected, since the C2H8N2 molecules are not involved any more in between the layers. Based on the phase structure models in Fig. 2, it can be concluded that a certain amount of the K+ cation is necessary for the structural stability of the Kx(C2H8N2)yFe2−zS2 phase. It is also worth noting that the concentration of the charged K+ could be continuously adjusted in between the layers of Kx(C2H8N2)yFe2−zS2, which is different from the scenario in Kx(NH3)yFe2Se2 system where the K concentration can only be fixed at two values (0.3 and 0.6).31 It suggests that the specific organic molecule may play an important role on the phase structures in these systems.
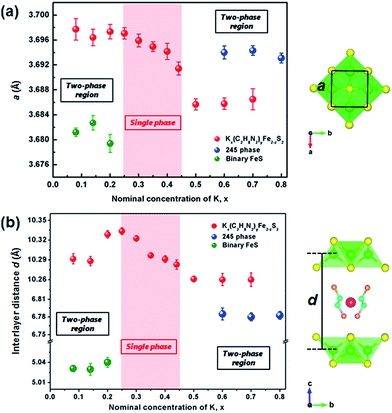 | ||
| Fig. 2 (a) The lattice parameters a and (b) interlayer distances d of Kx(C2H8N2)yFe2−zS2, 245 phase and binary FeS depended on the nominal K concentration, x. The light red area shows the single-phase region of the intercalated phase. The structural model of C2H8N2 molecule was adopted from ref. 28. | ||
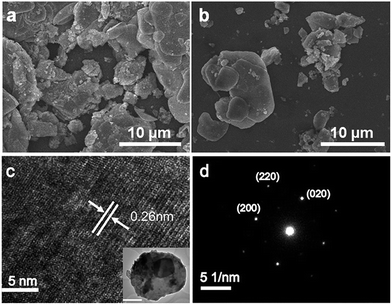
The SEM image in Fig. 3a shows that the FeS precursor from hydrothermal synthesis forms the plate shape as reported.2 After co-intercalation with K and C2H8N2, the morphology of the sample did not change so much as the FeS precursor (Fig. 3b). Typical TEM (inset) and high-resolution TEM images are shown in Fig. 3c, showing a set of high-resolution lattice planes with the interplanar distance of 0.26 nm, corresponding to the (110) plane. The SAED pattern along the [001] direction can be well indexed by the I4/m unit cell (Fig. 3d), confirming the results from the PXRD patterns.
In order to determine the concentration of the C2H8N2 molecules in structure, we carried out the chemical analyses based on standard micro-Kjeldahl method. The obtained y data for samples with x = 0.25, 0.35 and 0.45 are 0.284(3), 0.325(7) and 0.368(8), respectively. It is interesting to find that the amount of C2H8N2 shows a linear dependence on the content of K (Fig. S4†), suggesting the feature of the co-intercalation during our synthetic route. The EDS analysis on the plate-like crystal in Kx(C2H8N2)yFe2−zS2 with x = 0.25, 0.35 and 0.45 reveals that the content of K in samples are in comparable with the nominal compositions (Fig. S5 and Table S1†). However, it is worth noting that the measured Fe![[thin space (1/6-em)]](https://www.rsc.org/images/entities/char_2009.gif) :
:![[thin space (1/6-em)]](https://www.rsc.org/images/entities/char_2009.gif) S molar ratio of Kx(C2H8N2)yFe2−zS2 turned to be 1.88(1)
S molar ratio of Kx(C2H8N2)yFe2−zS2 turned to be 1.88(1)![[thin space (1/6-em)]](https://www.rsc.org/images/entities/char_2009.gif) :
:![[thin space (1/6-em)]](https://www.rsc.org/images/entities/char_2009.gif) 2, 1.83(1)
2, 1.83(1)![[thin space (1/6-em)]](https://www.rsc.org/images/entities/char_2009.gif) :
:![[thin space (1/6-em)]](https://www.rsc.org/images/entities/char_2009.gif) 2 and 1.79(2)
2 and 1.79(2)![[thin space (1/6-em)]](https://www.rsc.org/images/entities/char_2009.gif) :
:![[thin space (1/6-em)]](https://www.rsc.org/images/entities/char_2009.gif) 2, respectively. This gradual reduction of Fe content is further confirmed by ICP-AES measurements (Table S1†), suggesting the increased Fe vacancies in the [FeS] layer. Since the FeS precursor is stoichiometric, we can declare that the co-intercalation of K and C2H8N2 has driven some of the Fe atoms to escape out from the lattice. These vacancies are disordered without inducing any superstructure, considering no satellite spot is observed in the SAED pattern (Fig. 3d).
2, respectively. This gradual reduction of Fe content is further confirmed by ICP-AES measurements (Table S1†), suggesting the increased Fe vacancies in the [FeS] layer. Since the FeS precursor is stoichiometric, we can declare that the co-intercalation of K and C2H8N2 has driven some of the Fe atoms to escape out from the lattice. These vacancies are disordered without inducing any superstructure, considering no satellite spot is observed in the SAED pattern (Fig. 3d).
The formation of Fe vacancies can be further confirmed by XPS results. For the stoichiometric FeS with the Fe![[thin space (1/6-em)]](https://www.rsc.org/images/entities/char_2009.gif) :
:![[thin space (1/6-em)]](https://www.rsc.org/images/entities/char_2009.gif) S molar ratio = 1, the valence of Fe exhibits as a single bivalence as expected, since the S2− anion shows −2 state in this binary sulphide (Fig. S6†). However, XPS on Kx(C2H8N2)yFe2−zS2 (x = 0.35) shows the mixed valence of both +2 and +3 of Fe (Fig. 4), which is supported by the absence of the satellite between Fe2+ 2p3/2 and Fe2+ 2p1/2.32,33 It suggests that in Kx(C2H8N2)yFe2−zS2 (x = 0.35), the stoichiometry of [FeS] layer is deflected with a less Fe content, leading to the rising of valence of partial Fe atoms. Meanwhile, the iron metal with completely free oxidation was also observed at around 707 eV, which is mainly attributed to the elemental Fe depleted from [FeS] layers during the intercalation.
S molar ratio = 1, the valence of Fe exhibits as a single bivalence as expected, since the S2− anion shows −2 state in this binary sulphide (Fig. S6†). However, XPS on Kx(C2H8N2)yFe2−zS2 (x = 0.35) shows the mixed valence of both +2 and +3 of Fe (Fig. 4), which is supported by the absence of the satellite between Fe2+ 2p3/2 and Fe2+ 2p1/2.32,33 It suggests that in Kx(C2H8N2)yFe2−zS2 (x = 0.35), the stoichiometry of [FeS] layer is deflected with a less Fe content, leading to the rising of valence of partial Fe atoms. Meanwhile, the iron metal with completely free oxidation was also observed at around 707 eV, which is mainly attributed to the elemental Fe depleted from [FeS] layers during the intercalation.
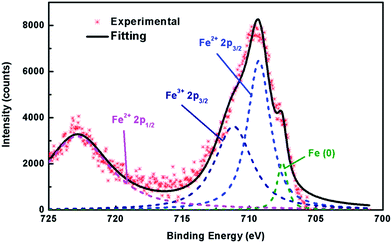 | ||
| Fig. 4 XPS Fe spectra of Kx(C2H8N2)yFe2−zS2 (x = 0.35), showing the appearance of +3 Fe together with the +2 valence.32,33 | ||
The temperature dependence of magnetic susceptibility of Kx(C2H8N2)yFe2−zS2 (x = 0.25, 0.35 and 0.45) was firstly measured in ZFC mode under the field of 20 Oe. No diamagnetic signal due to the superconductivity has been observed down to 5 K in all three samples (Fig. S7†). Contrast with the large increasing of Tc in Na0.5(C2H8N2)Fe2Se2 (46 K) from the parent FeSe (8.5 K),28 the co-intercalation of K and C2H8N2 molecule failed to significantly enhance the superconductivity of FeS host, which could be ascribed to the formation of disordered Fe vacancies.34,35 The magnetic susceptibility of the three samples have been measured again with the field H = 5000 Oe (Fig. 5). No obvious magnetic phase transition was observed from 300 down to 50 K, indicating that the Kx(C2H8N2)yFe2−zS2 shows paramagnetic in high temperature range. At around 50 K, a magnetic ordering transition occurred, which was also observed in other intercalated FeS: (Li0.85Fe0.15OH)FeS22 and (NH3)Fe0.25Fe2S2.23 The magnetic hysteresis loop of the sample with x = 0.35 was also measured (Fig. S8†), which shows the ferrimagnetic feature. It needs to be mentioned that the high susceptibility of the normal state in Fig. 5 could be resulted from the Fe impurity in the powder samples, which was depleted from the lattice after the charged intercalation. Very similar susceptibility curves were observed in the (Li1−xFexOH)FeSe materials,36 where Fe in hydroxide layer was also expelled from the structure by lithiation. In addition, the susceptibility of Kx(C2H8N2)yFe2−zS2 is enhanced with x going from 0.25 to 0.35 and to 0.45, revealing that the content of the depleted Fe was also increased with more K intercalated.
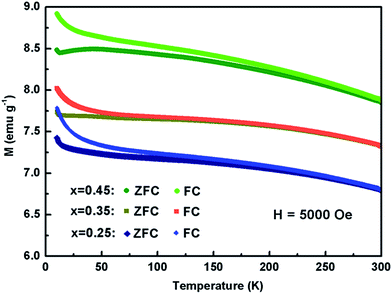 | ||
| Fig. 5 Temperature dependence of magnetic susceptibility of Kx(C2H8N2)yFe2−zS2 with the applied field H = 5000 Oe. | ||
Fig. 6 shows the temperature dependence of resistivity for the Kx(C2H8N2)yFe2−zS2 (x = 0.25) from 5 to 300 K. The room-temperature resistivity is 0.07 Ω cm, an order of magnitude bigger than that of (NH3)Fe0.25Fe2S2 (0.0087 Ω cm).23 The resistivity increases monotonically with the decreasing temperature, showing the semiconducting behaviour. The resistivity in the high temperature range (from 200 to 300 K) can be described by eqn 1
ρ = ρ0![[thin space (1/6-em)]](https://www.rsc.org/images/entities/char_2009.gif) exp(Ea/kBT) exp(Ea/kBT)
| (1) |
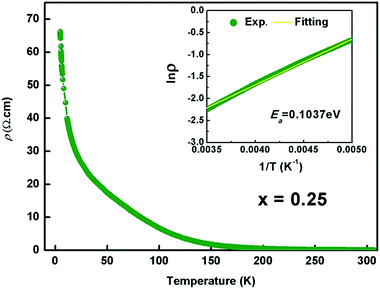 | ||
| Fig. 6 Temperature dependence of the electrical resistivity of Kx(C2H8N2)yFe2−zS2 with x = 0.25. Inset shows the fitted result using the thermal activation model. | ||
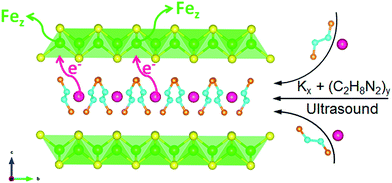
Now we look back on the elemental analysis in Table S1.† It can be seen that for three samples the vacancy concentration z is basically the half of x. However, the parent FeS before intercalation is stoichiometric with z = 0 (from EDS). Hence the mechanism behind the correlation between K+ intercalation and Fe depletion could be suggested as the poor tolerance of FeS layer on the accumulation of negative charge. When the charged metal K being intercalated, the Fe would be expelled from the structure as a separate elemental phase according to the eqn (2) and Fig. 7:
| xK + yC2H8N2 + 2FeS = Kx(C2H8N2)yFe2−zS2 + zFe | (2) |
Liu et al., calculated the phase structure of KxFe2−ySe2 system and indicated that the Fe would be excluded when x > 0.6.37 Hence, this charge-induced Fe depletion is suggested to be easier in FeS system. This can explain that why the superconductivity was degraded in (Li1−xFexOH)FeS and (NH3)Fe0.25Fe2S2, since the charged guest has been intercalated, resulting in the Fe vacancy in [FeS] layers. In consequence, in order to maintain the superconductivity of FeS-based materials after charge intercalation, proper synthetic route needs to be designed to avoid the formation of Fe vacancies.
So far, we can summarize the lattice parameters of the FeSe and FeS-based compounds with C2H8N2 intercalated (Table 1). It can be seen that both parameters a and c of selenides are generally larger than sulphides due to the difference ionic radius of chalcogens. However, after Na was de-intercalated from the structure, the a axis of C2H8N2 intercalated FeSe increased (see Table 1),28 which is inconsistent with the result of FeS-based system in our work. Hence, the contracted parameter a of Kx(C2H8N2)yFe2−zS2 with x increasing (Fig. 2a) could also be contributed from the Fe vacancy. Furthermore, Hatakeda et al., reported an unexpected small parameter a (3.458 Å) in sample Lix(C2H8N2)yFe2−zSe2.7 This data is even smaller than that of the binary tetragonal FeSe, suggesting that the structures with the C2H8N2 intercalated Fe chalcogenides are very diverse.
| Compound | a (Å) | c (Å) | Space group |
|---|---|---|---|
| K0.25(C2H8N2)0.284Fe1.88S2 (this work) | 3.697(1) | 20.667(5) | I4/m |
| K0.45(C2H8N2)0.368Fe1.79S2 (this work) | 3.691(1) | 20.566(7) | I4/m |
| (NH3)Fe0.25Fe2S2 (ref. 23) | 3.6880(1) | 13.1134(8) | I4/mmm |
| Li0.85Fe0.15OHFeS (ref. 22) | 3.6886(3) | 8.915(1) | P4/nmm |
| Lix(C2H8N2)yFe2−zSe2 (ref. 7) | 3.458(6) | 20.74(7) | I4/mmm |
| Na0.5(C2H8N2)Fe2Se2 (ref. 28) | 3.8145(7) | 22.1954(8) | I4/m |
| (C2H8N2)Fe2Se2 (ref. 28) | 3.8565(2) | 21.4257(6) | I4/m |
Conclusions
A new intercalated FeS compound Kx(C2H8N2)yFe2−zS2 has been synthesized via the sonochemical method. This compound adopts the body-centered tetragonal lattice cell with the [FeS] and [K(C2H8N2)] layers alternately stacking along the c direction. We carefully investigate the phase structure of this compound as the function of intercalated K content. For 0.25 ≤ x ≤ 0.45, the K and C2H8N2 molecules could be co-intercalated in between the [FeS] layers which showing a single phase; For x < 0.25 the parent FeS is residual and for x > 0.45 the metal K reacts directly with FeS to form K2Fe4S5. Chemical component analysis indicates that the Fe was partially expelled from the structure when the charged K was intercalated in between the layers. This correlation between K intercalation and Fe depletion leads the compound to act as a ferrimagnetic semiconductor and no superconductivity has been observed down to 5 K. Our results not only enrich the diversity of intercalation on layered FeS, but also demonstrate the effect of chemical intercalation on driving the metal vacancy in layered compounds, which could shed light on the basis to induce the superconductivity in intercalated FeS-based materials.Acknowledgements
The financial support by the National Natural Science Foundation of China (No. 51532010, 51172025 and 51402014) and the Fundamental Research Funds for the Central Universities (FRF-TP-16-006A3) are gratefully acknowledged.Notes and references
- F. C. Hsu, J. Y. Luo, K. W. Yeh, T. K. Chen, T. W. Huang, P. M. Wu, Y. C. Lee, Y. L. Huang, Y. Y. Chu, D. C. Yan and M. K. Wu, Proc. Natl. Acad. Sci. U. S. A., 2008, 105, 14262–14264 CrossRef CAS PubMed.
- X. Lai, H. Zhang, Y. Wang, X. Wang, X. Zhang, J. Lin and F. Huang, J. Am. Chem. Soc., 2015, 137, 10148–10151 CrossRef CAS PubMed.
- Y. Han, W. Y. Li, X. Cao, X. Y. Wang, B. Xu, B. R. Zhao, Y. Q. Guo and J. L. Yang, Phys. Rev. Lett., 2010, 104, 017003 CrossRef CAS PubMed.
- S. Margadonna, Y. Margadonna, M. T. McDonald, K. Kasperkiewicz, Y. Mizuguchi, Y. Mizuguchi, A. N. Fitch, E. Suarde and K. Prassides, Chem. Commun., 2008, 5607–5609 RSC.
- J. G. Guo, S. F. Jin, G. Wang, S. C. Wang, K. X. Zhu, T. T. Zhou, M. He and X. L. Chen, Phys. Rev. B: Condens. Matter Mater. Phys., 2010, 82, 180520 CrossRef.
- T. P. Ying, X. L. Chen, G. Wang, S. F. Jin, T. T. Zhou, X. F. Lai, H. Zhang and W. Y. Wang, Sci. Rep., 2012, 2, 426 CAS.
- T. Hatakeda, T. Noji, T. Kawamata, M. Kato and Y. Koike, J. Phys. Soc. Jpn., 2013, 82, 123705 CrossRef.
- X. F. Lu, N. Z. Wang, H. Wu, Y. P. Wu, D. Zhao, X. Z. Zeng, X. G. Luo, T. Wu, W. Bao, G. H. Zhang, F. Q. Huang, Q. Z. Huang and X. H. Chen, Nat. Mater., 2015, 14, 325–329 CrossRef CAS PubMed.
- B. Lei, J. H. Cui, Z. J. Xiang, C. Shang, N. Z. Wang, G. J. Ye, X. G. Luo, T. Wu, Z. Sun and X. H. Chen, Phys. Rev. Lett., 2016, 116, 077002 CrossRef CAS PubMed.
- M. Burrard-Lucas, D. G. Free, S. J. Sedlmaier, J. D. Wright, S. J. Cassidy, Y. Hara, A. J. Corkett, T. Lancaster, P. J. Baker, S. J. Blundell and S. J. Clarke, Nat. Mater., 2013, 12, 15–19 CrossRef CAS PubMed.
- T.-P. Ying, G. Wang, S.-F. Jin, S.-J. Shen, H. Zhang, T.-T. Zhou, X.-F. Lai, W.-Y. Wang and X.-L. Chen, Chin. Phys. B, 2013, 22, 087412 CrossRef.
- T. Noji, T. Hatakeda, S. Hosono, T. Kawamata, M. Kato and Y. Koike, Phys. C, 2014, 504, 8–11 CrossRef CAS.
- M. M. Hrovat, P. Jeglic, M. Klanjsek, T. Hatakeda, T. Noji, Y. Tanabe, T. Urata, K. K. Huynh, Y. Koike, K. Tanigaki and D. Arcon, Phys. Rev. B: Condens. Matter Mater. Phys., 2015, 92, 094513 CrossRef.
- S. Hosono, T. Noji, T. Hatakeda, T. Kawamata, M. Kato and Y. Koike, J. Phys. Soc. Jpn., 2014, 83, 113704 CrossRef.
- F. Hayashi, H. Lei, J. Guo and H. Hosono, Inorg. Chem., 2015, 54, 3346–3351 CrossRef CAS PubMed.
- U. Pachmayr, F. Nitsche, H. Luetkens, S. Kamusella, F. Brueckner, R. Sarkar, H.-H. Klauss and D. Johrendt, Angew. Chem., Int. Ed., 2015, 54, 293–297 CrossRef CAS PubMed.
- A. R. Lennie, S. A. T. Redfern, P. F. Schofield and D. J. Vaughan, Mineral. Mag., 1995, 59, 677–683 CAS.
- S. J. Denholme, S. Demura, H. Demura, H. Hara, K. Deguchi, M. Fujioka, T. Fujioka, T. Yamaguchi, H. Takeya and Y. Takano, Mater. Chem. Phys., 2004, 147, 50–56 CrossRef.
- I. T. Sines, D. D. Vaughn, R. Misra, E. J. Popczun and R. E. Schaak, J. Solid State Chem., 2012, 196, 17–20 CrossRef CAS.
- J. Guo, X. Chen, G. Wang, S. Jin, T. Zhou and X. Lai, Phys. Rev. B: Condens. Matter Mater. Phys., 2012, 85, 054507 CrossRef.
- U. Pachmayr and D. Johrendt, Chem. Commun., 2015, 51, 4689–4692 RSC.
- X. Zhang, X. Lai, N. Yi, J. He, H. Chen, H. Zhang, J. Lin and F. Huang, RSC Adv., 2015, 5, 38248–38253 RSC.
- X. F. Lai, Z. P. Lin, K. J. Bu, X. Wang, H. Zhang, D. D. Li, Y. Q. Wang, Y. H. Gu, J. H. Lin and F. Q. Huang, RSC Adv., 2016, 6, 81886–81893 RSC.
- H. Lin, R. Kang, L. Kong, X. Zhu and H.-H. Wen, Sci. China: Phys., Mech. Astron., 2017, 60, 027411 CrossRef.
- X. Zhou, C. Eckberg, B. Wilfong, S.-C. Liou, H. K. Vivanco, J. Paglione and E. E. Rodriguez, 2016, ArXiv, 1611.02383.
- K. S. Suslick, D. J. Casadonte, M. L. I.-I. Grean and M. E. Thompeoa, Ultrasonics, 1987, 25, 56–69 CrossRef CAS PubMed.
- H. Tagaya, K. Takeshi, K. Ara, J.-i. Kadokawa, M. Karasu and K. Chiba, Mater. Res. Bull., 1995, 30, 1161–1171 CrossRef CAS.
- S. Jin, X. Wu, Q. Huang, H. Wu, T. Ying, X. Fan, R. Sun, L. Zhao and X. Chen, 2016, ArXiv, 1607.01103.
- J. Rodriguez-Carvajal, Phys. B, 1993, 192, 55–69 CrossRef CAS.
- P. Zavalij, W. Bao, X. F. Wang, J. J. Ying, X. H. Chen, D. M. Wang, J. B. He, X. Q. Wang, G. F. Chen, P. Y. Hsieh, Q. Huang and M. A. Green, Phys. Rev. B: Condens. Matter Mater. Phys., 2011, 83, 132509 CrossRef.
- T. Ying, X. Chen, G. Wang, S. Jin, X. Lai, T. Zhou, H. Zhang, S. Shen and W. Wang, J. Am. Chem. Soc., 2013, 135, 2951–2954 CrossRef CAS PubMed.
- T. Yamashita and P. Hayers, Appl. Surf. Sci., 2008, 254, 2441–2449 CrossRef CAS.
- A. P. Grosvenor, B. A. Kobe, M. C. Biesinger and N. S. Mclntyre, Surf. Interface Anal., 2004, 36, 1564–1574 CrossRef CAS.
- C. K. H. Borg, X. Zhou, C. Eckberg, D. J. Campbell, S. R. Saha, J. Paglione and E. E. Rodriguez, Phys. Rev. B, 2016, 93, 094522 CrossRef.
- Z. Guo, F. Sun, B. Han, K. Lin, L. Zhou and W. Yuan, Phys. Chem. Chem. Phys., 2017 10.1039/c7cp00068e.
- D. N. Woodruff, F. Schild, C. V. Topping, S. J. Cassidy, J. N. Blandy, S. J. Blundell, A. L. Thompson and S. J. Clarke, Inorg. Chem., 2016, 55, 9886–9891 CrossRef CAS PubMed.
- Y. Liu, G. Wang, T. Ying, X. Lai, S. Jin, N. Liu, J. Hu and X. Chen, Adv. Sci., 2016, 3, 1600098 CrossRef PubMed.
Footnotes |
| † Electronic supplementary information (ESI) available. See DOI: 10.1039/c7ra01720k |
| ‡ Zhongnan Guo and Liang Zhou contribute equally to this work. |
| This journal is © The Royal Society of Chemistry 2017 |

