 Open Access Article
Creative Commons Attribution 3.0 Unported Licence
Catalytic hydrodeoxygenation of anisole over nickel supported on plasma treated alumina–silica mixed oxides
Hamed Taghvaeiac,
Mohammad Reza Rahimpour *ab and
Peter Bruggemanc
aDepartment of Chemical Engineering, Shiraz University, Shiraz 71345, Iran. E-mail: rahimpor@shirazu.ac.ir; mrahimpour@ucdavis.edu; Fax: +98-711-6287294; Tel: +98-711-2303071
bDepartment of Chemical Engineering, University of California, Davis, CA 95616, USA
cDepartment of Mechanical Engineering, College of Science and Engineering, University of Minnesota, Minneapolis, MN 55455, USA
First published on 15th June 2017
Abstract
Hydrodeoxygenation (HDO) of anisole, a representative of lignin-derived bio oil, was investigated on SiO2–Al2O3 supported Ni nano-particles at low hydrogen pressure. Plasma was used for the surface modification of the support. The supports and catalysts were characterized by N2 physisorption, FT-IR spectroscopy, Temperature Program Desorption of ammonia (NH3-TPD), X-ray diffraction (XRD), field emission scanning electron microscopy (FESEM) and transmission electron microscopy (TEM). The results showed that the plasma treatment improved both the SiO2–Al2O3 surface characteristics and pore structure. The catalyst with a plasma treated support had a higher dispersion and smaller NiO particle size, leading to an improved hydrodeoxygenation activity and product selectivity. Phenol and benzene were the major products of anisole HDO. Demethylation, hydrodeoxygenation and transalkylation reactions are the main chemical reactions for anisole upgrading using the Ni/Al2O3–SiO2 catalyst. Compared to the untreated catalyst, the plasma treated Ni/Al2O3–SiO2 catalyst gives higher anisole conversion at atmospheric pressure by which valuable products were obtained with higher selectivity.
1. Introduction
Flash pyrolysis of lignin followed by upgrading of the produced bio-oil is a potential approach for CO2 neutral fuel production.1 The upgrading step is required since the produced bio-oil from flash pyrolysis contains a high oxygen content (10–45 wt%) compared to crude oil.2–5 A high oxygen content hinders the miscibility of bio-oil with petroleum derived fuels.6–8 Moreover, it reduces the heating value and increases the viscosity of bio-oil.9–11Hydrogen plays a key role in the hydrodeoxygenation reaction for oxygen removal from lignin derived bio-oil. Hydrodeoxygenation is the most common upgrading route but is costly due to the large consumption of hydrogen and requires high pressures.12,13 At high hydrogen pressure, undesired ring saturated products are generated via unwanted hydrogenation14 which leads to decrease in octane number and prevents the direct utilization of the upgraded bio-oil.
Moreover, the use of hydrogen leads to other concerns including (1) hydrogen leakage and ignition at relatively low temperature (2) production of greenhouse gases in many hydrogen production processes used and (3) hydrogen production cost and economy.15
To date, only few studies on bio-oil hydrodeoxygenation (HDO) at atmospheric pressure have been reported. A possible solution that can enable a reduction of the hydrogen pressure is the synthesis of effective bifunctional hydrodeoxygenation catalysts which combines supports with acidic nature13 and metal centers with hydrodeoxygenation (HDO) activity, such as Ni.16,17 In 2015 Sankaranarayanan et al.18 reported that the combination of Ni with acidic support showed a high performance for HDO of methoxyl-phenyl containing compounds. The catalytic hydrodeoxygenation of lignin derived bio-oil has recently been reviewed in ref. 9.
Various approaches have been proposed to improve catalyst properties and characteristics as another solution for improving HDO in term of hydrogen pressure. Among these approaches, non-thermal plasma treatment has attracted a lot of attention due to its low temperature operation, simplicity and short processing time.19–24 The plasma treatment of catalysts has recently been reviewed in our published article.25 However, the effect of this surface modification method in HDO reaction is not reported.
Conventional hydrotreating catalysts are the most widely investigated catalyst for HDO reactions.26 Among them, silica–alumina supported Ni catalysts are commonly used for hydrodesulfurization (HDS) and hydroprocessing of heavy oil. However, only few works27 have been devoted to illustrate the activity of this catalyst in HDO reactions of lignin derived bio-oil. Generally, the amorphous SiO2–Al2O3 support has been used for hydroprocessing catalysts due to its favorable acidity due to the presence of both Brønsted and Lewis acid sites. Interestingly, the acidity obtained by a combination of silica and alumina is higher than that of individual alumina or silica.28
In the present study, plasma modified SiO2–Al2O3 supported Ni was used as catalyst for HDO reactions. The principal aim is to decrease the hydrogen pressure of the HDO process. The effect of the plasma treatment on the characteristics of the catalyst and its performance as a HDO catalyst is investigated. Anisole was used as model compound of lignin-derived bio-oil since anisole, as one of the major component of bio-oil, contains a methoxy-phenyl group.29–32
2. Experimental methods
2.1 Materials
Aluminum tri-sec-butylate (97%), tetraethyl orthosilicate (TEOS) (98%) and nickel nitrate hexahydrate (Ni(NO3)2·6H2O) were used as the Al, Si and Ni precursors, respectively. Acetylacetone (H-acac) and n-butanol were used as the complexing agent and solvent, respectively. All chemicals were purchased from Merck and used without further purification. Hydrogen, nitrogen and argon were used with purity of 99.999% as feed, carrier gas in the catalytic reactor and carrier gas in the plasma system, respectively. Anisole (99% purity) was used in this work as a reactant.2.2 Support preparation
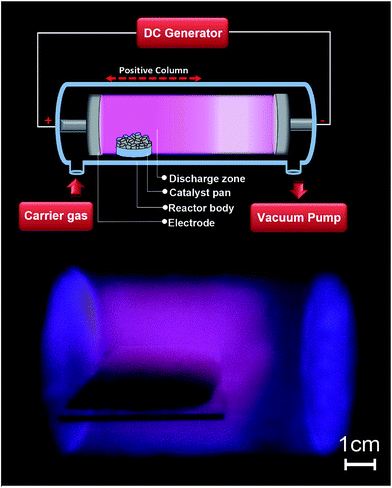
In this study, silica–alumina mixed oxides (Si/Al = 1) were used as a support and prepared by a sol–gel method.33 A typical synthesis procedure is as follows. Appropriate amounts of TEOS and aluminum tri-sec-butylate were dissolved in n-butanol and the solution was heated to 60 °C while stirring. When the solution was well mixed and became clear, H-acac was added. The solution was cooled down to ambient temperature and subsequently hydrolyzed with deionized water. The final solution was stirred until a transparent gel was formed. After drying for 2 h at 110 °C the sample was calcined at 500 °C for 5 h. The obtained product is named Al2O3–SiO2 throughout the paper.In the second step, a part of the synthesized support was treated in a glow discharge plasma. A schematic diagram of the plasma device is shown in Fig. 1. The plasma was generated in a pyrex cylinder with a length of 30 cm and an inner diameter of 7 cm. Two circular stainless still electrodes were placed in the chamber at a distance of 10 cm and connected to DC high voltage power supply and ground, respectively. All impurities were washed using deionized water and acetone. Al2O3–SiO2 powder was placed on a pyrex glass and positioned in the positive column of the plasma discharge. A 2-stage direct drive oil rotary vacuum pump (Uniweld HVP12) was used to evacuate the chamber. Ar was used as a plasma forming gas. The flow rate was controlled by means of a mass flow controller and adjusted at 20 mL min−1. The inside pressure was measured by a vacuum gauge and kept constant at 100 Pa. The catalyst was treated by a plasma operating at voltage of 2 kV and a current of 150 mA. Samples were treated for 30 min and 60 min by the plasma and the resulting powder is referred to as Al2O3–SiO2(P30) and Al2O3–SiO2(P60) respectively.
2.3 Catalyst preparation
Ni/Al2O3–SiO2 and Ni/Al2O3–SiO2 (P60) catalysts with 10 wt% nickel loading were synthesized by incipient wetness impregnation using an aqueous solution of nickel nitrate hexahydrate (Ni(NO3)2·6H2O). The aqueous mixture was stirred for 12 h at room temperature. The solution was heated to 80 °C to remove water and subsequently placed in an oven at 110 °C for 2 h. The resulting samples were calcined at 550 °C for 4 h to obtain final catalyst.2.4 Characterization of the catalysts
The structural characteristics of the samples were analyzed by X-ray diffraction (XRD) using a Bruker-AXS (Siemens) D5005 diffractometer with a Cu Kα (k = 0.15406 nm) radiation source operated at 40 mA and 45 kV. XRD diffraction spectra were obtained between 10–70° with a step size of 0.04° and a counting time of 1.5 s. Fourier Transform Infrared Spectroscopy (BRUKER EQUINOX 55) was carried out in the range of 400–4000 cm−1 wave number. Temperature-programmed desorption of ammonia (NH3-TPD) was performed on a chemisorption analyzer (Quantachrome ChemBet).N2 physisorption was performed by an automatic adsorption analyzer (ASAP 2020) to obtain the N2 adsorption–desorption isotherms at 77 K and to measure textural properties (specific surface area, average pore diameter and pore volume) of samples. Before the measurement, the samples were degassed at 300 °C for 6 h under vacuum to remove impurities. The Brunauer–Emmett–Teller (BET) method was used to evaluate the specific surface area of samples, while the pore volume and average pore diameter were calculated with the Barrett–Joyner–Halenda (BJH) method.
The topography and particle size of the catalyst was characterized by Field Emission Scanning Electron Microscopy (FESEM), which was equipped with a Mira3 microscope and an energy-dispersive X-ray spectrometer (EDS).
The morphologies of the catalyst and Ni size were characterized using transmission electron microscopy (TEM). A FEI Tecnai T12 TEM operated at 200 kV was used. The sample was prepared by depositing a drop of water suspension of fine powder onto a copper grid coated with carbon.
2.5 Experimental setup for catalytic activity measurements
The catalytic reaction experiments were conducted in the gas phase using a fixed bed tubular flow reactor (with an inside diameter of 9 mm) at a temperature of 400 °C and atmospheric pressure. Liquid anisole at room temperature was fed by an HPLC pump with 0.02 mL min−1 flow rate into the preheating zone to heat it to a temperature of 150 °C. The vaporized anisole was mixed with the gas stream consisting of a mixture of N2 and H2 and fed to the reactor. The flow rate of N2 and H2 was adjusted at 10 L h−1 for each gas (room temperature and atmospheric pressure) using mass flow controllers to obtain a H2 to anisole molar ratio of 40. Liquid products were collected from a condenser which was placed at the reactor outlet.Fresh catalyst, about 1 g with a particle diameter of 0.25–0.30 mm was used for each experiment. Before the reaction, the catalysts were reduced for 1 h in the reactor with pure hydrogen at a flow rate of 6 L h−1 at 500 °C. The value of the weight hourly space velocity (WHSV) was 1.2 (g of anisole)/(g of catalyst × h). All experiments typically lasted 3 h of continuous operation and liquid products were collected every 30 min.
In order to analyze the products, a gas chromatograph (GC112A) using a SGE-BPX5 capillary column and FID detector was employed. 2 μL of each sample was injected into the GC. The major components were also detected by a GC-MS (Shimadzu QP-5050, Kyoto, Japan).
The anisole conversion percentage and product selectivity (Si) were defined as follows:
 | (1) |
 | (2) |
The influence of external mass transfer limitation was negligible under the experimental conditions since variation of catalyst mass and reactant flow at stable WHSV did not affect the conversion. Moreover, no variation of anisole conversion was observed by reducing the catalyst size which confirmed the insignificancy of internal mass transfer limitation.
3. Results and discussion
3.1 Morphology of plasma-treated Al2O3–SiO2
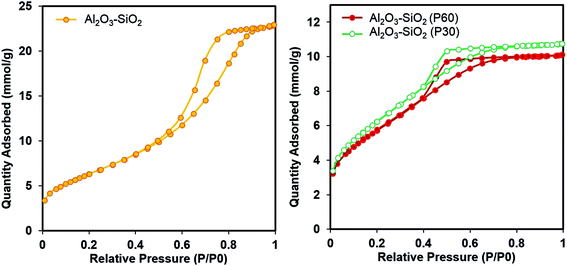
The textural properties of the untreated and plasma treated support are compared by nitrogen physisorption measurement. The N2 adsorption–desorption isotherms and pore size distributions of the Al2O3–SiO2, Al2O3–SiO2 (P30) and Al2O3–SiO2 (P60) supports are shown in Fig. 2. The BET surface area, pore volume and average pore diameter of the samples are listed in Table 1.The N2 adsorption–desorption isotherm of the untreated and plasma treated supports are classified as type IV isotherms of mesoporous materials according to the IUPAC classification.34 The mesoporous alumina–silica mixed oxides show high specific surface area of 517 m2 g−1, with a small enhancement after plasma treatment which is in consistent with the results in other literature.25 As shown in Fig. 2 the hysteresis loops of the plasma treated supports are shifted to lower P/P0 values. The reason is ascribe to the fragmentation of support particles as a consequence of support surface bombardment by energetic ions and potentially other plasma species.
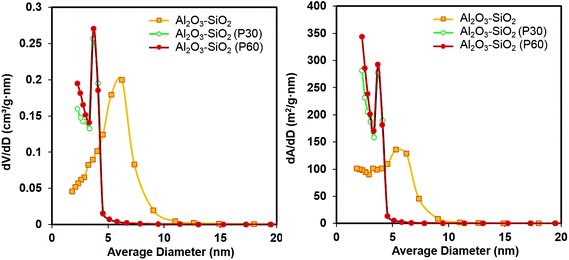
The obtained results are in accordance with the pore size distributions obtained by N2 physisorption is shown in Fig. 3. The pore size distribution of the plasma treated Al2O3–SiO2 has its maximum between 2–4 nm, with a maximum pore diameter of 3.3 nm. However, untreated samples show a broader pore size distribution in the range of 2–8 nm. Moreover, the maximum of the pore size distribution decreases from 6.2 nm to 3.7 nm, after plasma treatment.
A narrower mesoporous structure of the plasma treated support has significant influence on impregnated metal particle size and can prevent the agglomeration of the active phase through a geometrical confinement effect which restricts the growth of Ni crystallites during high temperature reaction.35 Increasing the plasma treatment time from 30 min to 60 min has no significant effects on the nitrogen physisorption.
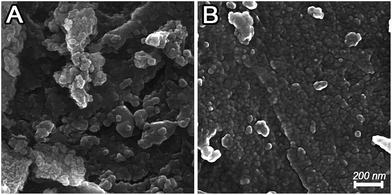
Fig. 4 displays the surface morphology of the untreated and plasma-treated support. The FESEM graphs show that the plasma treatment has considerable effects both on the morphology and grain sizes of the support.
The spherical particles of plasma treated support has smaller diameter with a uniform dispersion. In contrast, the untreated support consists of large particles and shows a comparatively rough surface. These results are consistent with the nitrogen physisorption results.
As mentioned above, the bombardment of the catalytic surface by plasma species and in particularly ions can cause fragmentation of support particles. Moreover, when objects such as the support are inserted in the plasma they tend to be charged negatively by the energetic electrons in the plasma. This leads to the formation of a sheath between the support and the bulk plasma with local high electric fields. This charge distribution on a rough surface can cause repulsive Coulomb force between support particles and is suggested to potentially enhance elongation, distortion or fragmentation by the plasma.36
3.2 FTIR analysis
FTIR spectra of plasma treated and untreated Al2O3–SiO2 are shown in Fig. 5. All samples have similar peak positions and there is no significant difference between the FTIR spectra of treated and untreated support. All samples show absorption peaks around 2900–3800 and 1050 cm−1 which are related to OH of (Si/Al)O4 units of the Al2O3–SiO2 and physically adsorbed water molecules. Moreover, the broad band at around 600–900 cm−1 is corresponding to stretching vibrations modes of X–O, O–X–O and X–O–X bonds, where X represents Si and Al, and O is the atom of oxygen. The observed bands at 2925–2940 and 2854–2877 cm−1 for all samples are attributed to the –CH2 stretching mode of atmospheric hydrocarbons on the surface of the support.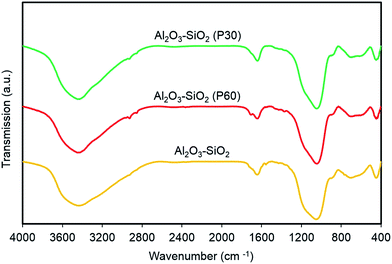 | ||
| Fig. 5 FTIR spectra of plasma treated and untreated support. The spectra of Al2O3–SiO2 P30 and P60 are shifted for clarity. | ||
3.3 Temperature program desorption of ammonia (NH3-TPD)
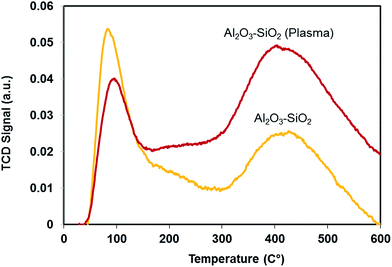
The acidity of Al2O3–SiO2 after plasma treatment is compared with the untreated sample. NH3-TPD was performed to characterize the distribution of weak and strong acid. The low- and high-temperature peaks represent the weak acid and strong acid sites, respectively. As shown in Fig. 6, the weak acid sites decrease after plasma treatment while the strong acid sites increase. This can be attributed to diffusion of Al from aluminum oxides (Al–O–Al) or isolated aluminum grafted to silica into the silica network (Al–O–Si), which induces the Brønsted acidity.37 Indeed, larger number of aluminum atoms have been tetrahedrally coordinated into the silica network.37,38 Previous studies showed that supports with a strong acidity are crucial for the catalytic hydrodeoxygenation reaction.39 Therefore, besides improving textural properties, plasma treatment can improve the HDO reaction through increasing strong acid functionality.3.4 X-ray diffraction (XRD) of the catalysts
Fig. 7 shows the XRD patterns of the Al2O3–SiO2, Ni/Al2O3–SiO2 and Ni/Al2O3–SiO2 (P60). The amorphous alumina–silica can be observed by a broad peak in the 15–35° 2θ range. Diffraction peaks at 37.2°, 43.3°, and 62.9° (2θ) correspond to the (111), (200), and (220) planes of NiO phase and seem to be present although the intensities are almost at the noise level. These poor intensities suggesting that NiO crystal size exists either in small size or they are well dispersed on a high surface area of the mesostructure support.28 The small crystallite size of NiO can be due to strong interaction between NiO and support.40 Weaker NiO peaks are observed for Ni/Al2O3–SiO2 (P60) compared to Ni/Al2O3–SiO2, indicating slightly smaller crystal size and higher dispersion for NiO.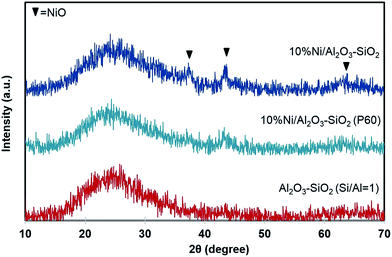 | ||
| Fig. 7 XRD spectra of support and catalysts. The spectra of Al2O3–SiO2 P60 and 10%Ni/Al2O3–SiO2 are shifted for clarity. | ||
3.5 TEM studies on the catalyst
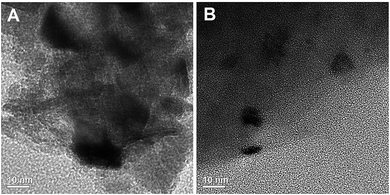
Transmission electron microscopy (TEM) images of NiO supported nanocatalysts, shown in Fig. 8, revealing a smaller size of nickel particles in the case of Ni/Al2O3–SiO2 (P60) compared to the Ni/Al2O3–SiO2 nanocatalyst. This result is consistent with the observed small NiO diffraction peaks with XRD.Some nickel oxide agglomerates up to 17 nm in size can be clearly observed for the Ni/Al2O3–SiO2 catalyst. In contrast, the plasma treated catalysts contain Ni particles with smaller sizes and more homogeneous distribution. Nanoparticles of around 1–10 nm are observed for the Ni/Al2O3–SiO2 (P60) catalyst.
The interaction of ions with the support surface could improve the kinetics of metal particle nucleation and crystal growth by generation of defects which can enhance the formation of seed crystals and the rate of metal particle nucleation.19,41 In addition, the narrower mesoporous structure of plasma treated support can have a significant influence on metal particle size due to geometrical confinement35 and lead to better impregnation of the nickel on the support. Indeed, the narrower pore size of plasma treated support can prevent the growth and aggregation of nickel particles. The confined nickel particles in the plasma treated catalyst can be confined by a smaller drop in pore volume of plasma treated catalyst after impregnation of nickel. N2 physisorption results (Table 1) show that the pore volume of the plasma treated catalyst drops by 51% after impregnation of nickel on the support, while this value is 76% in the case of untreated catalyst.
Therefore, less pore plugging occurs in the Ni/Al2O3–SiO2 (P60) sample due to the smaller NiO particles and leads to a relatively higher surface area of Ni/Al2O3–SiO2 (P60) sample in comparison with Ni/Al2O3–SiO2 (Table 1).
3.6 FESEM and EDS dot mapping analysis
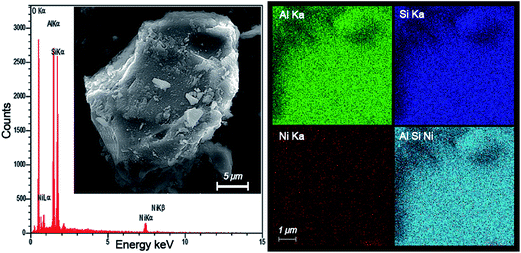
The existance of different elements (Ni, Si and Al) and also, their distribution in the structure of the nanocatalyst are confirmed by EDX dot-mapping. Fig. 9 shows the elemental mapping of the Ni/Al2O3–SiO2 (P60) nanocatalyst. All the elements used for the catalyst preparation (Ni, Al and Si) can be seen in the EDS analysis. The EDX data suggests that highly homogeneous and well-dispersed nanocatalyst particles are obtained by using plasma treated supports. No sintering or particle growth was observed in the Ni particles. These findings are consistent with the TEM and XRD results.Moreover, an intertwined dispersion of Ni, Si and Al is observed in the NiO supported plasma treated Al2O3–SiO2. This represents successful preparation of alumina and silica mixed oxides. In addition, the synergism effect of active sites and acid sites for HDO reaction can be improved.
3.7 Catalytic activity
Fig. 10 shows the variation of conversion for the Ni/Al2O3–SiO2 (P60) and Ni/Al2O3–SiO2 nanocatalysts over 300 min for time-on-stream experiments. In the blank test without catalyst, no anisole conversion is observed under the reaction conditions. As can be seen, conversion remains almost constant during the test time. Plasma treated Al2O3–SiO2 supported nickel catalyst exhibits higher HDO activity of anisole compared to the Ni/Al2O3–SiO2. The conversion of anisole increases from 61.1% to 75.5% when Ni/Al2O3–SiO2 catalyst were replaced with Ni/Al2O3–SiO2 (P60) catalyst. The increased conversion can be attributed to smaller Ni particle size and a better dispersion of nickel along with higher specific surface area of Ni/Al2O3–SiO2 (P60) compared to Ni/Al2O3–SiO2 nanocatalyst as shown in previous sections. The enhancement in the conversion is also believed to be the result of increasing the strong acid sites of support after plasma treatment.39,42 The acid site on support would further affect the interaction between reactant and support material. Lin et al. employed the chemisorption of guaiacol and proved that the higher acid strength had stronger bonding with the model compound supports.43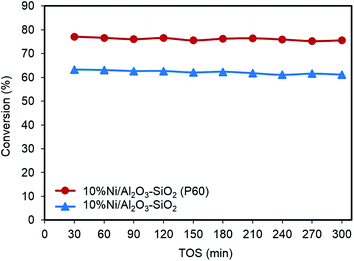 | ||
| Fig. 10 Time-on-stream behavior of anisole conversion on Ni/Al2O3–SiO2 and Ni/Al2O3–SiO2 (P60) nanocatalysts. | ||
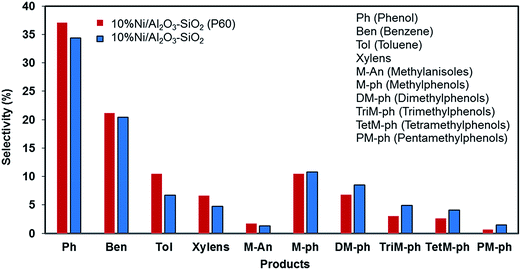
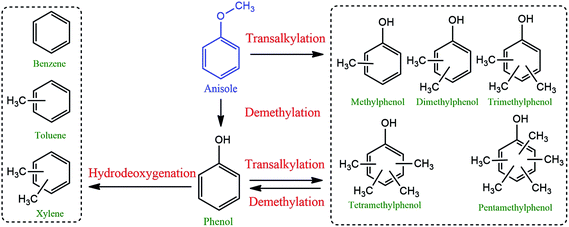
Phenol, methylphenols and benzene are the major products of anisole hydrodeoxygenation over both catalysts as shown in Fig. 11. A reaction network to major and minor products is shown in Fig. 12. The selectivity of phenol reaches almost 37.1% in the case of the Ni/Al2O3–SiO2 (P60) and it is close to 34.4% when Ni/Al2O3–SiO2 is used. This monooxygenated product is a result of breaking the C6H5O–CH3 bond which is the weakest bond in the chemical structure of anisole. Therefore, the rate of anisole demethylation to phenol is higher than other reactions.
The production of benzene is also significant for both catalysts, especially for Ni/Al2O3–SiO2 (P60), which shows a selectivity of 21.2% toward this valuable deoxygenated product. Benzene could be produce through hydrodeoxygenation of phenol.
In addition to benzene, a significant amount of methyl substituted phenols are also produced since the Caromatic–H bond can break easier than the C6H5–OH bond.15 The production of methyl substituted compounds like methylphenols and dimethylphenols result from the transalkylation reaction. However, higher selectivity of benzene was achieved than methyl substituted phenol products especially in the case of the plasma treated catalyst. This result can be related to the high hydrodeoxygenation ability of the synthesized catalysts especially in the case of the Ni/Al2O3–SiO2 (P60) catalyst which has smaller NiO particles. This result is consistent with previous results that showed that smaller nickel particles are more favorable for hydrodeoxygenation reactions.16 Moreover, the catalytic roles of metal nanoparticles on acidic supports were elucidated using the acid-site-measurement-dependent catalysis results in previous studies, which demonstrated that metal-deposited acidic supports were indispensable to the deoxygenation of oxygenates.44
The high amount of strong acid sites in the plasma treated catalyst could also accelerate the production of toluene and xylens through alkylation of benzene ring.
Actually, plasma treatment can have both negative and positive influence on alkylation reaction. On one side, it can reduce the active metal particle size which can result in higher oxygen removal reaction compared to alkylation.44 As a result of this effect, methyl substituted phenol products were generated lower than benzene. On the other side, it can enhance the strong acid sites which results in higher alkylation reaction than other reactions. Due to this effect, the generated benzene can convert to toluene and xylens through alkylation of benzene ring.
Interestingly, no ring saturated products are observed which is because the conversion took place at atmospheric pressure.
In summary, the obtained results reveal that promoting the characteristics of Al2O3–SiO2 supported nickel catalyst through plasma modification of the support, not only elevated considerably the catalytic activity for HDO, but also increased anisole conversion to more valuable chemicals, such as phenol and benzene at atmospheric pressure. Moreover, considering the formation of desirable products and high conversion at low hydrogen pressure, the Al2O3–SiO2 based catalyst was found to be highly appropriate for upgrading of lignin-derived bio-oil.
4. Conclusions
In this study, Ni supported on Al2O3–SiO2 were synthesized by impregnation method have been evaluated for anisole hydrodeoxygenation at atmospheric pressure. Glow discharge plasma treatment was used for modification of support. It is revealed by nitrogen physisorption and SEM that plasma treated support has narrower pore size distribution (2–4 nm), smaller particles and more uniform surface compared to untreated support. These led to smaller NiO particle size, higher surface areas and better distribution of NiO, as evidenced by XRD, nitrogen physisorption, SEM, elemental mapping and TEM measurements. Moreover, the plasma treated catalyst showed higher strong acid sites as shown by NH3-TPD. As a consequence, the catalyst with plasma-treated support showed significantly improved anisole conversion. Demethylation, hydrodeoxygenation and transalkylation reactions take place over the Ni/Al2O3–SiO2 catalyst, suggesting it is a suitable catalyst for upgrading of bio oil in order to attain valuable products at atmospheric pressure.Acknowledgements
Parts of the characterization of the catalyst was performed at the University of Minnesota supported by the University of Minnesota.References
- T. Prasomsri, A. T. To, S. Crossley, W. E. Alvarez and D. E. Resasco, Appl. Catal., B, 2011, 106, 204–211 CAS
.
- M. Ishikawa, M. Tamura, Y. Nakagawa and K. Tomishige, Appl. Catal., B, 2016, 182, 193–203 CrossRef CAS
.
- H. Taghvaei, M. B. Hosseinzadeh, S. Rezazadeh, M. R. Rahimpour and A. Shariati, Chem. Eng. J., 2015, 281, 227–235 CrossRef CAS
.
- M. B. Hosseinzadeh, S. Rezazadeh, H. R. Rahimpour, H. Taghvaei and M. R. Rahimpour, Chem. Eng. Res. Des., 2015, 104, 296–305 CrossRef CAS
.
- X. Zhang, Q. Zhang, T. Wang, L. Ma, Y. Yu and L. Chen, Bioresour. Technol., 2013, 134, 73–80 CrossRef
.
- H. Taghvaei, M. Kheirollahivash, M. Ghasemi, P. Rostami and M. R. Rahimpour, Energy Fuels, 2014, 28, 2535–2543 CrossRef CAS
.
- H. Taghvaei, M. Kheirollahivash, M. Ghasemi, P. Rostami, B. C. Gates and M. R. Rahimpour, Energy Fuels, 2014, 28, 4545–4553 CrossRef CAS
.
- X. Zhang, L. Chen, W. Kong, T. Wang, Q. Zhang, J. Long, Y. Xu and L. Ma, Energy, 2015, 84, 83–90 CrossRef CAS
.
- M. Saidi, F. Samimi, D. Karimipourfard, T. Nimmanwudipong, B. C. Gates and M. R. Rahimpour, Energy Environ. Sci., 2014, 7, 103 CAS
.
- T. N. Pham, D. Shi and D. E. Resasco, Appl. Catal., B, 2014, 145, 10–23 CrossRef CAS
.
- X. Zhang, Q. Zhang, L. Chen, Y. Xu, T. Wang and L. Ma, Chin. J. Catal., 2014, 35, 302–309 CrossRef CAS
.
- A. Sanna, T. P. Vispute and G. W. Huber, Appl. Catal., B, 2015, 165, 446–456 CrossRef CAS
.
- Y. Yang, C. Ochoa-Hernández, V. A. de la Peña O'Shea, P. Pizarro, J. M. Coronado and D. P. Serrano, Appl. Catal., B, 2014, 145, 91–100 CrossRef CAS
.
- T. Prasomsri, M. Shetty, K. Murugappan and Y. Román-Leshkov, Energy Environ. Sci., 2014, 7, 2660 CAS
.
- H. Taghvaei and M. R. Rahimpour, RSC Adv., 2016, 6, 98369–98380 RSC
.
- P. M. Mortensen, J.-D. Grunwaldt, P. A. Jensen and A. D. Jensen, Catal. Today, 2016, 259, 277–284 CrossRef CAS
.
- A. B. Dongil, I. T. Ghampson, R. García, J. L. G. Fierro and N. Escalona, RSC Adv., 2016, 6, 2611–2623 RSC
.
- T. M. Sankaranarayanan, A. Berenguer, C. Ochoa-Hernández, I. Moreno, P. Jana, J. M. Coronado, D. P. Serrano and P. Pizarro, Catal. Today, 2015, 243, 163–172 CrossRef CAS
.
- N. Wang, K. Shen, X. Yu, W. Qian and W. Chu, Catal. Sci. Technol., 2013, 3, 2278 CAS
.
- Y. Zhao, Y.-x. Pan, Y. Xie and C.-j. Liu, Catal. Commun., 2008, 9, 1558–1562 CrossRef CAS
.
- Z. Wang and C.-J. Liu, Nano Energy, 2015, 11, 277–293 CrossRef CAS
.
- X. Zhu, P. Huo, Y.-p. Zhang, D.-g. Cheng and C.-j. Liu, Appl. Catal., B, 2008, 81, 132–140 CrossRef CAS
.
- C. Liu, K. Yu, Y. Zhang, X. Zhu, F. He and B. Eliasson, Appl. Catal., B, 2004, 47, 95–100 CrossRef CAS
.
- Y.-X. Pan, C.-J. Liu and P. Shi, J. Power Sources, 2008, 176, 46–53 CrossRef CAS
.
- H. Taghvaei, M. Heravi and M. R. Rahimpour, Plasma Processes Polym., 2016 DOI:10.1002/ppap.201600204
.
- P. M. de Souza, R. C. Rabelo-Neto, L. E. P. Borges, G. Jacobs, B. H. Davis, T. Sooknoi, D. E. Resasco and F. B. Noronha, ACS Catal., 2015, 5, 1318–1329 CrossRef CAS
.
- O. O. Ayodele, F. A. Dawodu, D. Yan, X. Lu, J. Xin and S. Zhang, Renewable Energy, 2016, 86, 943–948 CrossRef CAS
.
- C. Leyva, M. Rana and J. Ancheyta, Catal. Today, 2008, 130, 345–353 CrossRef CAS
.
- X. Zhu, L. L. Lobban, R. G. Mallinson and D. E. Resasco, J. Catal., 2011, 281, 21–29 CrossRef CAS
.
- M. Saidi, P. Rostami, H. R. Rahimpour, M. A. Roshanfekr Fallah, M. R. Rahimpour, B. C. Gates and S. Raeissi, Energy Fuels, 2015, 29, 4990–4997 CrossRef CAS
.
- R. C. Runnebaum, T. Nimmanwudipong, D. E. Block and B. C. Gates, Catal. Sci. Technol., 2012, 2, 113 CAS
.
- R. C. Runnebaum, R. J. Lobo-Lapidus, T. Nimmanwudipong, D. E. Block and B. C. Gates, Energy Fuels, 2011, 25, 4776–4785 CrossRef CAS
.
- M. Arshadi, A. R. Faraji and M. J. Amiri, Chem. Eng. J., 2015, 266, 345–355 CrossRef CAS
.
- K. S. W. Sing, D. H. Everett, R. A. W. Haul, L. Moscou, R. A. Pierotti, J. Rouquerol and T. Siemieniewska, in Handbook of Heterogeneous Catalysis, Wiley-VCH Verlag GmbH & Co. KGaA, 2008, DOI:10.1002/9783527610044.hetcat0065
.
- H. Long, Y. Xu, X. Zhang, S. Hu, S. Shang, Y. Yin and X. Dai, J. Energy Chem., 2013, 22, 733–739 CrossRef CAS
.
- N. Rahemi, M. Haghighi, A. A. Babaluo, M. F. Jafari and S. Allahyari, Korean J. Chem. Eng., 2014, 31, 1553–1563 CrossRef CAS
.
- E. J. M. Hensen, D. G. Poduval, P. C. M. M. Magusin, A. E. Coumans and J. A. R. v. Veen, J. Catal., 2010, 269, 201–218 CrossRef CAS
.
- E. Lovell, Y. Jiang, J. Scott, F. Wang, Y. Suhardja, M. Chen, J. Huang and R. Amal, Appl. Catal., A, 2014, 473, 51–58 CrossRef CAS
.
- Y. Wang, J. Wu and S. Wang, RSC Adv., 2013, 3, 12635 RSC
.
- X. Zhang, J. Long, W. Kong, Q. Zhang, L. Chen, T. Wang, L. Ma and Y. Li, Energy Fuels, 2014, 28, 2562–2570 CrossRef CAS
.
- J. Hong, W. Chu, P. A. Chernavskii and A. Y. Khodakov, J. Catal., 2010, 273, 9–17 CrossRef CAS
.
- G. Yao, G. Wu, W. Dai, N. Guan and L. Li, Fuel, 2015, 150, 175–183 CrossRef CAS
.
- Y.-C. Lin, C.-L. Li, H.-P. Wan, H.-T. Lee and C.-F. Liu, Energy Fuels, 2011, 25, 890–896 CrossRef CAS
.
- C. R. Lee, J. S. Yoon, Y.-W. Suh, J.-W. Choi, J.-M. Ha, D. J. Suh and Y.-K. Park, Catal. Commun., 2012, 17, 54–58 CrossRef CAS
.
| This journal is © The Royal Society of Chemistry 2017 |

