 Open Access Article
CO oxidation on mesoporous SBA-15 supported CuO–CeO2 catalyst prepared by a surfactant-assisted impregnation method
Weiwei Shen,
Dongsen Mao *,
Zhimin Luo and
Jun Yu
Research Institute of Applied Catalysis, School of Chemical and Environmental Engineering, Shanghai Institute of Technology, Shanghai 201418, PR China. E-mail: dsmao@sit.edu.cn
First published on 24th May 2017
Abstract
A series of mesoporous SBA-15 supported CuO–CeO2 catalysts were prepared by a surfactant-assisted impregnation method with PEG 200 as the surfactant. The effects of the content of PEG 200 in the impregnating solution on physicochemical properties and catalytic activity of the prepared CuO–CeO2/SBA-15 catalysts were studied by XRD, adsorption–desorption of N2 at −196 °C, SEM/EDX, TEM, Raman spectroscopy, XPS, in situ DRIFTS, H2-TPR, CO-TPD techniques, and low-temperature CO oxidation testing. The results show that the surfactant-assisted impregnation method has a substantial effect on the distribution and dispersion of components, synergetic effect between copper species and ceria and the catalyst prepared with the PEG content of VPEG![[thin space (1/6-em)]](https://www.rsc.org/images/entities/char_2009.gif) :
:![[thin space (1/6-em)]](https://www.rsc.org/images/entities/char_2009.gif) VH2O = 1 has the best catalytic performance: the temperature for 99% CO conversion decreased significantly to 155 from 195 °C without the addition of PEG. The enhanced catalytic performance can be ascribed to more finely dispersed Cu species on ceria and more active sites.
VH2O = 1 has the best catalytic performance: the temperature for 99% CO conversion decreased significantly to 155 from 195 °C without the addition of PEG. The enhanced catalytic performance can be ascribed to more finely dispersed Cu species on ceria and more active sites.
1. Introduction
Catalytic oxidation of CO is considered as a very important reaction for many applications, such as vehicle exhaust treatment, indoor air cleaning, CO preferential oxidation for fuel cells, and carbon dioxide lasers exhaust abatement.1 It is well known that noble metal catalysts such as Au, Pt, and Pd are highly effective for CO oxidation; however they suffer from such disadvantages as high cost and limited availability. Therefore, increasing attention has been given to the non-noble metal catalysts, particularly CuO–CeO2 system. Numerous studies have found that the CuO–CeO2 catalysts display high catalytic activity in the oxidation of CO,2–7 which is comparable to or even higher than that on some noble metals like Pt.8,9It has been well illustrated that the favorable performance of the CuO–CeO2 catalyst for CO oxidation is attributed to the high dispersion of CuO and the synergetic effect between copper and ceria.9,10 In principle, the synergetic effect between copper and ceria can make both components to start the oxidation and reduction reaction more readily.11,12 Therefore, the CuO–CeO2 catalyst supported on high surface area carriers can further improve the activity due to the extended interfacial boundary area.13
Considering the context, the application of supported CuO–CeO2 catalysts for CO oxidation has attracted increasing attention recently.13–19 For example, Aguila et al.14 investigated the possibility of using various oxides (Al2O3, ZrO2, and SiO2) as a support for CuO–CeO2 catalyst, and the results showed that the supports had an important influence on the interaction degree between copper and ceria. Among them, the CuO–CeO2/SiO2 catalyst displays the highest CO oxidation activity. Moreover, Luo et al.17 studied the effect of carrier porosity on the activity of CuO–CeO2/SiO2 catalyst and found that higher catalytic activity was observed on the CuO–CeO2 catalyst supported on SiO2 with larger surface area and pore diameter, which is due to a higher dispersion of CuO particles and stronger synergistic interplay between CuO and CeO2 particles. At variance with the result, however, Astudillo et al.15 reported that the catalytic activity of CuO–CeO2 supported on large surface area SiO2 (380 m2 g−1) was practically the same as or even slightly lower than that on small surface area SiO2 (200 m2 g−1).
SBA-15, as an ordered mesoporous material, has been used as support of Cu,20 Au–Cu21 and Cu–Ni22 catalysts for CO oxidation due to the high specific surface area, pore volume, and precisely controllable pore size. On the other hand, SBA-15 supported CuO–CeO2 catalyst has also been prepared and used in preferential CO oxidation in H2-rich stream,23–25 and combustion of volatile organic compounds.26,27 However, the CuO–CeO2/SBA-15 catalyst has rarely been investigated for CO oxidation.28
In this paper, the CuO–CeO2/SBA-15 catalysts were prepared by conventional and surfactant-assisted impregnation methods. Here, PEG 200 was used as the surfactant, mainly considering the result of Chang29 that the cationic surfactant (CTAB) could not promote the dispersion of Ni because of charge repulsion, while the non-ionic surfactant such as PEG could effectively promote the dispersion of Ni in the preparation of Ni/SiO2 catalyst by the surfactant-assisted impregnation method. The effect of PEG 200 content on the catalytic activity of the CuO–CeO2/SBA-15 catalyst for CO oxidation was investigated. In order to elucidate the influence of the surfactant content, the physicochemical properties of the prepared catalysts were characterized extensively by means of XRD, N2 adsorption, SEM/EDX, TEM, Raman spectroscopy, XPS, in situ DRIFTS, H2-TPR, and CO-TPD techniques.
2. Experimental
2.1 Preparation of CuO–CeO2/SBA-15 catalyst
The CuO–CeO2/SBA-15 catalysts were prepared by a wet impregnation method. Firstly, the mixed solutions containing PEG 200 and water were prepared with different volume ratios (VPEG![[thin space (1/6-em)]](https://www.rsc.org/images/entities/char_2009.gif) :
:![[thin space (1/6-em)]](https://www.rsc.org/images/entities/char_2009.gif) VH2O = 0
VH2O = 0![[thin space (1/6-em)]](https://www.rsc.org/images/entities/char_2009.gif) :
:![[thin space (1/6-em)]](https://www.rsc.org/images/entities/char_2009.gif) 6, 2
6, 2![[thin space (1/6-em)]](https://www.rsc.org/images/entities/char_2009.gif) :
:![[thin space (1/6-em)]](https://www.rsc.org/images/entities/char_2009.gif) 4, 3
4, 3![[thin space (1/6-em)]](https://www.rsc.org/images/entities/char_2009.gif) :
:![[thin space (1/6-em)]](https://www.rsc.org/images/entities/char_2009.gif) 3, 4
3, 4![[thin space (1/6-em)]](https://www.rsc.org/images/entities/char_2009.gif) :
:![[thin space (1/6-em)]](https://www.rsc.org/images/entities/char_2009.gif) 2, 5
2, 5![[thin space (1/6-em)]](https://www.rsc.org/images/entities/char_2009.gif) :
:![[thin space (1/6-em)]](https://www.rsc.org/images/entities/char_2009.gif) 1). After that, the calcined SBA-15 (Shanghai Zhuoyue Chemical Technology Co., Ltd, China) was impregnated with a certain amount of the above mixed solution containing Cu(NO3)2·3H2O and Ce(NO3)3·6H2O. After stirred for 2 h at room temperature, the impregnate was dried at 60 °C in an oven overnight and calcined at 500 °C for 4 h at a rate of 1 °C min−1. The obtained samples were denoted as 0-CCS, 2-CCS, 3-CCS, 4-CCS, and 5-CCS. The contents of Cu and Ce in the catalysts were set to 5 wt% and 20 wt%, respectively.
1). After that, the calcined SBA-15 (Shanghai Zhuoyue Chemical Technology Co., Ltd, China) was impregnated with a certain amount of the above mixed solution containing Cu(NO3)2·3H2O and Ce(NO3)3·6H2O. After stirred for 2 h at room temperature, the impregnate was dried at 60 °C in an oven overnight and calcined at 500 °C for 4 h at a rate of 1 °C min−1. The obtained samples were denoted as 0-CCS, 2-CCS, 3-CCS, 4-CCS, and 5-CCS. The contents of Cu and Ce in the catalysts were set to 5 wt% and 20 wt%, respectively.
2.2 Characterization techniques
X-ray diffraction (XRD) patterns were obtained with a Rigaku Ultima IV instrument using Cu Kα radiation source at 30 kV and 25 mA. The 2θ angles ranged from 10 to 80° with a scan rate of 4° min−1. The crystallite size of CuO was determined from full widths at half maxima of CuO(002) and CuO(111) peaks at 35.5° and 38.7°. The cell parameter values were calculated by the Scherrer equation using the intensity of the CeO2(111) peak.N2 adsorption–desorption isotherms were determined at liquid nitrogen temperature on a Micrometrics ASAP-2020 adsorption apparatus. Prior to each analysis, the sample was swept with N2 stream under vacuum at 200 °C for 10 h. The specific surface areas were calculated using the BET equation, and the pore size distribution was calculated by the Barrett–Joyner–Halenda (BJH) method from the desorption branch of the isotherm.
Scanning electron microscopy (SEM) images were obtained using a US8010 microscope operated at 15.0 kV. The element mappings of the samples were determined by using an energy dispersive X-ray spectrometer (EDX).
Transmission electron microscopy (TEM) images were taken using a TECNAI instrument operated at 200 kV.
Raman spectra determination was carried out by a DXR-Raman instrument (Thermo Fisher Scientific) using the 532 nm exciting line (200 mW beam). Each spectrum was obtained by five scans with a resolution of 4 cm−1.
X-ray photoelectron spectroscopy (XPS, kratos Axis Ultra DLD spectrometer) was used to investigate the chemical states of the elements and the surface compositions, using Al Kα radiation. All the binding energy (B.E.) values were calibrated using C 1s peak at 284.6 eV as a reference.
In situ diffuse reflectance infrared Fourier transform spectra (DRIFTS) were collected on a Nicolet 6700 FT-IR spectrometer fitted with a MCT detector at a resolution of 4 cm−1. The catalysts were pretreated at 300 °C for 1 h in flowing N2 atmosphere. After the cell cooled to 30 °C, the CO (5 vol% in Ar) was introduced for about 50 min and then the CO adsorbed studies of the catalysts were performed.
H2-TPR was determined using 10 vol% H2/N2 as a reducing gas in a quartz reactor. A 20 mg sample was pretreated with N2 stream at 200 °C for 1 h. The water produced from reduction was eliminated using molecular sieve 5 Å. The flow rate of the reducing gas was kept at 50 mL min−1, and the temperature was programmed to rise from 50 to 500 °C at a constant rate of 10 °C min−1. The consumption of H2 was detected by a TCD detector.
CO-TPD measurement was conducted at the same apparatus as the above H2-TPR. A 100 mg sample was pretreated under He flow at 400 °C for 1 h. After cooling to room temperature in He flow, the CO adsorption was performed at 30 °C for 1 h under CO flow (10 mL min−1), and then the catalyst was swept again with He flow for 3 h. Lastly, the sample was heated in flowing He (50 mL min−1) up to 500 °C at a ramp of 10 °C min−1, while the desorbed species were detected by a quadrupole mass spectrometer (QMS, Balzers OmniStar 200).
2.3 Catalytic tests
The catalytic activity for CO oxidation was tested in a fixed bed reactor (i.d. = 6 mm). Firstly, 0.1 g of the sample was placed in the middle of quartz tube micro-reactor. Then, the sample was pretreated at 200 °C in a N2 stream (50 mL min−1) for 40 min to remove any impurities absorbed on the surface of the catalyst during preparation and storage. After cooling to ambient temperature in N2 stream, the mixed reaction gas was introduced into the system. The mixed reaction gas containing 1 vol% CO, 2.5 vol% O2, and 96.5 vol% N2 was passed through the catalyst bed at a flow rate of 60 mL min−1 corresponding to a GHSV of 36![[thin space (1/6-em)]](https://www.rsc.org/images/entities/char_2009.gif) 000 mL gcat−1 h−1. The temperature was increased step by step, and the sample was equilibrated under reaction conditions for about 30 min to achieve steady–state activity. The gas compositions before and after the reaction were measured by an on-line gas chromatography (RAMIIN, GC 2060) with a FID detector; and a methanation reactor was inserted between one GC column and the FID. The conversion of CO (XCO) was calculated as follows:
000 mL gcat−1 h−1. The temperature was increased step by step, and the sample was equilibrated under reaction conditions for about 30 min to achieve steady–state activity. The gas compositions before and after the reaction were measured by an on-line gas chromatography (RAMIIN, GC 2060) with a FID detector; and a methanation reactor was inserted between one GC column and the FID. The conversion of CO (XCO) was calculated as follows:| XCO (%) = 100 × ([CO]in − [CO]out)/[CO]in |
3. Results and discussion
3.1 XRD study
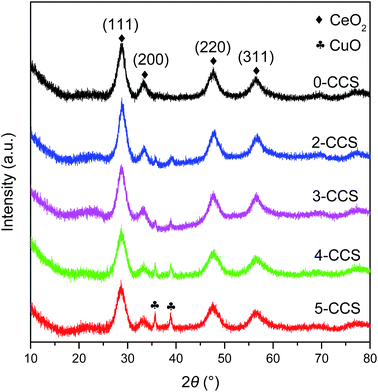
Fig. 1 shows the XRD patterns of different CuO–CeO2/SBA-15 catalysts. It is clear that all the samples display strong diffraction peaks at 2θ = 28.8, 33.3, 47.9, and 56.8°, corresponding to cubic fluorite CeO2 phase (JCPDS 34-0394).30On the other hand, for the 0-CCS sample, diffraction peaks due to copper species cannot be observed, indicating that the size of copper species on the catalyst is smaller than the XRD detection limit or as a Cu–Ce–O solid solution or a combination of these two phenomena.31,32 However, two weak CuO diffraction peaks appear at 2θ = 35.5 and 38.7° [JCPDS 41-0254] for the samples prepared with surfactant, and the intensity of these diffraction peaks increases gradually with the increase of PEG content in the impregnating solutions, suggesting an increase in crystallite size of CuO.33
Table 1 lists the crystal sizes of CuO and CeO2 on the different CuO–CeO2/SBA-15 catalysts estimated by the Scherrer formula. It can be seen that the crystallite size of CuO increases progressively with increasing the contents of PEG. However, the size of CeO2 is slightly influenced by the PEG contents, and is quite small in the range of 3.5–4.5 nm. On the other hand, the lattice parameters of CeO2 on all the CuO–CeO2/SBA-15 catalysts are smaller than that of pure CeO2 (0.5414 nm).4,5 This result indicates that lattice constriction has taken place on all the CuO–CeO2/SBA-15 catalysts compared with pure CeO2, suggesting that some Cu2+ ions have been incorporated into the CeO2 lattice.34
| Catalyst | DaCuO (nm) | DbCeO2 (nm) | Lattice parameterb (nm) |
|---|---|---|---|
| a The particle size of CuO is the average of the calculated values based on CuO(002) and CuO(111) planes.b The particle size and lattice parameter of CeO2 are based on CeO2(111) plane. | |||
| 0-CCS | — | 4.5 | 0.5368 |
| 2-CCS | 13.7 | 4.5 | 0.5353 |
| 3-CCS | 14.8 | 4.0 | 0.5356 |
| 4-CCS | 18.9 | 3.5 | 0.5376 |
| 5-CCS | 19.9 | 4.0 | 0.5397 |
3.2 N2 physisorption analysis
Fig. 2 shows the N2 adsorption isotherms and the pore size distributions of pristine SBA-15 and various CuO–CeO2/SBA-15 catalysts. It can be seen from Fig. 2a that the isotherms of all the catalysts can be classified as type IV with an H1 hysteresis loop, which is typical for SBA-15 material.25 By comparing the isotherms of all the catalysts with that of SBA-15, one distinction is observed: after introduction of copper and ceria, the forced closure of hysteresis loop shifts to around p/p0 = 0.45 from p/p0 = 0.6 for the pristine SBA-15, which indicates the formation of new pores with smaller sizes probably due to the blockage of mesopores.35,36 From Fig. 2b, the pore size distribution curves of various CuO–CeO2/SBA-15 catalysts show a very wide pore size distribution with two visible maxima at about 3 and 6 nm, respectively. The larger pores appear to be a remnant of the primary mesopores of the pristine SBA-15, while the smaller pores originate from the deposition of oxides particles.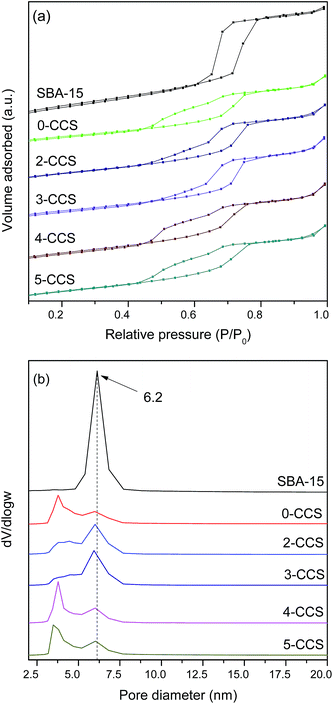 | ||
| Fig. 2 N2 adsorption isotherms (a) and pore size distributions (b) of pristine SBA-15 and various CuO–CeO2/SBA-15 catalysts. | ||
Textural parameters calculated from N2 adsorption isotherms of all the samples studied are summarized in Table 2. It can be seen that the surface areas and pore volumes of all the catalysts are much smaller than that of the pristine SBA-15, which was originated from the deposition of metal oxides into the mesopores.26 On the other hand, the surface area and pore volume of 0-CCS are much smaller than those of the other samples, suggesting that the introduction of PEG in the impregnating solution can effectively prevent the blockage of the mesopores.
| Sample | SBET (m2 g−1) | Vpa (cm3 g−1) | Dpb (nm) | A600/A455c (%) |
|---|---|---|---|---|
| a Pore volume.b Average pore diameter.c The ratio of the peak area of oxygen vacancies to that of main peak. | ||||
| 0-CCS | 339.8 | 0.54 | 5.2 | 46 |
| 2-CCS | 383.0 | 0.61 | 5.6 | 52 |
| 3-CCS | 375.5 | 0.64 | 5.8 | 54 |
| 4-CCS | 403.8 | 0.62 | 5.2 | 44 |
| 5-CCS | 386.3 | 0.59 | 5.2 | 39 |
| SBA-15 | 547.0 | 0.88 | 6.2 | — |
3.3 SEM/EDX characterization
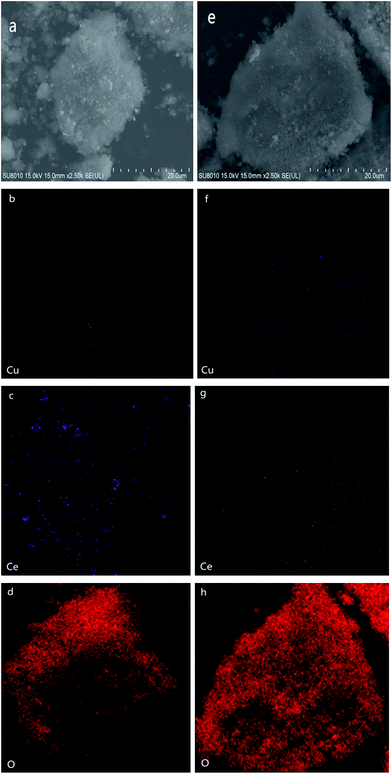
To further investigate the elemental distribution of Cu and Ce on the surface of SBA-15, SEM images and elemental maps of the representative samples (0-CCS and 3-CCS) are collected. As shown in Fig. 3, it is clear that the addition of PEG has a great influence on the elemental distribution of the samples: more Cu and Ce species were dispersed on the SBA-15 surface and the Cu and Ce species were dispersed more homogeneously (3-CCS-f and 3-CCS-g vs. 0-CCS-b and 0-CCS-c).3.4 TEM characterization
To further investigate the distribution of Cu and Ce species on SBA-15, the TEM characterization of 0-CCS and 3-CCS catalysts was performed and the results are shown in Fig. 4. It can be clearly seen that both the catalysts exhibit regular pore channels, implying the preservation of the ordered structure of the carrier after introduction of the copper and cerium species. On the other hand, it can also be found that the particles on the 3-CCS catalyst are more homogeneous on the carrier, but some of the particles are aggregated at the lower edge. To check the nature of the dots, the high-resolution TEM diagram was taken. From the high-resolution TEM diagram, many periodic lattice fringes can be seen, and the interplanar spacing is 0.27 nm (Fig. 4d) and 0.32 nm (Fig. 4c and d), respectively, which is related to CuO(110) plane and CeO2(111) plane. The result indicates that the particles dispersed on the carrier are CuO and CeO2 crystallites for the 3-CCS catalyst, while the CuO particles were not found on the 0-CCS catalyst. From the Fig. 4c and d, it also can be seen that the size range of the CeO2 particles is 4–6 nm, which is consistent with the result obtained from XRD.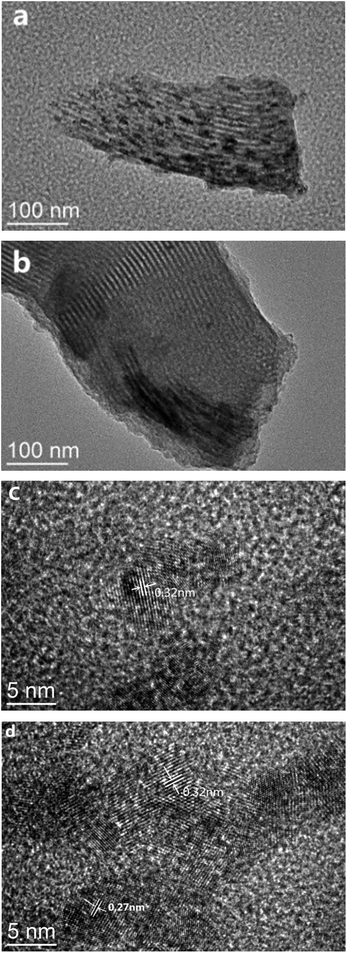 | ||
| Fig. 4 TEM images for various CuO–CeO2/SBA-15 catalysts. 0-CCS with (a) low and (c) high magnification and 3-CCS with (b) low and (d) high magnification. | ||
3.5 Raman study
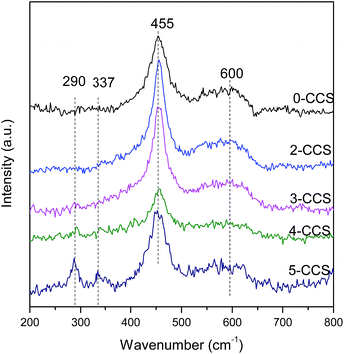
Fig. 5 shows the Raman spectra for different CuO–CeO2/SBA-15 catalysts. It can be see that a strong peak at 455 cm−1 and a weak peak at 600 cm−1 can be observed on all the samples. Furthermore, a distinct redshift of the 455 cm−1 peak can be observed on all the samples compared with the pure CeO2 (460 cm−1).37–39 This phenomenon may be due to the incorporation of Cu2+ into the CeO2 lattice and the improvement of oxygen vacancy concentration. The weak peak at about 600 cm−1 can be attributed to the presence of oxygen vacancies in the CeO2 lattice.26,39,40 The presence of oxygen vacancies on all catalysts is due to the incorporation of Cu2+ into the CeO2 lattice,14 in accordance with the decrease of lattice parameters as shown in Table 1. The ratios of the peak area of oxygen vacancies to that of main peak (A600/A455) for these catalysts are presented in Table 2. The A600/A455 data for the catalysts decrease in the following order: 3-CCS > 2-CCS > 0-CCS > 4-CCS > 5-CCS. The result suggests that the catalyst 3-CCS has the largest amount of oxygen vacancies, indicating the largest amount of Cu2+ dipped into the CeO2 lattice. Moreover, for 4-CCS and 5-CCS, there are two weak peaks at about 290 cm−1 and 337 cm−1 attributed to CuO,14 which is in accordance with the presence of larger CuO particles as shown in XRD data.3.6 XPS study
XPS was used to study the chemical state of the elements and their relative abundance at catalyst surface; the results are presented in Table 3. It is found that the surface concentrations of Cu and Ce on all the catalyst are much lower than their nominal concentrations (5 wt% and 20 wt%, respectively), but increase progressively with increasing of PEG contents. This phenomenon can be attributed to two reasons:25,26,31 (1) the components in the mesopores of the support SBA-15 may not be detected because of the shielding of silica skeleton; (2) as the content of PEG in the impregnating solution is increased, the components are easier to deposit on the external surface of SBA-15 carrier.| Catalyst | Surface compositiona | Ce3+b (%) | Isat/Imainc | |
|---|---|---|---|---|
| Cu (wt%) | Ce (wt%) | |||
| a Determined by XPS.b Relative content as expressed by the intensity of the Ce3+ peak as a percentage of the total Ce 3d area.c The ratio of the intensity of Cu 2p3/2 satellite peak to that of the principal peak. | ||||
| 0-CCS | 1.4 | 2.5 | 11.85 | 0.38 |
| 2-CCS | 2.1 | 6.0 | 20.49 | 0.35 |
| 3-CCS | 3.6 | 12.1 | 27.38 | 0.34 |
| 4-CCS | 4.3 | 16.6 | 13.62 | 0.39 |
| 5-CCS | 4.2 | 17.1 | 17.85 | 0.41 |
The Cu 2p, Ce 3d and O 1s XPS spectra are shown in Fig. 6. From Fig. 6a, it can be deduced that Cu2+ component is present on all the catalysts, which is substantiated by the main peaks of Cu 2p3/2 at about 933.6 eV and the satellite peaks at about 938.0–948.0 eV. They are consistent with the standard binding energy of Cu 2p3/2 for CuO.10 Moreover, the reduced Cu species (at 931.7 eV) can also be found for these catalysts, which may result from strong interaction between copper species and ceria.25,41 The reduction degree of Cu2+ can be obtained by calculating the ratios of the intensities of the satellite peaks to those of the main peaks (Isat/Imain), which is 0.55 for pure CuO.42,43 As shown in Table 3, the Isat/Imain values of all the catalysts are lower than 0.55, further suggesting the presence of low-valence copper species in these CuO–CeO2/SBA-15 catalysts. Furthermore, it is apparent that 3-CCS displays smaller Isat/Imain value than the other catalysts, indicating that the stronger interaction between copper species and ceria has induced the reduction of more amounts of Cu2+ (mainly to Cu+),4 which is regarded as the better CO adsorption site in CO oxidation.44
The Ce 3d complex spectra are shown in Fig. 6b. Two sets of spin-orbital multiplets relating to the 3d3/2 and 3d5/2 contributions, are labeled as u and v, respectively. There are eight peaks: u (900.8–901.3), u′′ (907.6–908.5), u′′′ (916.6–916.9), v (882.6–883.61), v′′ (889.0–889.6), v′′′ (898.5–898.9), u′ (903.1–903.4) and v′ (884.1–885.1) of Ce 3d in the catalysts, which can be assigned to Ce4+ (u, u′′, u′′′, v, v′′, v′′′) and Ce3+ (u′, v′) by comparison with data reported in the literature.45,46 A favorable method, considering the ratio of area under the u′ and v′ peaks to the total Ce 3d region, is applied to calculate the reduction degree of CeO2 (ref. 4 and 47) and the results are listed in Table 3. It can be found that the value of Ce3+(%) for 3-CCS is higher than that of the other samples. According to the literature,48,49 the presence of Ce3+ can facilitate the electron transfer process of Ce3+ + Cu2+ ↔ Ce4+ + Cu+, which is beneficial for achieving outstanding performance in CO oxidation.
The O 1s spectra of the catalysts are shown in Fig. 6c. Two peaks of O 1s are observed at about 532.6 eV and 529.6 eV, respectively. The main peak at higher binding energy (532.6 eV) may be assigned to –OH on the surface of SBA-15, while the shoulder peak at 529.6 eV is characteristic of the lattice oxygen of metal oxides.50 Clearly, the intensity of the peak at 529.6 eV is the strongest on the 3-CCS catalyst which suggests the most amount of lattice oxygen on it.
3.7 DRIFTS study
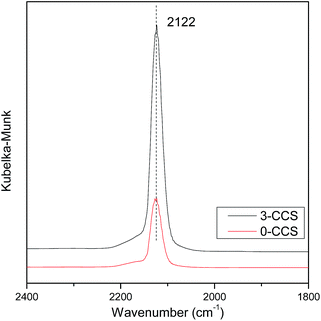
It is well known that the interaction between copper and cerium species will change the valence state of the components, which may affect the catalytic activity of the CuO–CeO2 catalyst. In order to further investigate the state of copper species, the catalysts were characterized by in situ FT-IR, and the results are shown in Fig. 7. According to the literature,25,51 the adsorption of CO molecules on Cu+ gives rise to peak with characteristic vibration frequencies at about 2080–2160 cm−1. It can be seen from Fig. 7 that both the spectra of the 0-CCS and 3-CCS catalysts have a strong peak at about 2122 cm−1, corresponding to Cu+–CO.38,46 The result indicates that a certain amount of Cu+ existed in the catalyst at low temperature, and the catalysts have the ability to adsorb CO at 30 °C. It can also be seen from the figure that the intensity of the peak of the 3-CCS catalyst is significantly stronger than that of the 0-CCS, indicating that the 3-CCS sample has better CO adsorption performance. That is to say, the 3-CCS catalyst has more amount of highly dispersed CuO, and the strong interaction between CuO and CeO2 make more copper species to be reduced to Cu+, which is consistent with the above XPS characterization result.3.8 H2-TPR study
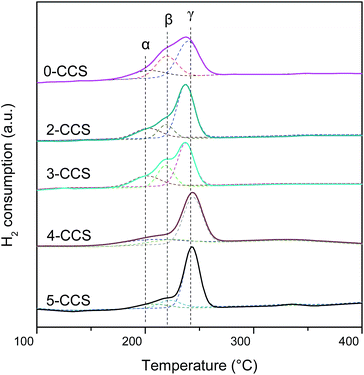
H2-TPR experiments were conducted to investigate the reduction properties of catalysts, and the results are presented in Fig. 8. As shown, there are three peaks (denoted as α, β, and γ, respectively) being detected in all the catalysts. In the literature,25,26 peak α at low temperature is ascribed to the reduction of finely dispersed Cu species strongly interacting with CeO2; peak β at higher temperature is assigned to the reduction of larger particles of Cu species; peak γ is attributed to the reduction of copper species less associated with ceria. However, after introduction of SBA-15, the reduction of copper-ceria catalysts is changed. The first two peaks (α and β) actually reflect the reduction of copper species on ceria. According to the literature,14,15,26,34 it is clear that the impregnation allows a portion of Cu species to be deposited on the support surface, not interacting with CeO2, which is regarded as the most difficult to reduce. Therefore, the peak γ can be ascribed to the reduction of that Cu species.A quantitative attribution of the TPR peaks to different species has been calculated and the results are shown in Table 4. With the increasing of PEG contents from 0 to 3, both α and β peaks shift to lower temperature. However, when the PEG content is higher than 3, both the α and β peaks shift to higher temperature with the increasing of PEG contents. This result suggests that the synergetic effect between the finely dispersed Cu species and CeO2 for the sample 3-CCS is stronger than that for the other catalysts, since the stronger synergy leads to the lower reduction temperature.9,14,15,25
| Sample | Reduction temperature (°C) | Relative intensitya (%) | ||||
|---|---|---|---|---|---|---|
| α | β | γ | Aα | Aβ | Aγ | |
| a Peak area in percentage of total area. | ||||||
| 0-CCS | 202.9 | 219.7 | 239.6 | 17.3 | 31.5 | 51.2 |
| 2-CCS | 202.6 | 219.2 | 237.4 | 19.9 | 15.9 | 64.2 |
| 3-CCS | 200.9 | 218.8 | 237.5 | 21.6 | 26.2 | 52.2 |
| 4-CCS | 205.5 | 223.1 | 243.3 | 18.4 | 14.5 | 67.1 |
| 5-CCS | 206.3 | 222.6 | 243.3 | 13.2 | 12.5 | 74.3 |
From Table 4, it is clear that 3-CCS has more finely dispersed Cu species on ceria (21.6%) than the other samples, which brings about more interfacial CuO and can enhance the synergistic effect between CuO and CeO2. By comparing Aα% values of 0-CCS and 3-CCS (17.3% and 21.6%, respectively), it is notable that the catalyst prepared by surfactant-assisted impregnation method owns the advantage of distributing more finely dispersed Cu species on ceria. However, the Aα% values of x-CCS (x = 2, 3, 4, 5) display a volcano-type behavior, suggesting that too much PEG is not beneficial to distribute Cu species on ceria.
3.9 CO-TPD investigation
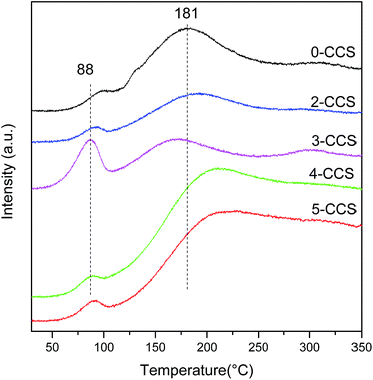
Typical TPD profiles of CO2 after CO adsorption on different CuO–CeO2/SBA-15 catalysts are presented in Fig. 9. In the heating process, the majority of adsorbed CO desorbs as CO2 resulting from different carbonates species produced by the reaction of absorbed CO with lattice oxygen.52 As seen in Fig. 9, the CO-TPD profile of all the catalysts shows two CO2 desorption peaks, including one at lower temperatures (80–100 °C) and the other at higher temperatures (at around 180–210 °C). According to the literature,52 these peaks may be attributed to two CO adsorption approaches: (1) a fraction of CO has formed CO2 at 30 °C, which probably reacts with CeO2 surface and adsorbs as carbonate, and then releases at temperature lower than 100 °C; (2) another fraction of CO probably develops into bidentate carbonate on the reactive sites, which may evolve across intermediate species (maybe as COx) when the temperature increases and eventually desorbs as CO2 at higher temperatures.From Fig. 9, it can be seen that the CO-TPD profile of 3-CCS shows the highest intensity and the lowest temperature for CO2 desorption at 88 °C, implying that the produced carbonate species can desorb more easily. This phenomenon suggests that there is more active lattice oxygen for CO adsorption and reaction which is in agreement with the results of O 1s reflected in XPS analysis. It can be treated as a good indication of enhancing the catalytic activity.53,54 The increase and activation of lattice oxygen may be resulted from the stronger synergetic interaction between copper and ceria.
Based on the above characterization results, it can be inferred that the addition and the content of PEG in the impregnating solution affect the distribution and dispersion of the components on carrier SBA-15. On one hand, the viscosity of the precursor solution increased after the addition of PEG and gradually increased with increasing the content of PEG in the impregnating solutions, which may be detrimental to the entrance of the active components into the channel of the carrier.55 Accordingly, more components would be distributed on the outer surface of the carrier. This supposition was testified by the gradually deepened color of the catalyst precursors (impregnates before being dried) as the PEG content increased (Fig. 10). More specifically, for the 0-CCS catalyst, more amounts of components were confined into the nano-channels of SBA-15, which were highly dispersed on the interior of the mesopores. On the contrary, for the 4-CCS and 5-CCS catalysts, more amounts of components were deposited on the external surface, thus resulting in larger CuO particles due to the sintering during thermal treatment. For the 2-CCS and 3-CCS catalysts, a suitable amount of components were deposited and highly dispersed on the external surface of the carrier. On the other hand, the introduction of PEG in the impregnating solution can make more amounts of copper species in contact with ceria. This phenomenon was similar to that observed on the CuO–CeO2/SBA-15 catalyst prepared by solid state impregnation.25 Therefore, the interaction between copper and ceria was enhanced as evidenced by the results of H2-TPR, CO-TPD, XPS and FT-IR characterizations.
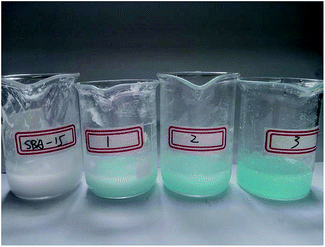 | ||
| Fig. 10 The photographs of SBA-15 and the precursors corresponding to different catalysts: (1) 0-CCS, (2) 3-CCS, and (3) 5-CCS. | ||
3.10 Activity of catalysts
Fig. 11 shows CO oxidation activities of CuO–CeO2/SBA-15 catalysts. The T99 (temperature for the CO conversion of 99%) values are 195, 160, 155, 200 and 235 °C, for the catalysts 0-CCS, 2-CCS, 3-CCS, 4-CCS, and 5-CCS, respectively. Thus, the catalytic activity of different catalysts increases in the order of 5-CCS < 4-CCS < 0-CCS < 2-CCS < 3-CCS. The result suggests that the content of PEG has a significant influence on the catalytic performance of the CuO–CeO2/SBA-15 catalysts: suitable amount of PEG can promote the catalytic activity but too much PEG decreases the catalytic activity.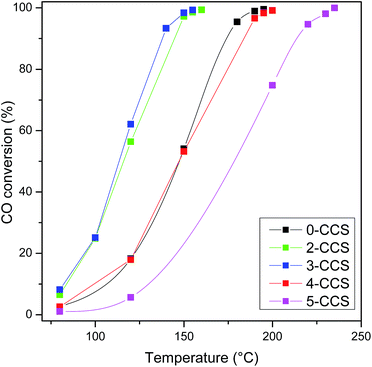 | ||
Fig. 11 CO oxidation activities of various CuO–CeO2/SBA-15 catalysts. Reaction conditions: compositions of feed gas = 1 vol% CO, 2.5 vol% O2, and 96.5 vol% N2, GHSV = 36![[thin space (1/6-em)]](https://www.rsc.org/images/entities/char_2009.gif) 000 mL gcat−1 h−1. 000 mL gcat−1 h−1. | ||
The mechanism for the catalytic CO oxidation reaction on CuO–CeO2 catalyst has been studied by some research groups:15,56 at first, the gas-phase CO adsorbs mainly on Cu+, which is stabilized at the interface of copper species and ceria. Then, the adsorbed CO on Cu+ reacts with lattice oxygen to form the CO2, and the formation of surface oxygen vacancies, Ce3+ and active adsorption sites Cu+ is happening at the same time. At last, the oxygen vacancies, Cu+ and Ce3+ are re-oxidized by gas-phase O2 to complete the catalytic cycle. According to this reaction mechanism, the higher activity of the 3-CCS catalyst for CO oxidation can be attributed to the higher amounts of Cu+ and lattice oxygen, which were evidenced by XPS, FT-IR, and CO-TPD techniques. On the other hand, it can be surmised that the effective contact between CuO and CeO2 is pivotal for the CuO–CeO2/SBA-15 catalysts, while the copper species dispersed on SBA-15 contribute little to the catalytic activity. From the N2 physisorption, SEM/TEM, and XPS results, it can be seen that the copper and ceria are easier to be distributed on external surface of SBA-15 after the employment of PEG. Okumura et al.57 studied the activity of Au catalysts supported on MCM-41 and found that the Au particles which incorporated into the channels of MCM-41 do not take part in the chemical reaction. Similarly, for SBA-15-supported copper nanoparticles, Tu et al.20 found that some Cu particles which confined deep into the channels do not take part in the reaction. In our case, more amounts of CuO positioned at the external surface of SBA-15 or near the pore opening after the addition of a suitable amount of PEG. However, too much PEG (>3) led to the deposition of excessive copper species on the exterior of mesopores and thus the growth of CuO nanoparticles (Fig. 1). It is well known that larger bulk CuO particles contribute very little or even negatively to the activity for CO oxidation owing to the coverage of active species on the catalyst surface.7,11,58 Therefore, the lower activity of the 4-CCS and 5-CCS catalysts can be accounted for by the presence of more amounts of larger bulk CuO particles as evidenced by the XRD and Raman characterization results.
4. Conclusions
In summary, a surfactant-assisted impregnation method was reported to prepare the CuO–CeO2/SBA-15 catalysts for CO oxidation. The catalyst with the optimum PEG 200 content of VPEG![[thin space (1/6-em)]](https://www.rsc.org/images/entities/char_2009.gif) :
:![[thin space (1/6-em)]](https://www.rsc.org/images/entities/char_2009.gif) VH2O = 3
VH2O = 3![[thin space (1/6-em)]](https://www.rsc.org/images/entities/char_2009.gif) :
:![[thin space (1/6-em)]](https://www.rsc.org/images/entities/char_2009.gif) 3 in the impregnating solution was found to have the best catalytic performance. The employment of PEG 200 can distribute more copper and ceria on external surface of SBA-15 and lead to the more finely dispersed Cu species on ceria, which is beneficial to higher activity for CO oxidation. However, too much PEG 200 leads to the growth of CuO nanoparticles and thus weakens the catalytic activity.
3 in the impregnating solution was found to have the best catalytic performance. The employment of PEG 200 can distribute more copper and ceria on external surface of SBA-15 and lead to the more finely dispersed Cu species on ceria, which is beneficial to higher activity for CO oxidation. However, too much PEG 200 leads to the growth of CuO nanoparticles and thus weakens the catalytic activity.
Acknowledgements
The authors thank financial support from the National Natural Science Foundation of China (21273150) and the ‘ShuGuang’ Project (10GG23) of Shanghai Municipal Education Commission and Shanghai Education Development Foundation.References
- H. Wan, D. Li, Y. Dai, Y. Hu, Y. Zhang, L. Liu, B. Zhao, B. Liu, K. Sun, L. Dong and Y. Chen, Appl. Catal., A, 2009, 360, 26–32 CrossRef CAS.
- M. F. Luo, Y. J. Zhong, X. X. Yuan and X. M. Zheng, Appl. Catal., A, 1997, 162, 121–131 CrossRef CAS.
- X. C. Zheng, S. H. Wu, S. P. Wang, S. R. Wang, S. M. Zhang and W. P. Huang, Appl. Catal., A, 2005, 283, 217–223 CrossRef CAS.
- S. S. Sun, D. S. Mao, J. Yu, Z. Q. Yang, G. Z. Lu and Z. Ma, Catal. Sci. Technol., 2015, 5, 3166–3181 CAS.
- Y. L. Zheng, D. S. Mao, S. S. Sun and G. Y. Fu, J. Nanopart. Res., 2015, 17, 471–482 CrossRef.
- X. Tang, B. Zhang, Y. Li, Y. Xu, Q. Xin and W. Shen, Appl. Catal., A, 2005, 288, 116–125 CrossRef CAS.
- M. F. Luo, Y. P. Song, J. Q. Lu, X. Y. Wang and Z. Y. Pu, J. Phys. Chem. C, 2007, 111, 12686–12692 CAS.
- A. Tschöpe, D. Schaadt, R. Birringer and J. Y. Ying, Nanostruct. Mater., 1997, 9, 423–432 CrossRef.
- W. Liu and M. Flytzaniste-phanopoulos, J. Catal., 1995, 153, 304–316 CrossRef CAS.
- X. Tang, B. Zhang, Y. Li, Y. Xu, Q. Xin and W. Shen, Catal. Today, 2004, 93, 191–198 CrossRef.
- Y. L. Zheng, D. S. Mao, S. S. Sun and G. Y. Fu, J. Mater. Sci., 2016, 51, 917–925 CrossRef CAS.
- W. P. Dow, Y. P. Wang and T. J. Huang, Appl. Catal., A, 2000, 190, 25–34 CrossRef CAS.
- J. B. Wang, W. H. Shih and T. J. Huang, Appl. Catal., A, 2000, 203, 191–199 CrossRef CAS.
- G. Aguila, F. Gracia and P. Araya, Appl. Catal., A, 2008, 343, 16–24 CrossRef CAS.
- J. Astudillo, G. Águila, F. Díaz, S. Guerrero and P. Araya, Appl. Catal., A, 2010, 381, 169–176 CrossRef CAS.
- G. Aguila, S. Guerrero and P. Araya, Appl. Catal., A, 2013, 462, 56–63 CrossRef.
- J. Luo, W. Chu, H. Xu, C. Jiang and T. Zhang, J. Nat. Gas Chem., 2010, 19, 355–361 CrossRef CAS.
- K. N. Rao, P. Bharali, G. Thrimurthulu and B. M. Reddy, Catal. Commun., 2010, 11, 863–866 CrossRef CAS.
- X. Ma, H. Sun, Q. Sun, X. Feng, H. Guo, B. Fan, S. Zhao, X. He and L. Lv, Catal. Commun., 2011, 12, 426–430 CrossRef CAS.
- C. H. Tu, A. Q. Wang, M. Y. Zheng, X. D. Wang and T. Zhang, Appl. Catal., A, 2006, 297, 40–47 CrossRef CAS.
- X. Liu, A. Wang, X. Wang, C. Y. Mou and T. Zhang, Chem. Commun., 2008, 44, 3187–3189 RSC.
- A. Chirieac, B. Dragoi, A. Ungureanu, C. Ciotonea, I. Mazilu, S. Royer, A. S. Mamede, E. Rombi, I. Ferino and E. Dumitriu, J. Catal., 2016, 339, 270–283 CrossRef CAS.
- Á. Reyes-Carmona, R. Moreno-Tost, J. Mérida-Robles, J. Santamaría-González, P. J. Maireles-Torres, A. Jiménez-López, E. Moretti, M. Lenarda and E. Rodríguez-Castellón, Adsorption, 2011, 17, 527–538 CrossRef.
- Á. Reyes-Carmona, A. Arango-Díaz, E. Moretti, A. Talon, L. Storaro, M. Lenarda, A. Jiménez-López and E. Rodríguez-Castellón, J. Power Sources, 2011, 196, 4382–4387 CrossRef.
- C. J. Tang, J. F. Sun, X. J. Yao, Y. Cao, L. C. Liu, C. Y. Ge, F. Gao and L. Dong, Appl. Catal., B, 2014, 146, 201–212 CrossRef CAS.
- T. Tsoncheva, G. Issa, T. Blasco, M. Dimitrov, M. Popova, S. Hernández, D. Kovacheva, G. Atanasova and J. M. L. Nieto, Appl. Catal., A, 2013, 453, 1–12 CrossRef CAS.
- T. Tsoncheva, G. Issa, J. M. L. Nieto, T. Blasco, P. Concepcion, M. Dimitrov, G. Atanasova and D. Kovacheva, Microporous Mesoporous Mater., 2013, 180, 156–161 CrossRef CAS.
- F. Zhao, S. Chen, J. Zhou and A. Zhang, J. Porous Mater., 2012, 19, 869–876 CrossRef CAS.
- G. Chang, M.S. thesis, Xiamen University, 2011.
- J. L. Cao, Y. Wang, T. Y. Zhang, S. H. Wu and Z. Y. Yuan, Appl. Catal., B, 2008, 78, 120–128 CrossRef CAS.
- E. S. Gnanakumar, J. M. Naik, M. Manikandan, T. Raja and C. S. Gopinath, ChemCatChem, 2014, 6, 3116–3124 CrossRef CAS.
- Z. Wang, Z. Qu, X. Quan, Z. Li, H. Wang and R. Fan, Appl. Catal., B, 2013, 134, 153–166 CrossRef.
- H. Mai, D. Zhang, L. Shi, T. Yan and H. Li, Appl. Surf. Sci., 2011, 257, 7551–7559 CrossRef CAS.
- M. F. Luo, J. M. Ma, J. Q. Lu, Y. P. Song and Y. J. Wang, J. Catal., 2007, 246, 52–59 CrossRef CAS.
- Y. Li, Y. J. Guan, R. A. V. Santen, P. J. Kooyman, I. Dugulan, C. Li and E. J. M. Hensen, J. Phys. Chem. C, 2009, 113, 21831–21839 CAS.
- J. C. Groen, L. A. A. Peffer and J. Pérez-Ramírez, Microporous Mesoporous Mater., 2003, 60, 1–17 CrossRef CAS.
- D. Gamarra, A. L. Cámara, M. Monte, S. Rasmussen, L. Chinchilla, A. Hungria, G. Munuera, N. Gyorffy, Z. Schay and V. C. Corberán, Appl. Catal., B, 2013, 130, 224–238 CrossRef.
- J. Li, Y. X. Han, Y. H. Zhu and R. X. Zhou, Appl. Catal., B, 2013, 108, 72–80 Search PubMed.
- A. P. Jia, G. S. Hu, L. Meng, Y. L. Xie, J. Q. Lu and M. F. Luo, J. Catal., 2012, 289, 199–209 CrossRef CAS.
- R. Kydd, W. Y. Teoh, K. Wong, Y. Wang, J. Scott, Q. H. Zeng, A. B. Yu, J. Zou and R. Amal, Adv. Funct. Mater., 2009, 19, 369–377 CrossRef CAS.
- S. P. Wang, X. Y. Wang, J. Huang, S. M. Zhang, S. R. Wang and S. H. Wu, Catal. Commun., 2007, 8, 231–236 CrossRef CAS.
- L. Kundakovic and M. Flytzani-Stephanopoulos, Appl. Catal., A, 1998, 171, 13–29 CrossRef CAS.
- G. Avgouropoulos and T. Ioannides, Appl. Catal., B, 2006, 67, 1–11 CrossRef CAS.
- M. S. P. Francisco, V. R. Mastelaro, P. A. P. Nascente and A. O. Florentino, J. Phys. Chem. B, 2001, 105, 10515–10522 CrossRef CAS.
- G. Y. Fu, D. S. Mao, S. S. Sun, J. Yu and Z. Q. Yang, J. Ind. Eng. Chem., 2015, 31, 283–290 CrossRef CAS.
- L. Qi, Q. Yu, Y. Dai, C. Tang, L. Liu, H. Zhang, F. Gao, L. Dong and Y. Chen, Appl. Catal., B, 2012, 119, 308–320 CrossRef.
- L. H. Reddy, G. K. Reddy, D. Devaiah and B. M. Reddy, Appl. Catal., A, 2012, 445, 297–305 CrossRef.
- J. Holgado, G. Munuera, J. Espinós and A. González-Elipe, Appl. Surf. Sci., 2000, 158, 164–171 CrossRef CAS.
- C. S. Polster, H. Nair and C. D. Baertsch, J. Catal., 2009, 266, 308–319 CrossRef CAS.
- S. Y. Yao, K. Mudiyanselage, W. Q. Xu, A. C. Johnston-Peck, J. C. Hanson, T. P. Wu, D. Stacchiola, J. A. Rodriguez, H. Y. Zhao, K. A. Beyer, K. W. Chapman, P. J. Chupas, A. Martínez-Arias, R. Si, T. B. Bolin, W. J. Liu and S. D. Senanayake, ACS Catal., 2014, 4, 1650–1661 CrossRef CAS.
- K. I. Hadjiivanov and G. N. Vayssilov, Adv. Catal., 2002, 47, 307–511 CAS.
- J. Li, P. Zhu, S. Zuo, Q. Huang and R. Zhou, Appl. Catal., A, 2010, 381, 261–266 CrossRef CAS.
- T. Caputo, L. Lisi, R. Pirone and G. Russo, Appl. Catal., A, 2008, 348, 42–53 CrossRef CAS.
- S. M. Ma, G. Z. Lu, Y. X. Shen, Y. Guo, Y. Q. Wang and Y. L. Guo, Catal. Sci. Technol., 2011, 1, 669–674 CAS.
- Q. Q. Xu, Y. L. Ma, J. Z. Yin, A. Q. Wang and J. J. Gao, J. Supercrit. Fluids, 2014, 92, 100–106 CrossRef CAS.
- G. Sedmak, S. Hočevar and J. Levec, J. Catal., 2004, 222, 87–99 CrossRef CAS.
- M. Okumura, S. Tsubota and M. Haruta, J. Mol. Catal. A: Chem., 2003, 199, 73–84 CrossRef CAS.
- J. Qin, J. Lu, M. Cao and C. Hu, Nanoscale, 2010, 2, 2739–2743 RSC.
| This journal is © The Royal Society of Chemistry 2017 |

