 Open Access Article
Photoelectrocatalytic reduction of carbon dioxide to methanol at cuprous oxide foam cathode
Jiongliang
Yuan
 *a,
Xuan
Wang
a,
Chunhui
Gu
b,
Jianjun
Sun
b,
Wenming
Ding
b,
Jianjun
Wei
a,
Xiaoyu
Zuo
b and
Cunjiang
Hao
c
aDepartment of Environmental Science and Engineering, Beijing University of Chemical Technology, Beijing 100029, P. R. China. E-mail: yuanjiongliang@163.com; Tel: +86 10 64427356
bCollege of Chemical Engineering, Beijing University of Chemical Technology, Beijing 100029, P. R. China
cDepartment of Experimental Teaching, Tianjin University of Traditional Chinese Medicine, Tianjin Key Laboratory of Chemistry and Analysis of Chinese Materia Medica, Tianjin 300193, P. R. China
First published on 10th May 2017
Abstract
In order to increase the reduction rate of CO2 to methanol, the photoelectrocatalytic reduction of CO2 at Cu2O foam electrodes is proposed. The Cu2O foam electrodes are fabricated by electrodeposition of Cu2O coatings on copper foam substrates. The effect of bath pH and deposition time on the morphology and structure is investigated. The Cu2O foam electrodes deposited at bath pH 10 for 20 min exhibit higher intensity of (111) diffraction peak. The photoelectrocatalytic performance of Cu2O foam electrodes for CO2 reduction to methanol depends largely on exposed Cu2O{111} facets. At the applied potential of −1.5 V (vs. saturated calomel electrode), the optimum methanol concentration and the faradaic efficiency of methanol formation are obtained within 1.5 h, and they are 1.41 mM and 29.1%, respectively. The formation rate of methanol achieves 23.5 µmol cm−2 h−1 within 1.5 h.
1. Introduction
Due to burning of fossil fuel in industrial activities, CO2 concentration in the atmosphere has been increasing dramatically for decades, causing serious global warming. In order to reduce the emission of CO2, such routes as chemical reduction, photochemical reduction, electrochemical reduction, biological reduction, reforming and inorganic conversion have been developed. Among those, photochemical and electrochemical routes are more promising.1 A lot of semiconductor photocatalysts have been developed for CO2 reduction, such as Cu-loaded TiO2, NiO/InTaO4 and Ni@NiO core–shell structure-modified nitrogen-doped InTaO4 semiconductor.2–4 With the catalysis of Ni@NiO core–shell structure-modified nitrogen-doped InTaO4 semiconductor, methanol yield is up to 170 µmol g−1 h−1.4 However, the photocatalytic reduction of CO2 is usually observed with low yield of methanol and poor selectivity.1 Electrochemical reduction of CO2 produces some valuable chemicals, such as CO, formic acid, formaldehyde, methanol, oxalic acid and methane; and the selectivity and yield of CO2 reduction depends heavily on the catalysts and operation condition.5–7 CO2 is electrochemically reduced to methanol at III–V semiconductor (GaAs and InP), Mo and Re electrodes; nevertheless, the rate of methanol formation is low.8–13 At Cu2O electrode surface, methanol production rate as high as 43 µmol cm−2 h−1 and faradaic efficiency up to 38% within 10 min have been reported; however, the activity of Cu2O electrode decreases suddenly, and the reduction reaction of CO2 to methanol stops within 30 min.14 In order to improve the stability of Cu2O electrodes, Cu2O/ZnO-based carbon paper electrodes have been fabricated.15 The electrodes including ZnO are stable after 5 h, but the rate of methanol formation is only 11.41 µmol cm−2 h−1.15Both photochemical and electrochemical routes have low yield of methanol.1 In photoelectrochemical system, the separation of light-driven electrons and holes in the semiconductor catalysts is promoted, and the reduction and oxidation reaction zones are fully separated; therefore, the yield and selectivity of methanol is enhanced.1 In addition, compared to electrochemical route, photoelectrochemical route can reduce the consumption of external electric energy.1 In our previous study, the photoelectrochemical reduction of CO2 to methanol at p type CuInS2 thin film photocathode has been proposed, with the overpotential of 20 mV and the faradaic efficiency of 97%;16 however, due to the mass transfer resistance resulting from pyridine adsorption layer on CuInS2 electrode, the rate of methanol formation is only 5.9 µmol cm−2 h−1.17
Copper foam has large surface area, well-defined pore size and high conductivity, it is therefore a better support for catalysts than conventional planar supports. It is expected to improve the catalytic performance of Cu2O for CO2 reduction by loading Cu2O catalysts on copper foam support. In this study, Cu2O foam electrodes are fabricated and their photoelectrocatalytic performance for CO2 reduction to methanol is examined.
2. Experimental
2.1. Fabrication of Cu2O foam electrodes
Cu2O foam electrodes were fabricated by electrodeposition of Cu2O coatings on copper foam substrates. A copper foam with the thickness of 0.5 mm was firstly cleaned by sonicating in detergent, acetone and ethanol in turn, then etched in diluted sulphuric acid, and finally cleaned with deionized water. The copper foam (2 cm2) was used as the working electrode for electrodeposition. A platinum foil and a saturated calomel electrode (SCE) were used as the counter electrode and reference electrode, respectively. The electrodeposition was carried out by a CHI650D electrochemical workstation (Shanghai Chenhua Instrument Co. Ltd., Shanghai, P. R. China). The electrodeposition bath contained 0.4 mM CuSO4 and 3 M lactic acid (LA), and was adjusted to pH 9–12 by adding NaOH aqueous solution.14,18,19 The bath temperature was kept at 60 °C during electrodeposition, and the deposition potential was set to be −0.60 V (vs. SCE).The morphology of Cu2O foam electrodes was determined by field emission scanning electron microscopy (FESEM, S-4700, Hitachi, Japan). The crystal structure of thin films was determined by X-ray diffractometry (XRD, Bruker D8 Advance, Germany) using Cu Kα radiation (λ = 1.54056 Å), and the crystal grain size was then calculated from X-ray line broadening using the Scherrer's equation. The UV-vis spectra of Cu2O foam electrodes were measured with UV-vis-NIR spectrophotometer (UV-3600, Shimadzu, Japan), and the scanning wavelength was ranged from 400 to 700 nm.
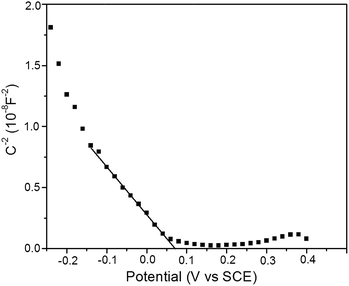
The measurement of Mott–Schotty plot was carried out at 10 kHz in a quartz glass beaker containing 0.1 M KHCO3 solution by an electrochemistry work station CHI650D. A standard three-electrode arrangement was used with Cu2O foam electrodes (2 cm2) as the working electrode, graphite sheet as the counter electrode and SCE as the reference electrode. The scanning potential was set from −0.25 to 0.40 V (vs. SCE). The visible light irradiation was emitted from xenon lamp (AULTT, Beijing, P. R. China) with the irradiation intensity of 100 mW cm−2 on the surface of the thin film electrode. In Mott–Schotty plot, the extrapolated linear portion where the line crosses the x-axis could be used to calculate the flat band potential by the formula
| C−2 = (2/eε0εA2NA)(E − Efb − Kt/e) | (1) |
2.2. Photoelectrocatalytic reduction of CO2
CO2 reduction experiments were performed in a quartz glass beaker by electrochemistry work station CHI650D. A conventional three-electrode cell was used with Cu2O foam electrode (2 cm2) as the working electrode, graphite sheet as the counter electrode and SCE as the reference electrode. The irradiation intensity on the working electrode was calibrated to be 100 mW cm−2.The electrolyte solution used for the photoelectrocatalytic reduction of CO2 was 0.1 M KHCO3 solution (50 mL). All experiments were performed at 25 °C and ambient pressure. Prior to the reduction experiment, the electrolyte solution was saturated with CO2 gas (99.99%) by bubbling for 30 min. CO2 gas was continuously aerated at a flow rate of 60 mL min−1 during the electrolysis process. The faradaic efficiency for producing methanol was calculated assuming six electrons are required per methanol molecule.
Liquid product analysis was accomplished using gas chromatography-mass spectroscopy (GC-MS, Trace 1300-ISQ, ThermoFisher Scientific, USA). Methanol concentration was measured by a gas chromatography (GC 2014C, Shimadzu, Japan) with a DB-Wax (30 m × 0.53 mm × 3.00 µm, Agilent Technologies). The injector temperature was held at 200 °C, the oven temperature rose from 50 to 200 °C at the rate of 5 °C min−1, and the detector temperature was kept at 230 °C. Five runs were done for one experiment.
3. Results and discussion
3.1. Fabrication of Cu2O foam electrodes by electrodeposition
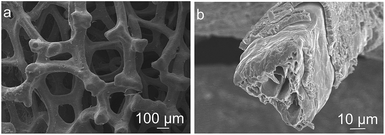
At bath pH 9–12, Cu2O coatings on copper foam substrate can be obtained from a lactate-stabilized CuSO4 solution. The FESEM images of Cu2O foam electrodes electrodeposited at bath pH 10 for 30 min are shown in Fig. 1.It can be observed that the Cu2O foam electrode has three-dimensional network structure (Fig. 1a), and copper foam substrate is covered with a 4 µm-thick-coating (Fig. 1b); in addition, the coaxial structure of outer Cu2O coatings and inner copper wire forms (Fig. 1b). Compared to the conventional planar electrode, the three-dimensional network structure of the Cu2O foam electrode provides much high specific surface area, which promotes the full contact of the catalytic active centers with the reactants in CO2 reduction. Additionally, the coaxial structure of the Cu2O foam electrode promotes the charge transfer between Cu2O crystal grains and copper wires.
The electrodeposition bath pH has a significant influence on the morphology of Cu2O coatings as shown in Fig. 2. The surface of Cu2O coatings deposited at bath pH 9 and 10 exhibits pyramid and truncated pyramid geometry, respectively. At bath pH over 11, the surface of Cu2O coatings shows prism geometry, and the Cu2O particles become large as pH increases.
The XRD patterns of Cu2O foam electrodes deposited at various bath pH are investigated (Fig. 3). The peaks at 43.4°, 50.5° and 74.1° can be indexed to Cu(111), (200) and (222) facets; the peaks at 29.8°, 37.4°, 50.8° and 61.8° can be indexed to cuprite Cu2O(110), (111), (200) and (220) facets, and a very strong peak at 37.4° indicates the preferential growth along (111) facet.
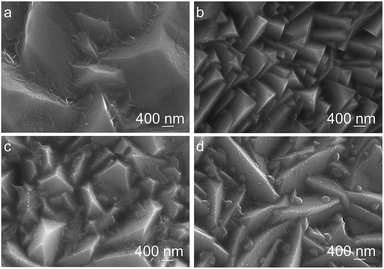 | ||
| Fig. 2 FESEM image of Cu2O coatings electrodeposited at various bath pH. (a) pH = 9, (b) pH = 10, (c) pH = 11, (d) pH = 12. | ||
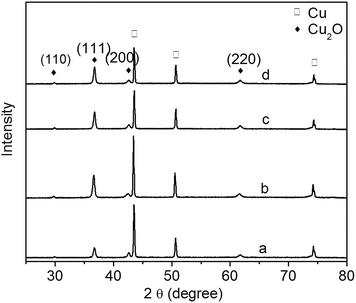 | ||
| Fig. 3 XRD patterns of Cu2O foam electrodes from electrodeposition solution of various bath pH. (a) pH = 9, (b) pH = 10, (c) pH = 11, (d) pH = 12. | ||
At lower bath pH (<7), due to the reduction of Cu2O, metallic Cu may occur (eqn (2)).18,19
| Cu2O + 2e + 2H+ → 2Cu + H2O | (2) |
However, at higher bath pH and lower deposition potential (below −0.6 V vs. SCE), the reduction of Cu2O is forbidden.18,19 Since all deposition experiments have been carried out at higher bath pH in this study, there is less possibility to form metallic Cu in the electrodeposition of Cu2O coatings. In order to verify that no metallic Cu produces in the electrodeposition, Cu2O thin films have been electrodeposited on indium tin oxide conductive glass instead of copper foam substrate, and no diffraction peaks of metallic Cu are detected for the thin films. Therefore the diffraction peaks of metallic Cu are resulted from copper foam substrate.
It has been reported that the preferential facet depends on bath pH: the preferential facet is (200) facet at pH below 9, while it becomes (111) facet at pH above 9.20 In the present study, due to the higher pH, all of the samples have the preferential facet of (111). There are two forms of Cu(II), [Cu(OH)n]2−n and [Cu(LA)n]2−n, existing in a basic solution: [Cu(LA)n]2−n dominates at lower pH, and [Cu(OH)n]2−n dominates at higher pH.21 It is therefore concluded that [Cu(OH)n]2−n promotes the crystal growth along (111) facet.
The diffraction peak intensity of Cu2O(111) facet is bath pH dependent (Fig. 3). The peak becomes strong when pH goes up from 9 to 10, indicating that more {111} facets exposed on the surface are formed;22 however, it becomes weak gradually at pH above 10. The relationship of Cu2O grain size to bath pH is shown in Table 1. The grain size varies between 24 and 28 nm, and it becomes large as pH increases. This is because grain size is related to the preferred orientation, and the preferred orientation is pH dependent.20,23
| Bath pH | Grain size (nm) |
|---|---|
| 9 | 24.82 |
| 10 | 26.46 |
| 11 | 26.87 |
| 12 | 27.47 |
Fig. 4 shows the UV-vis spectra and bandgap of Cu2O foam electrodes deposited at various bath pH. All of Cu2O foam electrodes exhibit strong absorbance in the visible light range, especially in 400–550 nm range. Roughly speaking, the absorbance edge and the bandgap (1.94–1.92 eV) remains unchanged as bath pH increases.
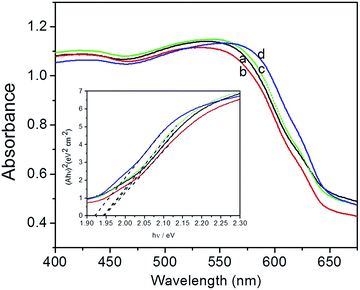 | ||
| Fig. 4 UV-vis spectra and bandgap (inset) of Cu2O foam electrodes from various bath pH. (a) pH = 9, (b) pH = 10, (c) pH = 11, (d) pH = 12. | ||
The XRD patterns of Cu2O foam electrodes electrodeposited at various deposition time are shown in Fig. 5. All samples show the preferential growth along (111) facet. Compared to the samples deposited for 10 and 30 min, the sample deposited for 20 min exhibits the stronger diffraction peak of Cu2O(111) facet, indicating that more {111} facets exposed on the surface are formed.22 The grain size of Cu2O coatings increases from 25.48 nm for 10 min to 26.89 nm for 30 min.
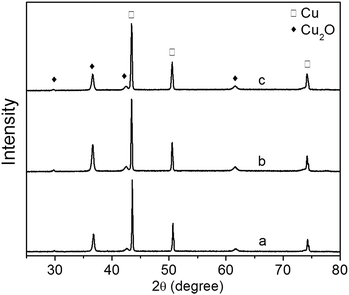 | ||
| Fig. 5 XRD patterns of Cu2O foam electrodes electrodeposited at various deposition time. (a) 10 min, (b) 20 min, (c) 30 min. | ||
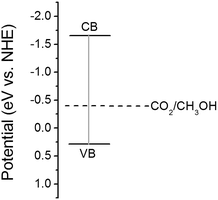
Mott–Schotty plot of Cu2O foam electrode electrodeposited for 20 min at bath pH 10 is shown in Fig. 6. The flat band potential is calculated to be 0.05 V (vs. SCE). In addition, the slope of the linear portion is associated with the conductivity type of the Cu2O coatings. The negative slope indicates that the conductivity of the Cu2O coatings is p-type. For p-type semiconductors, the flatband potential is roughly equal to its valence band potential; therefore, the potentials of conduction band and valence band are calculated to be −1.64 and 0.29 eV (vs. normal hydrogen electrode, NHE), respectively. The band structure in Cu2O coatings is schemed in Fig. 7. Since the conduction band potential of Cu2O coatings is more negative than the reduction potential of CO2 to methanol, Cu2O coatings should have the photocatalytic ability for reducing CO2 to methanol.
3.2. Photoelectrocatalytic reduction of CO2
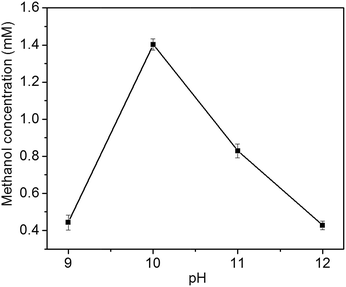
In the liquid product of photoelectrocatalytic reduction of CO2, only methanol is detected by GC-MS in this study. In contrast, ethanol, formic acid, formaldehyde, propanol, acetic acid and methanol is obtained at Cu2O cathode by Yadav et al.24 The different products might be resulted from the different preferential growth facets of Cu2O electrode: methanol is the major product at Cu2O{111} facet, while ethanol is the major product at Cu2O{100} facet.24The photoelectrocatalytic performance of Cu2O foam electrodes is dependent on electrodeposition bath pH (Fig. 8). Methanol concentration increases with bath pH from 9 to 10, and reach a maximum at bath pH 10, then decreases with bath pH from 10 to 12. The behaviour of photoelectrocatalytic performance over bath pH is similar to that of Cu2O(111) peak intensity over bath pH (Fig. 3), indicating that the photoelectrocatalytic performance of Cu2O foam electrodes depends largely on exposed Cu2O{111} facets. It has been suggested that Cu2O can stabilize reaction intermediates of CO2 reduction, methoxy adsorbates (H3CO−–), and the unsaturated oxygen atoms at Cu2O{111} facets act as hydrogen donor sites in CO2 reduction,25,26 then Cu2O{111} facets favour hydrogen addition to the oxygen atom of H3CO−– adsorbate rather than carbon atom;14 therefore, methanol is formed.
The effect of Cu2O foam electrodes deposited for various deposition time on methanol concentration is shown in Fig. 9. Compared to those deposited for 10 and 30 min, Cu2O foam electrodes deposited for 20 min gives the optimum methanol concentration (1.41 mM) within 1.5 h. It might be associated with more exposed Cu2O{111} facets for the electrode deposited for 20 min (Fig. 5).
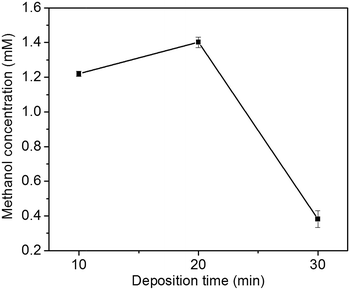 | ||
| Fig. 9 Effect of Cu2O foam electrodes electrodeposited for various deposition time on methanol concentration. | ||
The relationship of methanol concentration to the applied potential is presented in Fig. 10a. Methanol concentration increases from 0.26 to 1.41 mM with the increase of the applied potential from −1.1 to −1.5 V, then decreases with the increase of the applied potential from −1.5 to −1.7 V. The faradaic efficiency of methanol formation at various applied potential is presented in Fig. 10b. The highest faradaic efficiency, 29.1%, is achieved at −1.5 V. In addition to methanol, hydrogen gas and CO are also formed in CO2 reduction. The decrease of methanol concentration and faradaic efficiency of methanol formation at higher applied potential might be attributed to hydrogen evolution reaction and/or Cu2O reduction.14,15
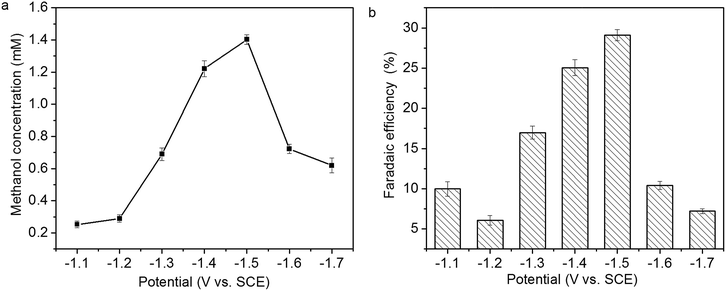 | ||
| Fig. 10 Relationship of (a) methanol concentration and (b) faradaic efficiency of methanol formation to the applied potential. | ||
The influence of reaction time on methanol concentration and faradaic efficiency of methanol formation is shown in Fig. 11a and b. Methanol concentration increases linearly within 1.5 h, then it levels off. The faradaic efficiency of methanol formation also increases within 1.5 h; however, it decreases over 1.5 h, which might be due to the deactivation of Cu2O coatings.14,15
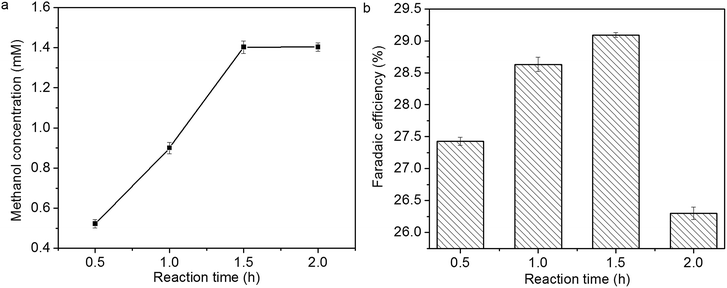 | ||
| Fig. 11 Influence of reaction time on (a) methanol concentration and (b) faradaic efficiency of methanol formation. | ||
In previous study, the activity of Cu2O electrodes derived from electrodeposition and air oxidation decreases suddenly, and methanol formation diminishes over 30 min.14 In this study, the stability of Cu2O foam electrodes are improved, and a high formation rate of methanol (23.5 µmol cm−2 h−1) can be obtained within 1.5 h.
The morphology of Cu2O foam electrode surface during photoelectrocatalytic reaction is examined as shown in Fig. 12. Compared to the as-prepared foam electrode, the electrode surface becomes rough and many fine particles occur after photoelectrocatalytic reaction, and the fine particles become large with reaction time.
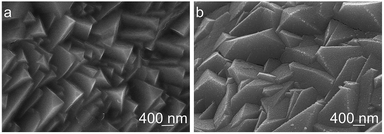 | ||
| Fig. 12 Morphology of Cu2O foam electrodes surface during photoelectrocatalytic reaction. (a) Before reaction, (b) after reaction for 1.5 h. | ||
The XRD patterns of Cu2O foam electrodes before and after photoelectrocatalytic reaction are presented in Fig. 13. The Cu2O(111) peak becomes weak at 0.5 h, and disappears at 1.5 h, indicating that Cu2O is gradually reduced during photoelectrocatalytic reaction.
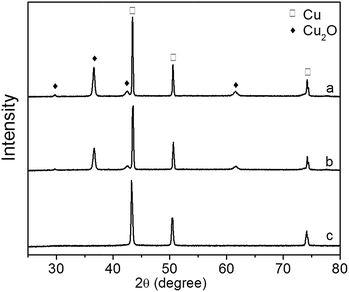 | ||
| Fig. 13 XRD patterns of Cu2O foam electrodes during photoelectrocatalytic reaction. (a) Before reaction, (b) after reaction for 0.5 h, (c) after reaction for 1.5 h. | ||
4. Conclusions
The Cu2O foam electrodes have been fabricated by electrodeposition of Cu2O coatings on copper foam substrate. They have three-dimensional coaxial structure. At bath pH 9–12, cuprite Cu2O coatings can be obtained with (111) facet as the preferential growth facet, and Cu2O grain become larger with increasing pH. All of Cu2O foam electrodes exhibit strong absorbance in the visible light range, especially in 400–550 nm range. The resulted Cu2O foam electrodes show photoelectrocatalytic performance on the reduction of CO2 to methanol. The Cu2O foam electrodes deposited at bath pH 10 for 20 min have higher intensity of (111) diffraction peak, and exhibit higher catalytic activity, indicating that photoelectrocatalytic performance of Cu2O foam electrodes depends largely on exposed Cu2O{111} facets. At the applied potential of −1.5 V (vs. SCE), the optimum methanol concentration and the faradaic efficiency of methanol formation are obtained within 1.5 h, and they are 1.41 mM and 29.1%, respectively. The formation rate of methanol achieves 23.5 µmol cm−2 h−1 within 1.5 h. The gradual reduction of Cu2O leads to the deactivation of Cu2O foam electrodes.Acknowledgements
We gratefully acknowledge National Natural Sciences Foundation of China (Grant No. 21676010) for financial support.Notes and references
- B. Kumar, M. Liorente, J. Froehlich, T. Dang, A. Sathrum and C. P. Kubiak, Annu. Rev. Phys. Chem., 2012, 63, 541 CrossRef CAS PubMed.
- J. C. S. Wu, H.-M. Lin and C.-L. Lai, Appl. Catal., A, 2005, 296, 194 CrossRef CAS.
- P.-W. Pan and Y.-W. Chen, Catal. Commun., 2007, 8, 1546 CrossRef CAS.
- C. W. Tsai, H. M. Chen, R.-S. Liu, K. Asakura and T. Chan, J. Phys. Chem. C, 2011, 115, 10180 CAS.
- J. Qiao, Y. Liu, F. Hong and J. Zhang, Chem. Soc. Rev., 2014, 43, 631 RSC.
- K. P. Kuhl, E. R. Cave, D. N. Abram and T. F. Jaramillo, Energy Environ. Sci., 2012, 5, 7050 CAS.
- M. Gattrell, N. Gupta and A. Co, J. Electroanal. Chem., 2006, 594, 1 CrossRef CAS.
- D. Canfield and K. W. Frese Jr, J. Electrochem. Soc., 1983, 130, 1772 CrossRef CAS.
- D. P. Summers, S. Leach and K. W. Frese Jr, J. Electroanal. Chem. Interfacial Electrochem., 1986, 205, 219 CrossRef CAS.
- A. Bandi, J. Electrochem. Soc., 1990, 137, 2157 CrossRef CAS.
- J. P. Popic, M. L. Avramov-Ivic and N. B. Vukovic, J. Electroanal. Chem., 1997, 421, 105 CrossRef CAS.
- N. Spataru, K. Tokuhiro, C. Terashima, T. N. Rao and A. Fujishima, J. Appl. Electrochem., 2003, 33, 1205 CrossRef CAS.
- J. Qu, X. Zhang, Y. Wang and C. Xie, Electrochim. Acta, 2005, 50, 3576 CrossRef CAS.
- M. Le, M. Ren, Z. Zhang, P. T. Sprunger, R. L. Kurtz and J. C. Flake, J. Electrochem. Soc., 2016, 158, E45 CrossRef.
- J. Albo, A. Sáez, J. Solla-Gullón, V. Montiel and A. Irabien, Appl. Catal., B, 2013, 176–177, 709 Search PubMed.
- J. Yuan and C. Hao, Sol. Energy Mater. Sol. Cells, 2013, 108, 170 CrossRef CAS.
- J. Yuan, L. Zheng and C. Hao, RSC Adv., 2014, 4, 39435 RSC.
- Y. Zhou and J. A. Switzer, Scr. Mater., 1998, 38, 1731 CrossRef CAS.
- Y. C. Zhou and Y. A. Switzer, Mater. Res. Innovations, 1998, 2, 22 CrossRef CAS.
- S. S. Jeong, A. Mittiga and E. Salza, Electrochim. Acta, 2008, 53, 2226 CrossRef CAS.
- R. Portanova, L. H. J. Lajunen and M. Tolazzi, Pure Appl. Chem., 2003, 75, 495 CrossRef CAS.
- L. Wang, R. Zhang, T. Zhou, Z. Lou, J. Deng and T. Zhang, Sens. Actuators, B, 2017, 239, 211 CrossRef CAS.
- C. D. Lokhande and S. H. Pawar, Phys. Status Solidi A, 1989, 111, 17 CrossRef CAS.
- V. S. K. Yadav and M. K. Purkait, Energy Fuels, 2015, 29, 6670 CrossRef CAS.
- D. F. Cox and K. H. Schulz, J. Vac. Sci. Technol., A, 1990, 8, 2599 CAS.
- S. Bailey, G. F. Fronment, J. W. Snoeck and K. C. Waugh, Catal. Lett., 1995, 30, 99 CrossRef.
| This journal is © The Royal Society of Chemistry 2017 |

