 Open Access Article
Synthesis of mesoporous SiO2/Cu2O–graphene nanocomposites and their highly efficient photocatalytic performance for dye pollutants†
Dinh Cung Tien Nguyena,
Kwang Yeon Chob and
Won-Chun Oh *a
*a
aDepartment of Advanced Materials Science & Engineering, Hanseo University, Seosan, Chungnam, Korea 356-706. E-mail: wc_oh@hanseo.ac.kr; Fax: +82-41-688-3352; Tel: +82-41-660-1337
bKorea Institutes of Ceramic Engineering and Technology, Soho-ro, Jinju-Si, Gyeongsangnam-do, Republic of Korea
First published on 5th June 2017
Abstract
A mesoporous SiO2/Cu2O–graphene composite, a novel material, was successfully synthesized using a self-assembly method with tetraethyl orthosilicate (TEOS). During the reaction, Cu2O and silica nanoparticles were loaded on the graphene sheets. The mesoporous structure, morphology, pore diameter, pore volume, and surface area of the mesoporous SiO2/Cu2O–graphene composite photocatalysts were obtained via X-ray diffraction (XRD), scanning electron microscopy (SEM), energy dispersive X-ray (EDX) analysis, transmission electron microscopy (TEM), Raman spectroscopy, ultraviolet-visible diffuse reflectance spectroscopy (UV-vis DRS), X-ray photoelectron spectroscopy (XPS), FT-IR spectra, nitrogen adsorption/desorption isotherms using the BET and BJH method and photocurrent analyses. The photocatalytic degradation of rhodamine B (RhB), methylene blue trihydrate (MB), and reactive black B (RBB) in an aqueous solution under visible light irradiation was observed via UV spectrophotometry after measuring the decrease in their concentrations. The mesoporous structure of silica nanoparticles with a large surface plays a major role in the increased photodegradation as well as in the decomposition by the catalysts. Through recycling experiments, we conclude that the mesoporous SiO2/Cu2O–graphene composite had good stability during photocatalysis under visible light irradiation. The mesoporous SiO2/Cu2O–graphene nanocomposite is expected to become a candidate material for photodegradation with excellent performance.
1. Introduction
Graphene has been successfully decorated with numerous inorganic materials such as Au, ZnO, TiO2, and Cu salts through various methods, leading to nanocomposites with a photocatalytic activity that is useful in the degradation of organic dyes.1–4 Of these, graphene-based composite materials have attracted a significant amount of attention because recent studies have shown their applicability in electronics, photocatalytic systems, and photovoltaic devices.5–7 The graphene surface decorated with nanomaterials can overcome the aggregation of individual graphene sheets and of the nanomaterials themselves.8–10 With the outstanding development of science and technology, some new advances on graphene-based photocatalyst have been presented. Ting Xiong et al. demonstrated the important role of reduced graphene oxide (RGO) in UV-induced photocatalysis of RGO-based nanocomposites.11 Yuhan Li et al. proposed enhancing the photocatalytic activity of bulk g-C3N4 by introducing mesoporous structures and hybridizing with graphene.12Cu2O is a p-type semiconductor oxide that is considered to have potential for use in catalytic systems, fuel cells, and solar cells.13,14 Cu2O has the advantage of a narrow band gap energy (2.00 eV) and a suitable energy level position that make it a promising inorganic material for use in photodegradation under visible light.15–17 In addition, Cu2O is inexpensive and non-toxic, with a high chemical durability that is particularly manifested in its unsurpassed optical decomposition, and as such is a promising candidate for scientists to prepare highly applicable nanocomposites.18 For example, Chen Kunfeng et al. reported on a Cu2O nanocrystal and Cu2O–graphene composite paper for use as lithium-ion battery anode materials.19 Zhang et al. synthesized a Cu2O–graphene using the solvothermal method and also discussed the use of Cu2O–graphene in an electrochemical sensor for dopamine.20
Recently, silica nanoparticles (SiO2) have become popular materials with potential applications in numerous fields, including ceramics, catalysts, pharmaceutical products, electronic packaging, photonic and chemical–mechanical polishing due to their ordered mesostructure, large surface area, flexible pore size, and thermal stability.21–23 Due to such advantages, silica nanoparticles (SiO2) have been considered to have be photocatalyst with higher efficiency than TiO2.20,24,25 In addition, the improvement in the pore diameter, pore volume and surface area of the silica nanoparticles has attracted a significant amount of attention in various fields of science. Fengyuan Zhang20 observed that surfactants will improve the pore size and the distribution of the silica nanoparticles.26 The combination of graphene oxide and silica nanoparticles exhibits many outstanding properties when compared with bare graphene oxide and silica nanoparticles,27 and coating silica nanoparticles with many different kinds of inorganic materials has been reported to result in unique properties with many uses.28,29 With their different band gap energy levels, Cu2O and SiO2 particles can be combined to produce a composite with a highly efficient photocatalysis of dye pollutants under visible light irradiation.30–32 Nevertheless, the synthesis of mesoporous SiO2/Cu2O–graphene composites through a facile method, such as the self-assembly method, and their effective use in photocatalytic systems has not been demonstrated yet.
In this study, a mesoporous SiO2/Cu2O–graphene composite was prepared using a self-assembly method. A facile route was implemented to synthesize the mesoporous SiO2/Cu2O–graphene using tetraethyl orthosilicate (TEOS) as the silica precursor at a pH of 9.5–10. The dispersion medium consisted of a mixture of water and ethanol. Cetyltrimethylammonium bromide (CTAB) was used as the structure creator, and the silica mesoparticles formed after hydrolysis. The structure and morphology of the mesoporous SiO2/Cu2O–graphene composites were characterized via X-ray diffraction (XRD), scanning electron microscopy (SEM), energy dispersive X-ray (EDX) analysis, transmission electron microscopy (TEM), Raman spectroscopy, ultraviolet-visible diffuse reflectance spectroscopy (UV-vis-DRS), X-ray photoelectron spectroscopy (XPS). The FT-IR spectra were also recorded as evidence to confirm the structure of the survey composites. The pore diameter, pore volume and surface area of the mesoporous SiO2/Cu2O–graphene composites were determined via nitrogen adsorption/desorption isotherms using the BET and BJH method. Photodegradation experiments were then conducted with rhodamine B (RhB), methylene blue trihydrate (MB), and reactive black B (RBB) organic dyes in an aqueous solution under visible light irradiation. The recycling experiments were carried out for five repeated cycles to investigate the stability of the photocatalysts.
2. Experimental
2.1 Reagents
Graphene oxide was prepared in the laboratory from natural graphite using Hummer–Offerman's method and was used to form the composites. Copper(II) acetate (Cu(CH3COO)2·H2O, 95%), rhodamine B (RhB, C28H31ClN2O3), and methylene blue trihydrate (MB, C18H18ClN3S·3H2O) were purchased from Samchun Pure Chemicals Co. Ltd, Korea. Reactive Black B 195% (RBB) was purchased from JAY Chemical Industries Limited, India. Polyvinylpyrrolidone (PVP) K-30 was purchased from Junsei Chemical Co., Ltd, Japan. Ethanol (C2H5OH, 95%) was purchased from Duskan Pure Chemicals Co. Ltd, Korea. Tetraethyl orthosilicate (TEOS, 99%) was purchased from Aldrich Chemistry, Germany. Cetyltrimethylammonium bromide (CTAB, C19H42BrN, 99%) and ammonium hydroxide (NH4OH), and ethylene glycol (C2H6O2, 99%) were purchased from Daejung Chemicals Co. Ltd, Korea. Urea (CO(NH2)2) was purchased from Sinopharm Chemical Reagent Co., Ltd. All chemicals were used without further purification, and all experiments were carried out using distilled water.2.2 Synthesis nanocomposites
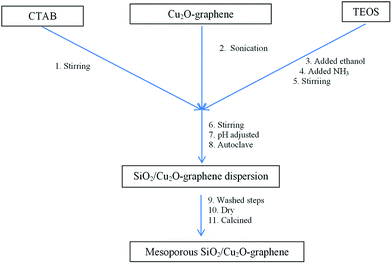
With the catalytic base (pH = 9.5–10), the hydrolysis reaction of TEOS easily forms Si(OH)4 with OH− ions that can directly penetrate toward the Si atoms and replace every part of the –OC2H5 group in the TEOS molecule. Therefore, condensing the ![[triple bond, length as m-dash]](https://www.rsc.org/images/entities/char_e002.gif) Si(OH) group of silica gel made up with structural hierarchical priorities for all sides, resulting in nanosilica material that often formed spherical sructures.23,33–38 The preparation procedure is shown in Scheme 1.
Si(OH) group of silica gel made up with structural hierarchical priorities for all sides, resulting in nanosilica material that often formed spherical sructures.23,33–38 The preparation procedure is shown in Scheme 1.
2.3 Characterization
X-ray diffraction (XRD, Shimadzu XD-D1) was used to determine the crystallinity with monochromatic high-intensity CuKα radiation (λ = 1.5406 Å). The shape and structure of the nanomaterial surface was analyzed at a high-resolution using SEM (JSM-5600 JEOL, Japan). UV-vis diffuse reflectance spectra (DRS) analysis was conducted using a UV-vis spectrophotometer (Neosys-2000) by using BaSO4 as reference at room temperature and converted from reflection to absorbance by the Kubelka–Munk method. Transmission electron microscopy (TEM) was also used to examine the size and distribution of the titanium and iron particles deposited on the fullerene surface of various samples. High Resolution Transmission Electron Microscopy (HRTEM, JEOL, JEM-2010, Japan) was used to observe the surface state and structure of the survey composites at an acceleration voltage of 200 kV. The TEM specimens were prepared by placing a few drops of sample solution on a carbon grid. The XPS analysis was performed using a VG Scientific ESCALAB250 XPS system equipped with a monochromated Al Kα X-ray source (hν = 1486.6 eV) with charge compensation. The Raman spectra of the prepared samples was observed using a spectrometer (Jasco Model Name NRS-3100) with an excitation laser wavelength of 532.06 nm. Nitrogen adsorption/desorption isotherms studies were prepared using a Micromeritics ASAP 2020M + C operating at 77 K using the Brunauer–Emmett–Teller (BET) method to determine the surface area. The survey samples were degassed at 150 °C for 4 h prior to the surface area measurements, whereas the pore size distribution was calculated according to the Barret–Joyner–Halenda (BJH) method. Photoelectrochemical measurements were performed using a self-made photoelectrochemical system installed a 250 W halogen lamp as the irradiation source. The photocurrent measurement was performed by a computer-controlled Versa-STAT-3 electrochemical analyzer. A survey composite modified photoelectrode with an active area of 1 cm2 was used as the working electrode, and a Pt wire and saturated Ag/AgCl were used as the counter and reference electrodes, respectively. All the photocurrent measurements were conducted by dipping the survey composite modified photoelectrode into a mixture of 0.1 M KCl and 0.5 M TEA at a constant potential of 0 V vs. Ag/AgCl. A UV/Vis spectrophotometer (Optizen POP, Mecasys, Korea) was used for the photodegradation experiments.2.4 Photocatalytic activity
For the typical photocatalytic test carried out at room temperature, the mesoporous SiO2/Cu2O–graphene nanocomposite used in this study was found to be 0.05 g, dissolved in 100 mL RhB solution (200 ppm). Prior to the irradiation, the above mixture solution was maintained in a dark box for 2 hours to establish the adsorption/desorption equilibrium of organic dyes. Next, the solution was irradiated with visible light radiation (λ ≥ 420 nm). The first sample was withdrawn at the end of the dark adsorption period before switching on the light to determine the RhB concentration in the solution after dark adsorption. The starting point (t = 0) of the reaction was defined as the point where the concentration of RhB solution was recorded as c0. Afterward, these samples were extracted from the solution mixtures in the reactor at regular intervals of 30, 60, 90, 120, and 180 min. The powders were dispersed using a centrifuge machine (10![[thin space (1/6-em)]](https://www.rsc.org/images/entities/char_2009.gif) 000 ppm/15 min) before the analysis. The dye concentration in the solution was measured as a function of the irradiation time. The photodegradation of the MB and RBB solution proceeded following a similar process.
000 ppm/15 min) before the analysis. The dye concentration in the solution was measured as a function of the irradiation time. The photodegradation of the MB and RBB solution proceeded following a similar process.
A UV-spectrophotometer (Opizen POP, Korea) was used to analyze the photodegradation of the dye solutions in terms of the concentration (c). A spectrophotometric analysis was performed on each sample of the dye solutions at regular time intervals to obtain the absorbance spectrum. The spectral range was investigated at λmax = 554 nm, 665 nm, 591 nm, respectively, for RhB, MB, and RBB by using a calibration curve since no reaction occurred with the absorption of products at these wavelengths. The degradation capacity (η%) was calculated as
| η(%) = (1 − c/c0) × 100 |
The photodegradation of organic dyes was also observed for RhB, MB, and RBB with (a) Cu2O–graphene, (b) Cu2O–graphene–TiO2, (c) mesoporous SiO2/Cu2O–graphene and (d) Cu2O particles, following the same procedure as that mentioned above.
Next, recycling experiments were carried out for five repeated cycles to investigate the stability of the photocatalytic performance. After each cycle, the catalyst was centrifuged, washed with ethanol, deionised water, and dried before reuse for the next experiment.
3. Results and discussion
3.1 Characterization
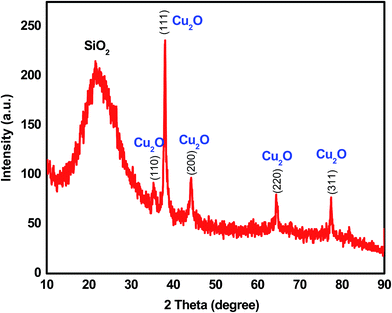
An X-ray diffraction (XRD) analysis was conducted with the composites to obtain the component crystalline phase information and assess the purity and crystalline size of the nanocomposite. The XRD results of the mesoporous SiO2/Cu2O–graphene calcined at 550 °C is shown in Fig. 1. All diffraction peaks were clear, and the purity of the mesoporous SiO2/Cu2O–graphene was expressed through the presence of two types of main diffraction peaks with Cu2O and SiO2 signals, without any unexpected peaks. Because of the dominant effect of silica, the presence of SiO2 particles is seen through the broad diffraction peak at 2θ of 22.96°.39,40 Next, according to the XRD results shown in Fig. 1, the Cu2O signal was confirmed by the clear distribution of the peaks obtained according to the Miller index planes corresponding to (110), (111), (200), (220) and (311) (JCDS 78-2076), respectively.41,42 On the other hand, no graphene peaks were recorded in the XRD patterns of the nanocomposites, indicating that the immobilization of SiO2 particles onto the surface of the graphene sheets disturbs the ordered structure of most graphene sheets.43,44 Looking over Fig. 1, the obtained composites were almost perfect with a single phase, high crystallinity, and high purity due to the absence of unexpected peaks and sharper diffraction peaks. The signal of these single peaks in mesoporous SiO2/Cu2O–graphene confirms the development of Cu2O and SiO2 on the graphene sheets.The morphology of the mesoporous SiO2/Cu2O–graphene sample was also assessed during the initial evaluation via SEM, and the results are presented in Fig. S1 (ESI†). The SEM images also indicate that both fine Cu2O and SiO2 nanoparticles uniformly covered the graphene surface. The morphological features of the SiO2 particles included a small size with spherical shapes and good particle dispersion. This indicates an increased photocatalytic activity with the mesoporous SiO2/Cu2O–graphene nanocomposite. With this morphogenesis and sustainable link, the ability to switch the charge between Cu2O and SiO2 as well as switch the charge among Cu2O, SiO2, and graphene increased. Subsequently, an increased photocatalytic activity with the mesoporous SiO2/Cu2O–graphene nanocomposite can be observed.
TEM images were taken for the mesoporous SiO2/Cu2O–graphene nanocomposites to further investigate the structure and provide clear images of the dispersion and morphology, as shown in Fig. 2. Fig. 2(a) shows the existence of quantum dots with an irregular shape, which indicates that the Cu2O nanoparticles covered the surface of the graphene sheets. In Fig. 2(b), smaller Cu2O nanoparticles with a size around 5–10 ppm can be seen to be uniformly distributed throughout the surface of the small TiO2 rods with an average size of about 150–200 nm, as well as on the graphene surface. The typical morphologies of the mesoporous SiO2/Cu2O–graphene nanomaterials were confirmed in Fig. 2(c and d). It was clear that the spherical silica nanoparticles with a pore diameter smaller than 2 μm were successfully hanged on the graphene surface. In this case, the graphene nanosheets play a major role in a facile template for the TEOS hydrolysis.37 The results of HR-TEM in Fig. 2(e and f) show the detailed structure of the mesoporous SiO2/Cu2O–graphene nanomaterials. Besides the amorphous in nature of the silica particles were clearly seen, the single-crystallinity of Cu2O nanoparticles were found to exist on the spherical shapes surface of the mesoporous SiO2 with the pure black microsphere-like shape which implied that the particles is solid and not core–shell or inner hollow structure.45 The formation of the mesoporous SiO2 and Cu2O nanoparticles on the graphene surface was also observed in Fig. 2(f). As a result, the moving charge from SiO2 to Cu2O will easily occur and help limit the recombination of the photogenerated electron–holes, releasing the necessary energy for the photodegradation reaction. The mesoporous silica nanoparticles were also promised to provide a more exposed surface for the photocatalytic activity. The above results indicate that the mesoporous SiO2/Cu2O–graphene nanomaterial will become a potential candidate due to its photocatalytic activity. The TEM results matched the results from SEM, confirming that the experimental conditions and processes were adequate.
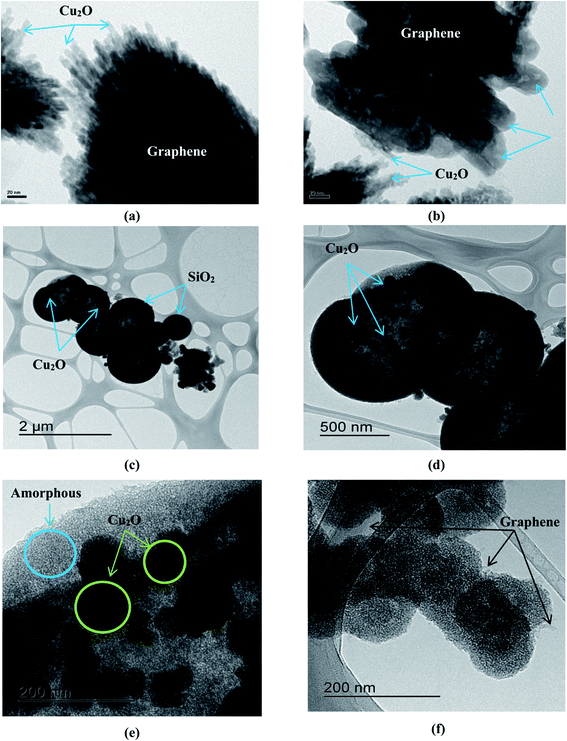 | ||
| Fig. 2 TEM image of the Cu2O–graphene (a), Cu2O–graphene–TiO2 (b) and mesoporous SiO2/Cu2O–graphene (c and d) composites and HR-TEM image of mesoporous SiO2/Cu2O–graphene (e and f). | ||
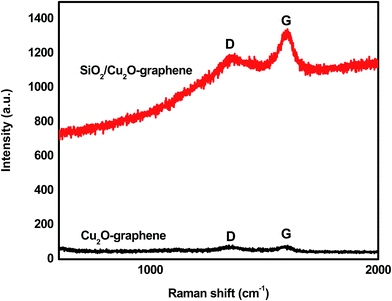
The Raman spectra were measured to consolidate the structural information of the mesoporous SiO2/Cu2O–graphene nanocomposite. The Raman spectra of Cu2O–graphene and mesoporous SiO2/Cu2O–graphene nanocomposites were presented in Fig. 3. The existence of the D and G bands in the Raman results is evidence of the presence of carbon in the survey nanomaterials. The D and G bands of the Cu2O–graphene composite appeared at 1340 cm−1 and 1590 cm−1, respectively, while the D band at 1350 cm−1 and G band at 1600 cm−1 of the mesoporous SiO2/Cu2O–graphene nanocomposite was confirmed, as shown in Fig. 3. The D band shifted from 1340 to 1350 cm−1, indicating changes in the chemical bond between Cu2O–graphene and mesoporous SiO2/Cu2O–graphene nanocomposite. In the graphene oxide-based samples, the D band is an ordinary feature of sp3 defects, and the G band provides information on the in-plane vibration of the sp2 bonded carbons.46 The intensity ratio (ID/IG) reflects the order of defects in the graphene oxide or graphene. It strongly depends on the extent of the disorder in the graphitic material.47 Following Fig. 3, the calculated ID/IG ratio of the Cu2O–graphene composite was found to be 0.960, while the ID/IG ratio of mesoporous SiO2/Cu2O–graphene was 0.897. The decrease in the ID/IG ratio indicates an increase in the number of graphene layers or a partial reduction in the graphene oxide into graphene, which is consistent with the reports.48 In other words, the decrease in ID/IG proved that sp2 carbon domains were repaired, but a certain amount of sp3 or twisted carbon atoms as defects still existed.49 Furthermore, the lower ID/IG ratio shows a better defect repair mechanism.50
The typical FT-IR spectrum of the survey materials was taken as shown in Fig. 4(a). Considering the FT-IR spectrum of the Cu2O–graphene nanocomposites, it shows three main peaks that can be attributed to oxygen-containing groups. The peaks centered at 1110, 1400, and 1560 cm−1 assisted the C–O vibrations from the alkoxy groups, C–OH stretching vibrations, and C![[double bond, length as m-dash]](https://www.rsc.org/images/entities/char_e001.gif) O stretching peak of the conjugated ketone, respectively.51,52 After a self-assembly reaction with TEOS at pH 9.5–10, the FI-IR spectrum of mesoporous SiO2/Cu2O–graphene nanocomposite displayed new bands, confirming that the silica nanoparticles covered the graphene surface. The bands at 805 and 1080 cm−1 were attributed to Si–O–Si symmetric stretching, and the stretching vibration of the Si–O–Si band, respectively.53 In contrast with the disappearance of the C
O stretching peak of the conjugated ketone, respectively.51,52 After a self-assembly reaction with TEOS at pH 9.5–10, the FI-IR spectrum of mesoporous SiO2/Cu2O–graphene nanocomposite displayed new bands, confirming that the silica nanoparticles covered the graphene surface. The bands at 805 and 1080 cm−1 were attributed to Si–O–Si symmetric stretching, and the stretching vibration of the Si–O–Si band, respectively.53 In contrast with the disappearance of the C![[double bond, length as m-dash]](https://www.rsc.org/images/entities/char_e001.gif) O groups, the above evidence suggests that the typical carboxyl group was altered into Si–O–C bonds.37 When compared to the FT-IR spectrum of the Cu2O–graphene nanocomposite between 1300 and 1600 cm−1, it was easy to see the absence of the characteristic peaks for oxygen-containing groups, which indicated that the oxygen-containing groups were unfixed.39 In other words, all FT-IR spectrum results concluded that mesoporous SiO2 were produced on the surface of the graphene sheets. As the XPS results show in Fig. 4(b and c), the surface bonding state of the survey nanomaterial was identified as containing Si included Si 2p, and Si 2s at 106 eV, and 155 eV, respectively. The C 1s spectra of the composites were presented in the region from 282.5–294.7 eV, indicating the presence of non-oxygenated C (C
O groups, the above evidence suggests that the typical carboxyl group was altered into Si–O–C bonds.37 When compared to the FT-IR spectrum of the Cu2O–graphene nanocomposite between 1300 and 1600 cm−1, it was easy to see the absence of the characteristic peaks for oxygen-containing groups, which indicated that the oxygen-containing groups were unfixed.39 In other words, all FT-IR spectrum results concluded that mesoporous SiO2 were produced on the surface of the graphene sheets. As the XPS results show in Fig. 4(b and c), the surface bonding state of the survey nanomaterial was identified as containing Si included Si 2p, and Si 2s at 106 eV, and 155 eV, respectively. The C 1s spectra of the composites were presented in the region from 282.5–294.7 eV, indicating the presence of non-oxygenated C (C![[double bond, length as m-dash]](https://www.rsc.org/images/entities/char_e001.gif) C/C–C) in aromatic rings (284.5 eV), as well as the C in C–O–C (286.3 eV), where the epoxy or hydroxyl group (C–O) is at 286.7 eV and C
C/C–C) in aromatic rings (284.5 eV), as well as the C in C–O–C (286.3 eV), where the epoxy or hydroxyl group (C–O) is at 286.7 eV and C![[double bond, length as m-dash]](https://www.rsc.org/images/entities/char_e001.gif) O or the carboxyl is at 288.1 eV.54,55 The presence of the O 1s signal of the nanocomposites is due to absorbed oxygen.
O or the carboxyl is at 288.1 eV.54,55 The presence of the O 1s signal of the nanocomposites is due to absorbed oxygen.
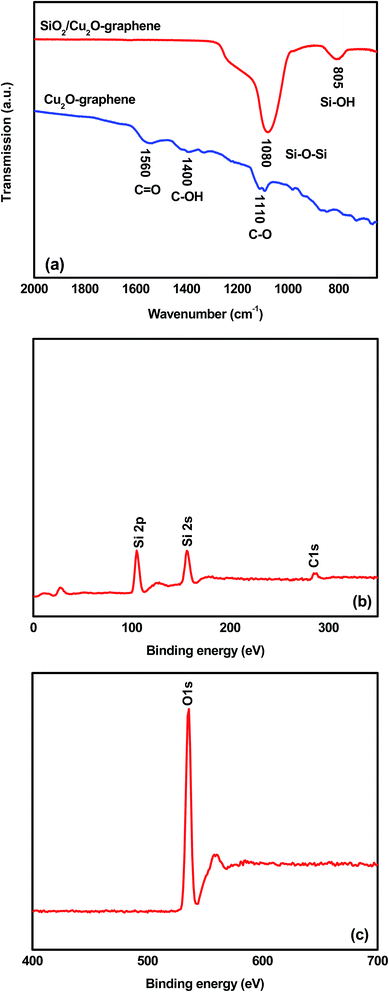 | ||
| Fig. 4 FT-IR spectra of the Cu2O–graphene and mesoporous SiO2/Cu2O–graphene composites and XPS results of the mesoporous SiO2/Cu2O–graphene composites. | ||
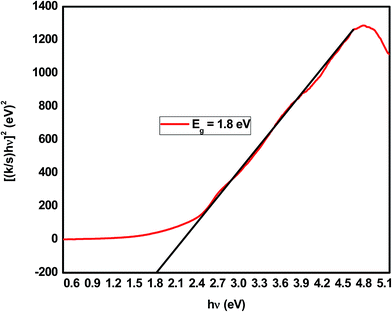
The results of the Kubelka–Munk transformation from the UV-vis diffuse reflectance spectra of the mesoporous SiO2/Cu2O–graphene composite are displayed in Fig. 5. The band gap energy value was achieved at the point at which the straight line approaching the curve intersects the horizontal axis. The band gap energy values of the mesoporous SiO2/Cu2O–graphene composite correspond to 1.80 eV, which is lower than that of the Cu2O–graphene composite.56 This phenomenon promises an increase in the catalytic activity of the mesoporous SiO2/Cu2O–graphene composite.
The surface properties and the results of the porosity analysis of the composites are exhibited in Fig. 6, and the corresponding textural parameters are displayed in Table 1. The nitrogen adsorption/desorption isotherm results of the Cu2O–graphene, Cu2O–graphene–TiO2 composites clearly exhibit a similar type II curve. The pore size calculated using the BJH method was about 24.15 and 11.29 nm. The BET surface area of the Cu2O–graphene and Cu2O–graphene–TiO2 composites was 10.74 and 41.55 m2 g−1, respectively. According to the hysteresis loop in the relative pressure region around 0.45–0.98, the nitrogen adsorption/desorption isotherms showed that the SiO2/Cu2O–graphene nanocomposite exhibited a similar type IV curve. In other words, the SiO2/Cu2O–graphene nanocomposite existed with a mesoporous structure. After the self-assembly method with TEOS, the surface area of the SiO2/Cu2O–graphene inhibited a big difference in the Cu2O–graphene, Cu2O–graphene–TiO2 composites. Due to the mesoporous structure, the SiO2/Cu2O–graphene showed a nanopore size of 4.19 nm and a very large surface area with BET results at about 287.49 m2 g−1. Besides, the total pore volume of SiO2/Cu2O–graphene was 66.05 cm3 g−1, which is 33 times more than the total pore volume of Cu2O–graphene (2.47 cm3 g−1). With an increase in the surface area and decrease in the pore size, as well as the large total pore volume, the SiO2/Cu2O–graphene is expected to have a high photocatalytic activity.
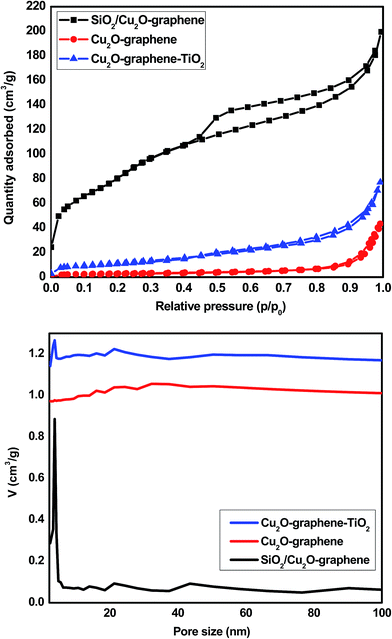 | ||
| Fig. 6 The nitrogen adsorption/desorption isotherms (above) and pore size distributions (below) for the Cu2O–graphene, Cu2O–graphene–TiO2 and mesoporous SiO2/Cu2O–graphene composites. | ||
| Sample name | BET (m2 g−1) | Total pore volume (cm3 (STP) g−1) | Average pore size (nm) |
|---|---|---|---|
| Cu2O–graphene | 10.74 | 2.47 | 24.15 |
| Cu2O–graphene–TiO2 | 41.55 | 9.55 | 11.29 |
| SiO2/Cu2O–graphene | 287.49 | 66.05 | 4.19 |
Fig. 7 displays the photocurrent response of the ITO/as-prepared nanocomposites based on time under visible light irradiation, which was carried out for five times at 20 s intervals. It was obviously observed that no current was observed in the dark, which provides the evidence of no photoinduced charge separation occurs. The as-synthesized Cu2O–graphene presented the high photocurrent response (∼98.0 μA cm−2) during repeating on–off illumination cycles, while the low photocurrent density was ∼20.0 μA cm−2 for SiO2–graphene nanocomposite. Besides, the mesoporous SiO2 and Cu2O–graphene combination with a mass ratio at 100![[thin space (1/6-em)]](https://www.rsc.org/images/entities/char_2009.gif) :
:![[thin space (1/6-em)]](https://www.rsc.org/images/entities/char_2009.gif) 5 reached two times enhanced photocurrent density (∼40.0 μA cm−2) compared to SiO2–graphene nanocomposite. The improved photocurrent of the mesoporous SiO2/Cu2O–graphene implied an enhanced the photoinduced electron–hole separation at the p–n junction of the SiO2/Cu2O hybrid, while the holes were scavenged by the TEA, and graphene plays a role as a charge transfer medium.57,58 As the results, the electrons were transported to the ITO electrode, resulting in photocurrent generation. Because of the reduced interaction between as-prepared survey nanocomposites and ITO under visible light irradiation, the photocurrent density decreased over time.59 On the other hand, the porous network structure also contributes to the enhanced transition of photogenerated carriers.60
5 reached two times enhanced photocurrent density (∼40.0 μA cm−2) compared to SiO2–graphene nanocomposite. The improved photocurrent of the mesoporous SiO2/Cu2O–graphene implied an enhanced the photoinduced electron–hole separation at the p–n junction of the SiO2/Cu2O hybrid, while the holes were scavenged by the TEA, and graphene plays a role as a charge transfer medium.57,58 As the results, the electrons were transported to the ITO electrode, resulting in photocurrent generation. Because of the reduced interaction between as-prepared survey nanocomposites and ITO under visible light irradiation, the photocurrent density decreased over time.59 On the other hand, the porous network structure also contributes to the enhanced transition of photogenerated carriers.60
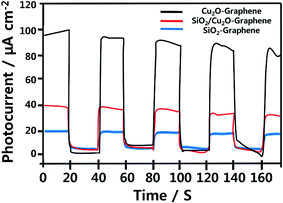 | ||
| Fig. 7 Photocurrent measurement with Cu2O–graphene, mesoporous SiO2/Cu2O–graphene and SiO2–graphene modified photoelectrodes. | ||
3.2 Photodegradation
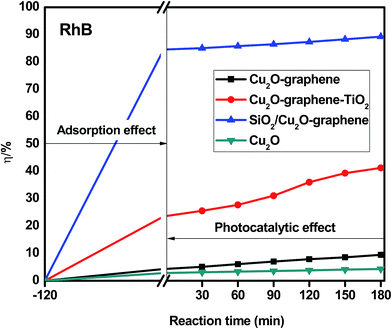
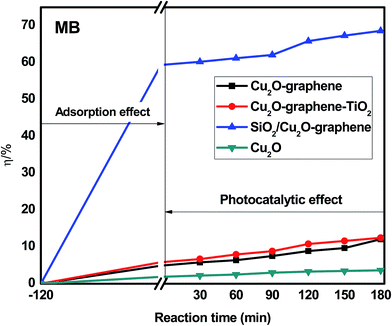
The organic dye degradation progressed in two stages. First, the adsorption/desorption equilibrium of organic dyes was established in a dark box for 2 hours. Then, the photocatalytic degradation experiment of the dye solutions was conducted under visible light irradiation with different irradiation times (from 0 to 180 min). The effects of the different organic dyes are given below.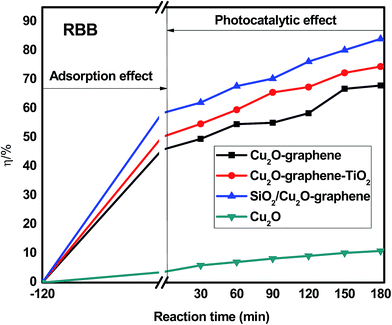 | ||
| Fig. 10 Degradation efficiency of different composites with RBB under visible light. The concentration of RBB was 200 ppm. The amount of composites were 0.05 g. | ||
Photocatalytic reactions with different photocatalysts can be expressed using the Langmuir–Hinshelwood model.61 The photocatalytic degradation of organic dyes containing different photocatalysts obeys pseudo-first-order kinetics with respect to the concentration of the organic dyes.
| −dc/dt = kappc | (I) |
The integration of (I) (with the restriction of c = c0 at t = 0, with c0 as the initial concentration in the bulk solution after dark adsorption and t the reaction time) will lead to the following expected relation:
| −ln(c/c0) = kappt | (II) |
To investigate the stability of the photocatalytic performance, the mesoporous SiO2/Cu2O–graphene was used to degrade the RhB dye in five repeated cycles, and the results are shown in Fig. S3 (ESI†). As shown in Fig. S3(a),† the photocatalytic activity of the mesoporous SiO2/Cu2O–graphene still exhibited good results after five recycling runs. This confirmed that the mesoporous SiO2/Cu2O–graphene had a high stability under visible light irradiation. In spite of the lower diffraction peak intensity, we can see three types of main diffraction peaks indexed to Cu2O, and SiO2 signals still remain in the XRD patterns in Fig. S3(b).† The TEM image from Fig. S3(c)† also presented the original structure of the mesoporous SiO2/Cu2O–graphene nanocomposite after five cycling photocatalysis process. Therefore, we can conclude that the mesoporous SiO2/Cu2O–graphene composite has the good stability during photocatalysis.
Besides the narrowing of the band gap energy, the excellent photocatalytic activity of the mesoporous SiO2/Cu2O–graphene is explained to be a result of the pore diameter, pore volume and surface area. Graphene oxide and silica nanoparticles provided a large surface for photodegradation, and in the photodegradation experiments, we can see that the adsorption capacities of the mesoporous SiO2/Cu2O–graphene are higher than those for Cu2O, Cu2O–graphene and Cu2O–graphene–TiO2 mainly due to the large surface area of the mesoporous silica particles.62 In our case, the BET of mesoporous SiO2/Cu2O–graphene was more than 7–28 times that for the BET results of the Cu2O–graphene and Cu2O–graphene–TiO2 composites. With these outstanding properties, the adsorption effects of mesoporous SiO2/Cu2O–graphene produced the best adsorption effects for the RhB, MB, and RBB solution.
Graphene oxide also plays the role of an electron acceptor, photosensitizer, and the adsorbent to efficiently enhance the photodegradation of organic dyes.63,64 The presence of the high density of oxygen-containing functional groups, such as hydroxyl groups, epoxy, and carboxyl at the edge or on the large surface area of graphene oxide provides the more space for ionic/electro interaction between dye molecules and the aromatic rings of graphene oxide sheets, and from that, the better adsorptivity can be achieved.65,66 Besides, we can not ignore the role of an electron acceptor of graphene oxide which participates in facilitating electron transfer process from SiO2 and Cu2O to join the reduction reaction as well as enhancing charge separation and therefore, enhancing the photodegradation.67,68
On the other hand, the mesoporous structure of the silica nanoparticles plays a major role in the increased photodegradation effect as well as the surface of graphene sheets. In this case, the mesoporous structure allows a greater amount of guest species over the catalysts, and the reaction will not be limited to the photocatalytic surface. For the large surface area, the active site population and accessibility to the active sites increase, and the photocatalytic activity will thus increase.69
The photocatalytic activity of the mesoporous SiO2/Cu2O–graphene composite reflects two factors that influence the degradation rate: the adsorption capacity due to the mesoporous structure and the decomposition effect through catalysis. The valence band of the SiO2 is higher than that of Cu2O. Therefore, the photogenerated electrons of SiO2 can switch to the valence band of Cu2O and then shift to the graphene surface to join the reduction reaction (e−CB). The photogenerated holes of Cu2O can also switch the graphene surface to participate in oxidation reactions (h+VB). With this mechanism, the reduced electron–hole recombination leads to an increase in the catalytic ability. The photogenerated electron–hole shifts to the surface and interacts with substances, such as the hydroxyl group and oxygen, where the adsorption creates free radicals on the surface of the semiconductor.70,71
4. Conclusions
The results of the experiments above indicate that we successfully synthesized mesoporous SiO2/Cu2O–graphene composites by combining TEOS and Cu2O–graphene with CTBA at pH 9.5–10 and calcined at 550 °C. The XRD investigation of the photocatalyst showed the presence of silica nanoparticles due to broad diffraction peaks as well as a cubic Cu2O phase. SEM and TEM images suggested that both Cu2O and SiO2 nanostructures were successfully loaded onto the transparent graphene sheets. Furthermore, the spherical silica nanoparticles with pore diameter as well as the quantum dot-sized Cu2O are promising materials that can enhance the photocatalytic activity of mesoporous SiO2/Cu2O–graphene composites. The Raman and DRS spectrum also confirm the structures of the mesoporous SiO2/Cu2O–graphene composite, and the FT-IR spectrum shows the structural differences between the Cu2O–graphene and mesoporous SiO2/Cu2O–graphene composite through the appearance of a new characteristic band and the removal of oxygen-containing groups. The nitrogen adsorption/desorption isotherm provided information regarding the pore diameter, pore volume, and surface area. The photocurrent analyses also provided the evidence of the enhanced photocatalytic activity of the mesoporous SiO2/Cu2O–graphene composite.The mesoporous structure of the silica nanoparticles plays a major role in increasing the photodegradation effect as well as the surface of the graphene sheets. The results of this study thus show that the material is capable of the photocatalytic degradation of different organic dyes under visible light irradiation. The results of the photodegradation suggest that the mesoporous SiO2/Cu2O–graphene composite is much more effective photocatalyst than both Cu2O–graphene, Cu2O–graphene–TiO2 composites and Cu2O when under the same experimental conditions.
References
- Y. He, N. Zhang, L. Zhang, Q. Gong, M. Yi, W. Wang, H. Qiu and J. Gao, Mater. Res. Bull., 2014, 51, 397–401 CrossRef CAS.
- F. Xu, Y. Yuan, D. Wu, M. Zhao, Z. Gao and K. Jiang, Mater. Res. Bull., 2013, 48, 2066 CrossRef CAS.
- Q. Zhou, Y. Zhong, X. Chen, X. J. Huang and Y. C. Wu, Mater. Res. Bull., 2014, 51, 244 CrossRef CAS.
- A. Safavi, F. A. Mahyari and M. Tohidi, Mater. Res. Bull., 2013, 48, 3399 CrossRef CAS.
- L. Zhu, Z. D. Meng, M. L. Chen, F. J. Zhang, J. G. Choi, J. Y. Park and W. C. Oh, J. Photocatal. Sci., 2010, 1, 69 Search PubMed.
- H. Zhang, X. Lv, Y. Li, Y. Wang and J. Li, ACS Nano, 2010, 4, 380–386 CrossRef CAS PubMed.
- S. R. Kim, M. K. Parvez and M. Chhowalla, Chem. Phys. Lett., 2009, 483, 124–127 CrossRef CAS.
- D. C. T. Nguyen, K.-Y. Cho and W.-C. Oh, Appl. Surf. Sci., 2017, 412, 252–261 CrossRef CAS.
- G. Williams, B. Seger and P. V. Kamat, ACS Nano, 2008, 2(7), 1487–1491 CrossRef CAS PubMed.
- J. Li, K. Yu, K. Qian, H. Cao, X. Lu and J. Sun, Nanoscale Res. Lett., 2014, 9, 172–180 CrossRef PubMed.
- T. Xiong, F. Dong, Y. Zhou, M. Fu and W.-K. Ho, J. Colloid Interface Sci., 2015, 447, 16–24 CrossRef CAS PubMed.
- Y. Li, Y. Sun, F. Dong and W.-K. Ho, J. Colloid Interface Sci., 2014, 436, 29–36 CrossRef CAS PubMed.
- P. E. de Jongh, D. Vanmaekkelbergh and J. J. Kelly, Chem. Commun., 1999, 1069–1070 RSC.
- B. Rai, Sol. Cells, 1988, 25, 265–271 CrossRef CAS.
- M. Hara, T. Kondo, M. Komoda, S. Ikeda, K. Shinohara, A. Tanaka, J. N. Kondo and K. Domen, Chem. Commun., 1998, 3, 357–358 RSC.
- K. Domen, J. N. Kondo, M. Hara and T. Takata, Bull. Chem. Soc. Jpn., 2000, 73, 1307–1331 CrossRef CAS.
- L. Huang, F. Peng, H. Yu and H. J. Wang, Solid State Sci., 2009, 11, 129–138 CrossRef CAS.
- Z. Gao, J. Liu, F. Xu, D. Wu, Z. Wu and K. Jiang, Solid State Sci., 2012, 14, 276–280 CrossRef CAS.
- C. Kunfeng, L. Jun and X. Dongfeng, Energy and Environment Focus, 2012, 1, 50–67 CrossRef.
- F. Zhang, Y. Li, Y.-e. Gu, Z. Wang and C. Wang, Microchim. Acta, 2011, 173, 103–109 CrossRef CAS.
- Y. C. Hsu, Y. T. Hsu, H. Y. Hsu and C. M. Yang, Chem. Mater., 2007, 19, 1120–1126 CrossRef CAS.
- M. Tiemann, Chem. Mater., 2008, 20, 961–971 CrossRef CAS.
- N. Venkatathri, Bull. Mater. Sci., 2007, 30, 615–617 CrossRef CAS.
- Y. J. Acosta-Silva, R. Nava, V. Hernández-Morales, S. A. Macías-Sánchez, M. L. Gómez-Herrera and B. Pawelec, Appl. Catal., B, 2011, 110, 108–117 CrossRef CAS.
- T. Kamegawa, D. Yamahana and H. Yamashita, J. Phys. Chem. C, 2010, 114, 15049–15053 CAS.
- H. T. Phuong, D. T. Ngo, N. D. Toan, T. T. Son, N. T. Ngoc Bich, N. H. Anh, N. L. Anh and P. H. Trang, Petrovietnam, 2016, 9, 24–33 Search PubMed.
- H. Song, L. Zhang, C. He, Y. Qu, Y. Tian and Y. Lv, J. Mater. Chem., 2011, 21, 5972–5977 RSC.
- Z. Y. Wang, Q. F. Lu, M. G. Kong and L. D. Zhang, Chem.–Eur. J., 2007, 13, 1463–1670 CrossRef CAS PubMed.
- Y. Li, X. L. Zhang, R. Qiu, R. Qiao and Y. S. Kang, J. Phys. Chem. C, 2007, 111, 10747–10750 CAS.
- P. Poizot, S. Laruelle, S. Grugeon, L. Dupont and J. M. Tarascon, Nature, 2000, 407, 496–499 CrossRef CAS PubMed.
- Y. Mao, T. Park, F. Zhang and H. Zhou, Small, 2007, 7, 1122–1139 CrossRef PubMed.
- Z. Wang, Y. Du, F. Zhang, Z. Zheng, X. Zhang, Q. Feng and C. Wang, Mater. Chem. Phys., 2013, 140, 373–381 CrossRef CAS.
- S. Giri, Synthesis and characterization of zirconia coated silica nanoparticles for catalytic reactions, National Institute of Technology, Rourkela, India, 2008 Search PubMed.
- J. Knipping, H. Wiggers, B. Rellinghaus, P. Roth, D. Konjhodzic and C. Meier, J. Nanosci. Nanotechnol., 2004, 4(8), 1039–1044 CrossRef CAS PubMed.
- L. Hao, X. Gong, S. Xuan, H. Zhang, X. Gong, W. Jiang and Z. Chen, Appl. Surf. Sci., 2006, 252(24), 8724–8733 CrossRef CAS.
- T. Sugama and B. Lipford, J. Mater. Sci., 1997, 32(13), 3523–3534 CrossRef CAS.
- Q. Sun, P. J. Kooyman, J. G. Grossmann, P. H. H. Bomans, P. M. Frederik, P. C. M. M. Magusin, T. P. M. Beelen, R. A. Van Santen and N. A. J. M. Sommerdijk, Adv. Mater., 2006, 15(13), 1097–1100 CrossRef.
- S. H. Zhang, I. Laurer and K. K. Unger, Adv. Mater., 1997, 9, 254 CrossRef.
- X. M. Guo, X. G. Liu, B. S. Xu and T. Dou, Colloids Surf., A, 2009, 345, 141–146 CrossRef CAS.
- W. L. Zhang and H. J. Choi, Langmuir, 2012, 28(17), 7055–7062 CrossRef CAS PubMed.
- Joint Committee on Powder Diffraction Standards, Diffraction Data File, No. 5–666, ICDD International Center for Diffraction Data (formerly JCPDS), Pennsylvania, USA, 1991.
- F. Zhang, Y. Li, Y.-e Gu, Z. Wang and C. Wang, Microchim. Acta, 2011, 173, 103–109 CrossRef CAS.
- Q. Liu, J. B. Shi, T. Wang, L. X. Zeng and G. B. Jiang, Angew. Chem., Int. Ed., 2011, 50, 5913–5917 CrossRef CAS PubMed.
- X. Zhou and T. Shi, Appl. Surf. Sci., 2012, 259, 566–573 CrossRef CAS.
- L. Chen, Y. Zhang, P. Zhu, F. Zhou, W. Zeng, D. D. Lu, R. Sun and C. Wong, Sci. Rep., 2015, 5, 9672 CrossRef PubMed.
- J. Zhang, Z. Xiong and X. S. Zhao, J. Mater. Chem., 2011, 21, 3634–3640 RSC.
- J. Shen, B. Yan, M. Shi, H. Ma, N. Li and M. Ye, J. Mater. Chem., 2011, 21, 3415–3421 RSC.
- K. Kudin, B. Ozbas, H. Schniepp, R. Prud'homme, I. Aksay and R. Car, Nano Lett., 2008, 8, 36 CrossRef CAS PubMed.
- X. Zhou and T. Shi, Appl. Surf. Sci., 2012, 259, 566–573 CrossRef CAS.
- K. Ullah, S. Ye, S. B. Jo, L. Zhu, K. Y. Cho and W. C. Oh, Ultrason. Sonochem., 2014, 21(5), 1849–1857 CrossRef CAS PubMed.
- S. J. Park, J. H. An, R. D. Piner, I. Jung, D. X. Yang, A. Velamakanni, S. B. T. Nguyen and R. S. Ruoff, Chem. Mater., 2008, 20, 6592–6594 CrossRef CAS.
- A. V. Murugan, T. Muraliganth and A. Manthiram, Chem. Mater., 2009, 21, 5004–5006 CrossRef CAS.
- W. G. Leng, M. Chen, S. X. Zhou and L. M. Wu, Langmuir, 2010, 26, 14271–14275 CrossRef CAS PubMed.
- Y. Qi, J. R. Eskelsen, U. Mazur and K. W. Hipps, Langmuir, 2012, 28, 3489–3493 CrossRef CAS PubMed.
- Y.-W. Hsu, T.-K. Hsu, C.-L. Sun, Y.-T. Nien, N.-W. Pu and M.-D. Ger, Electrochim. Acta, 2012, 82, 152–157 CrossRef CAS.
- A. A. Dubale, W.-N. Su, A. G. Tamirat, C.-J. Pan, B. A. Aragaw, H.-M. Chen, C.-H. Chen and B.-J. Hwang, J. Mater. Chem. A., 2014, 2, 18383–18397 CAS.
- Y. Wu, D. Chu, P. Yang, Y. Du and C. Lu, Catal. Sci. Technol., 2015, 5, 3375–3382 CAS.
- A. Ali and W. C. Oh, Sci. Rep., 2017, 7(1), 1867 CrossRef PubMed.
- Q. Hao, X. Niu, C. Nie, S. Hao, J. Ge, W. Zou, D. chen and W. Yao, Phys. Chem. Chem. Phys., 2016, 18, 31410–31418 RSC.
- M. Zhang, W. Luo, Z. Wei, W. Jiang, D. Liu and Y. Zhu, Appl. Catal., B, 2016, 194, 105–110 CrossRef CAS.
- Y. Li, X. Li and J. Li, Water Res., 2006, 40, 1119 CrossRef CAS PubMed.
- T. Jiang, A. S. Poyraz, A. Iyer, Y. Zhang, Z. Luo, W. Zhong, R. Miao, A. M. El-Sawy, C. J. Guild, Y. Sun, D. A. Kriz and S. L. Suib, J. Phys. Chem. C, 2015, 119(19), 10454–10468 CAS.
- F. Dong, Z. Y. Wang, Y. J. Sun, W. K. Ho and H. D. Zhang, J. Colloid Interface Sci., 2013, 401, 70–79 CrossRef CAS PubMed.
- T.-D. Nguyen-Phan, V. H. Pham, E. W. Shin, H.-D. Pham, S. Kim, J. S. Chung, E. J. Kim and S. H. Hur, Chem. Eng. J., 2011, 170, 226–232 CrossRef CAS.
- G. Williams, B. Seger and P. V. Kamat, ACS Nano, 2008, 2, 1487–1491 CrossRef CAS PubMed.
- I. V. Lightcap, T. H. Kosel and P. V. Kamat, Nano Lett., 2010, 10, 577–583 CrossRef CAS PubMed.
- S. Min and G. Lu, J. Phys. Chem. C, 2012, 116(48), 25415–25424 CAS.
- Y. J. Sun, W. D. Zhang, T. Xiong, Z. W. Zhao, F. Dong, R. Q. Wang and W. K. Ho, J. Colloid Interface Sci., 2014, 418, 317–323 CrossRef CAS PubMed.
- K. Li, T. Chen, L. Yan, Y. Dai, Z. Huang, J. Xiong, D. Song, Y. Lv and Z. Zeng, Colloids Surf., A, 2013, 422, 90–99 CrossRef CAS.
- R. Raghav, P. Aggarwal and S. Srivastava, AIP Conf. Proc., 2016, 1724, 020078 CrossRef.
- J. P. Espinós, J. Morales, A. Barranco, A. Caballero, J. P. Holgado and A. R. González-Elipe, J. Phys. Chem. B, 2002, 106, 6921–6929 CrossRef.
Footnote |
| † Electronic supplementary information (ESI) available. See DOI: 10.1039/c7ra03526h |
| This journal is © The Royal Society of Chemistry 2017 |

