3.2.2 Luminescence properties.
3.2.2.1 NaCaPO4:xEu2+ with 0.03NaCl. Fig. 8a–f show the emission spectra of NaCaPO4:xEu2+ with 0.03NaCl (x = 0.001, 0.01, 0.03, 0.05, 0.07, and 0.10) excited at 365 nm, respectively. We fitted the emission spectra with a Gaussian function for NaCaPO4:xEu2+ with 0.03NaCl. The orange dashed lines denote two Gaussian functions, which successfully fitted with the maxima at 510 (Eu2) and 542 (Eu1) nm. Moreover, two different emission bands were obtained due to the different crystal surroundings of Eu2+ sites. From the XRD patterns and structural analysis, it can be inferred that Eu2+ ions occupied Ca2+ sites in NaCaPO4. Hence, three distinct crystallographic sites were formed (i.e., Ca(1), Ca(2), and Ca(3), in which both the crystallographic sites of Ca(2) and Ca(3) were eight-coordinated).
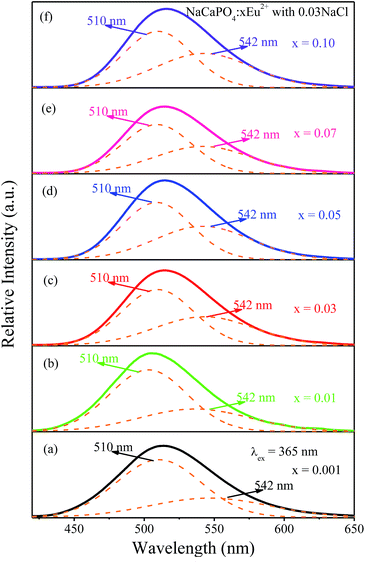 |
| | Fig. 8 Emission spectra of NaCaPO4:xEu2+ with 0.03NaCl (x = 0.001, 0.01, 0.03, 0.05, 0.07, and 0.10) and the corresponding fitted curves. | |
Therefore, the emission spectra were fitted by two Gaussian curves, and due to this, the luminescence of the luminescence centers with similar coordinate environments was indistinguishable, according to crystal field theory.29 In addition, to investigate the relationship between the coordinate environment and emission peaks, the emission position of Eu2+ can be simply estimated using the Van Uitert eqn (1):30,31
| |
 | (1) |
where
E is the energy location of the lower d-band edge for Eu
2+ (cm
−1),
Q is the energy location for the lower d-band edge of the free ion (
Q = 34
![[thin space (1/6-em)]](https://www.rsc.org/images/entities/char_2009.gif)
000 cm
−1 for Eu
2+),
V is the valence of the active cation (
V = 2 for Eu
2+),
n is the coordination number, and
r is the radius of the host cation (Ca
2+) replaced by the activator Eu
2+ ion (Å). The value of
Ea was difficult to obtain due to the complexity of the host, but it was constant in the same host.
E is proportional to the
n and
r of the sample; hence, Eu
2+ ions with a higher coordination number generally emit at a higher energy, corresponding to a lower wavelength. As a result, 510 (Eu2) and 542 nm (Eu1) emission bands correspond to Ca(2) (Ca(3)) and Ca(1), respectively.
Fig. 9a shows the emission intensities of 510 (Eu2) and 542 nm (Eu1) as a function of Eu2+ contents; it can be observed that their emission intensities gradually increased before reaching the maximum at x = 0.01 for 510 nm emission and x = 0.05 for 542 nm emission, respectively. The emission intensities began to decrease with the increasing concentrations of Eu2+ due to the concentration quenching effect, resulting from the non-radiative energy migration among the activator Eu2+ ions.
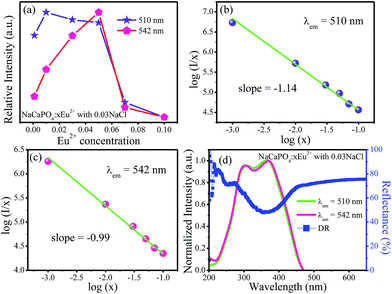 |
| | Fig. 9 (a) Variation of emission intensity for NaCaPO4:xEu2+ with 0.03NaCl as a function of doped Eu2+ concentration. (b) and (c) The relationship of log(I/x) versus log(x). (d) DR, excitation spectra, and fitted curves of NaCaPO4:0.01Eu2+ with 0.03NaCl, monitored at 510 and 542 nm. | |
Therefore, to further investigate the process of concentration quenching, the type of interaction among the activator Eu2+ ions was calculated by the following equation:32–35
| | |
I/x = K[1 + β(x)θ/3]−1
| (2) |
where
I and
x represent the emission intensity and the concentration of the activator ion, respectively;
β and
K are the specific constants for a given host crystal and excitation condition, and
θ = 3, 6, 8 or 10 denotes the non-radiative energy transfer mechanism of exchange coupling, dipole–dipole, dipole–quadrupole, and quadrupole–quadrupole interactions, respectively. The fitted lines of log(
I/
x)
versus log(
x) for two emission bands centered at 510 and 542 nm are shown in
Fig. 9b and c, respectively. The slopes of two fitted lines for 510 and 542 nm emission bands were −1.14 and −0.99, respectively. Therefore, the values of
θ were 3.42 and 2.97, close to 3, implying that the main concentration quenching mechanism of Eu
2+ ions for both 510 and 542 nm emission bands in NaCaPO
4 host were the exchange coupling interactions.
Fig. 9d shows the DR and excitation spectra of NaCaPO
4:0.01Eu
2+ with 0.03 NaCl, monitored at 510 and 542 nm. It can be seen that the DR spectrum matched well with the excitation spectra of NaCaPO
4:0.01Eu
2+ with 0.03NaCl. NaCaPO
4:0.01Eu
2+ with 0.03NaCl exhibited a broad absorption band from 200 to 450 nm, which was due to the transition of Eu
2+ that originated from 4f
7 ground state to 4f
65d excitation state. For the excitation spectra monitored at 510 and 542 nm, the spectral width at 542 nm was larger than that at 510 nm due to emission bands that originate from different Eu
2+ luminescence centers. To further study the reason for different excitation spectra monitored at 510 and 542 nm, their decay curves were measured, as shown in
Fig. 10a and b, respectively. A single exponential was used to fit the decay curves, and the effective lifetimes could be defined as:
36,37| |
 | (3) |
where
I(
t) is the emission intensity at time
t and
τ is the decay lifetime. The corresponding lifetimes at 510 and 542 nm for NaCaPO
4:
xEu
2+ with 0.03NaCl are shown in
Fig. 10a and b, respectively. For example, the lifetimes of NaCaPO
4:0.01Eu
2+ with 0.03NaCl for 510 and 542 nm emission bands were calculated to be 339.01 ns and 320.22 ns, respectively, which implies that two emission bands were attributed to two different Eu
2+ ion luminescence centers.
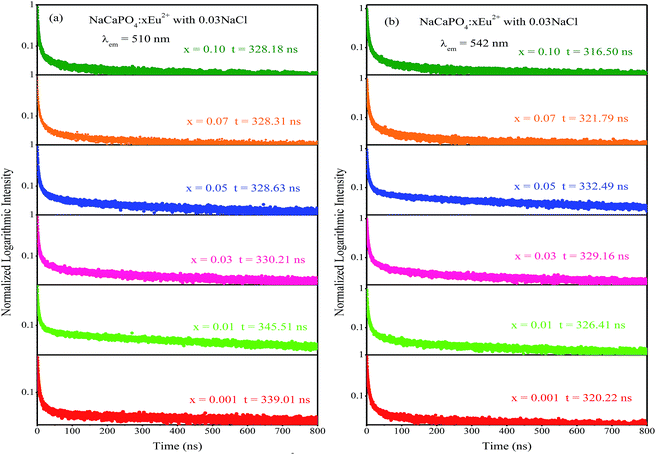 |
| | Fig. 10 Decay curves of NaCaPO4:xEu2+ with 0.03NaCl monitored at 510 nm (a) and 542 nm (b). | |
![[thin space (1/6-em)]](https://www.rsc.org/images/entities/char_2009.gif) :
:![[thin space (1/6-em)]](https://www.rsc.org/images/entities/char_2009.gif) 0.5, the full width at half maximum decreased. For Na(SrcCad)PO4:0.01Eu2+ with 0.03NaCl, the emission spectra show a broadened full width at half maximum with the increasing Ba2+ ions. Based on the abovementioned discussion, the emission spectra could be deconvoluted into two Gaussian components with the maxima at 510 nm (Eu(2)) and 542 nm (Eu(1)). For Na(BaaCab)PO4:0.01Eu2+ with 0.03NaCl and Na(SrcCad)PO4:0.01Eu2+ with 0.03NaCl, the fitted spectra of 510 nm and 542 nm are shown in Fig. 12a–d. The intensities of the 510 nm and 542 nm spectra for Na(BaaCab)PO4:0.01Eu2+ with 0.03NaCl increased with the increasing Ba2+ concentration up to a
0.5, the full width at half maximum decreased. For Na(SrcCad)PO4:0.01Eu2+ with 0.03NaCl, the emission spectra show a broadened full width at half maximum with the increasing Ba2+ ions. Based on the abovementioned discussion, the emission spectra could be deconvoluted into two Gaussian components with the maxima at 510 nm (Eu(2)) and 542 nm (Eu(1)). For Na(BaaCab)PO4:0.01Eu2+ with 0.03NaCl and Na(SrcCad)PO4:0.01Eu2+ with 0.03NaCl, the fitted spectra of 510 nm and 542 nm are shown in Fig. 12a–d. The intensities of the 510 nm and 542 nm spectra for Na(BaaCab)PO4:0.01Eu2+ with 0.03NaCl increased with the increasing Ba2+ concentration up to a![[thin space (1/6-em)]](https://www.rsc.org/images/entities/char_2009.gif) :
:![[thin space (1/6-em)]](https://www.rsc.org/images/entities/char_2009.gif) b = 0.2
b = 0.2![[thin space (1/6-em)]](https://www.rsc.org/images/entities/char_2009.gif) :
:![[thin space (1/6-em)]](https://www.rsc.org/images/entities/char_2009.gif) 0.8. Due to the concentration quenching effect, the intensities decreased with further increase in the concentration of Ba2+ ions. For Na(SrcCad)PO4:0.01Eu2+ with 0.03NaCl, the intensities of 510 nm and 542 nm increased and reached maxima at c
0.8. Due to the concentration quenching effect, the intensities decreased with further increase in the concentration of Ba2+ ions. For Na(SrcCad)PO4:0.01Eu2+ with 0.03NaCl, the intensities of 510 nm and 542 nm increased and reached maxima at c![[thin space (1/6-em)]](https://www.rsc.org/images/entities/char_2009.gif) :
:![[thin space (1/6-em)]](https://www.rsc.org/images/entities/char_2009.gif) d = 0.3
d = 0.3![[thin space (1/6-em)]](https://www.rsc.org/images/entities/char_2009.gif) :
:![[thin space (1/6-em)]](https://www.rsc.org/images/entities/char_2009.gif) 0.7 and then decreased with the increment of Sr2+ ions concentration. Fig. 13a–d show the normalized spectra of 510 nm and 542 nm for Na(BaaCab)PO4:0.01Eu2+ with 0.03NaCl and Na(SrcCad)PO4:0.01Eu2+ with 0.03NaCl excited at 365 nm. For Na(BaaCab)PO4:0.01Eu2+ with 0.03NaCl, it can be seen that the spectra of 510 nm and 542 nm shifted to a lower wavelength, as shown in Fig. 13a and b, respectively. Moreover, the full width at half maximum of the 510 nm spectra for Na(BaaCab)PO4:0.01Eu2+ with 0.03NaCl decreased when the ratio of Ba to Ca exceeded 0.5
0.7 and then decreased with the increment of Sr2+ ions concentration. Fig. 13a–d show the normalized spectra of 510 nm and 542 nm for Na(BaaCab)PO4:0.01Eu2+ with 0.03NaCl and Na(SrcCad)PO4:0.01Eu2+ with 0.03NaCl excited at 365 nm. For Na(BaaCab)PO4:0.01Eu2+ with 0.03NaCl, it can be seen that the spectra of 510 nm and 542 nm shifted to a lower wavelength, as shown in Fig. 13a and b, respectively. Moreover, the full width at half maximum of the 510 nm spectra for Na(BaaCab)PO4:0.01Eu2+ with 0.03NaCl decreased when the ratio of Ba to Ca exceeded 0.5![[thin space (1/6-em)]](https://www.rsc.org/images/entities/char_2009.gif) :
:![[thin space (1/6-em)]](https://www.rsc.org/images/entities/char_2009.gif) 0.5. However, for Na(SrcCad)PO4:0.01Eu2+ with 0.03NaCl, the full width at half maximum of 510 nm spectra decreased when the radio of Sr and Ca was greater than 0.7
0.5. However, for Na(SrcCad)PO4:0.01Eu2+ with 0.03NaCl, the full width at half maximum of 510 nm spectra decreased when the radio of Sr and Ca was greater than 0.7![[thin space (1/6-em)]](https://www.rsc.org/images/entities/char_2009.gif) :
:![[thin space (1/6-em)]](https://www.rsc.org/images/entities/char_2009.gif) 0.3, and no shift could be observed. The 542 nm spectra showed a blue shift with the increase of Sr2+ ions. Generally, the crystal field splitting (Dq) trends with bond length can be determined by the following equation:38–40where Dq is the magnitude of the 5d energy level separation, Z represents the anion charge or valence, e is the electron charge, r is the radius of the d wave function, and R is the bond length. The bond length of Ce–O will increase due to the lattice expansion because the radii of Ba2+ and Sr2+ are larger than that of Ca2+. Hence, the crystal field splitting will become weaker, which causes a blue shift and decreases full width at half maximum. The schematic mechanism of the decreased full width at half maximum and blue shift of Eu2+ emission is shown in Fig. 14 when Ba2+ and Sr2+ were substituted for Ca2+ in NaCaPO4:0.01Eu2+ with 0.03NaCl. The blue shift of Na(BaaCab)PO4:0.01Eu2+ with 0.03 NaCl was greater than that of Na(SrcCad)PO4:0.01Eu2+ with 0.03NaCl, which is due to that fact that the radius of Ba2+ (rBa = 1.34 nm) is larger than that of Sr2+ (rSr = 1.12 nm). The crystal field splitting of Na(BaaCab)PO4:0.01Eu2+ with 0.03NaCl was weaker, and a more obvious blue shift could be observed. For Na(SrcCad)PO4:0.01Eu2+ with 0.03NaCl, comparing the decreased full width at half maximum of the 510 nm band and the blue shift of the 542 nm band, the difference may be that Eu2+ had different coordinations (i.e., eight and seven coordination). Therefore, the emission properties could be tuned by controlling the concentration of Ba2+ or Sr2+. Fig. 15a and b show CIE chromaticity coordinates and images of Na(BaaCab)PO4:0.01Eu2+ with 0.03NaCl and Na(SrcCad)PO4:0.01Eu2+ with 0.03NaCl under a 365 nm UV lamp. It can be seen that the emission color of Na(BaaCab)PO4:0.01Eu2+ with 0.03NaCl and Na(SrcCad)PO4:0.01Eu2+ with 0.03NaCl could change from green (0.1996, 0.4380) to blue (0.1578, 0.0978) or to cyan (0.2285, 0.2853), respectively. The corresponding images of the samples are shown in Fig. 15.
0.3, and no shift could be observed. The 542 nm spectra showed a blue shift with the increase of Sr2+ ions. Generally, the crystal field splitting (Dq) trends with bond length can be determined by the following equation:38–40where Dq is the magnitude of the 5d energy level separation, Z represents the anion charge or valence, e is the electron charge, r is the radius of the d wave function, and R is the bond length. The bond length of Ce–O will increase due to the lattice expansion because the radii of Ba2+ and Sr2+ are larger than that of Ca2+. Hence, the crystal field splitting will become weaker, which causes a blue shift and decreases full width at half maximum. The schematic mechanism of the decreased full width at half maximum and blue shift of Eu2+ emission is shown in Fig. 14 when Ba2+ and Sr2+ were substituted for Ca2+ in NaCaPO4:0.01Eu2+ with 0.03NaCl. The blue shift of Na(BaaCab)PO4:0.01Eu2+ with 0.03 NaCl was greater than that of Na(SrcCad)PO4:0.01Eu2+ with 0.03NaCl, which is due to that fact that the radius of Ba2+ (rBa = 1.34 nm) is larger than that of Sr2+ (rSr = 1.12 nm). The crystal field splitting of Na(BaaCab)PO4:0.01Eu2+ with 0.03NaCl was weaker, and a more obvious blue shift could be observed. For Na(SrcCad)PO4:0.01Eu2+ with 0.03NaCl, comparing the decreased full width at half maximum of the 510 nm band and the blue shift of the 542 nm band, the difference may be that Eu2+ had different coordinations (i.e., eight and seven coordination). Therefore, the emission properties could be tuned by controlling the concentration of Ba2+ or Sr2+. Fig. 15a and b show CIE chromaticity coordinates and images of Na(BaaCab)PO4:0.01Eu2+ with 0.03NaCl and Na(SrcCad)PO4:0.01Eu2+ with 0.03NaCl under a 365 nm UV lamp. It can be seen that the emission color of Na(BaaCab)PO4:0.01Eu2+ with 0.03NaCl and Na(SrcCad)PO4:0.01Eu2+ with 0.03NaCl could change from green (0.1996, 0.4380) to blue (0.1578, 0.0978) or to cyan (0.2285, 0.2853), respectively. The corresponding images of the samples are shown in Fig. 15.
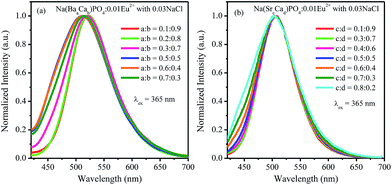 |
| | Fig. 11 Normalized emission spectra of Na(BaaCab)PO4:0.01Eu2+ and Na(SrcCad)PO4:0.01Eu2+ with 0.03NaCl excited at 365 nm. | |
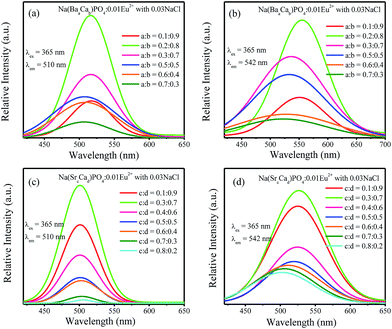 |
| | Fig. 12 (a)–(d) Fitted curves at 510 nm and 542 nm for Na(BaaCab)PO4:0.01Eu2+ and Na(SrcCad)PO4:0.01Eu2+ with 0.03NaCl excited at 365 nm. | |
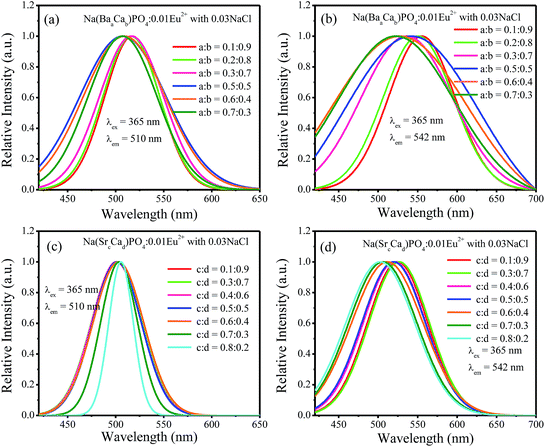 |
| | Fig. 13 (a)–(d) Normalized spectra at 510 nm and 542 nm for Na(BaaCab)PO4:0.01Eu2+ with 0.03NaCl and Na(SrcCad)PO4:0.01Eu2+ with 0.03NaCl excited at 365 nm. | |
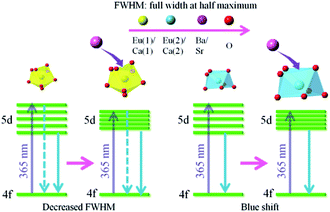 |
| | Fig. 14 Schematic of the mechanism accounting for the decreased full width at half maximum and blue shift of Eu2+ emission. | |
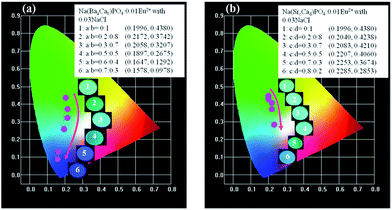 |
| | Fig. 15 CIE chromaticity coordinates and images of Na(BaaCab)PO4:0.01Eu2+ with 0.03NaCl (a) and Na(SrcCad)PO4:0.01Eu2+ with 0.03NaCl (b) under a 365 nm UV lamp. | |
For LED applications, the thermal stability of the phosphor is one of the important parameters. The temperature-dependent emission spectra of Na(Ba0.7Ca0.3)PO4:0.01Eu2+ with 0.03NaCl and Na(Sr0.8Ca0.2)PO4:0.01Eu2+ with 0.03NaCl under the excitation of 365 nm were investigated, as shown in Fig. 16a and b, respectively. It was observed that the emission intensity continuously decreased with the increasing temperature from room temperature to 200 °C. The emission intensity of Na(Ba0.7Ca0.3)PO4:0.01Eu2+ with 0.03NaCl and Na(Sr0.8Ca0.2)PO4:0.01Eu2+ with 0.03NaCl decreased to 90% and 76% of the initial emission intensity, respectively, corresponding to 100 °C. It can be seen that the thermal quenching of Na(Sr0.8Ca0.2)PO4:0.01Eu2+ with 0.03NaCl was inferior to that of Na(Ba0.7Ca0.3)PO4:0.01Eu2+ with 0.03NaCl. The reason is that in Na(Ba/Sr/Ca)PO4:Eu2+ with NaCl, with the replacement of Eu2+–Eu2+ neighbors by Eu2+–Ba2+/Sr2+ pairs, the emission intensity will decrease with an increment in temperature due to the lower nonradiative decay rate from the lowest excited state, according to Peng et al.41 The bond length will become shorter when Ba2+ is co-doped in NaCaPO4:Eu2+ with NaCl with respect to Sr2+ co-doping because the radius of Ba2+ is larger than that of Sr2+. The thermal excitation from Eu2+–Ba2+/Sr2+ may occur differently with an increase in temperature. Hence, co-doping Sr will lead to worse thermal quenching compared to co-doping Ba due to covalent effects. The slightly decreased intensity indicated that the Na(Ba/Sr/Ca)PO4:0.01Eu2+ with 0.03NaCl phosphor could be applied to a white LED. To investigate the relationship of luminescence with temperature and to calculate the activation energy from thermal quenching, the activation energy (Ea) can be expressed by the following formula:42
| |
I = I0/[1 + c![[thin space (1/6-em)]](https://www.rsc.org/images/entities/char_2009.gif) exp(−Ea/kT)] exp(−Ea/kT)]
| (5) |
where
I and
I0 are the luminescence intensities of the phosphor at the testing temperature and room temperature, respectively,
Ea represents the thermal quenching activation energy of the phosphor,
c is the rate constant for thermally activated escape, and
k is the Boltzmann constant (8.629 × 10
−5 eV K
−1). The inset of
Fig. 16a and b show the plots of ln[(
I0/
I) − 1]
versus 1/
T for Na(Ba
0.7Ca
0.3)PO
4:0.01Eu
2+ with 0.03NaCl and Na(Sr
0.8Ca
0.2)PO
4:0.01Eu
2+ with 0.03NaCl, respectively. The calculated
Ea were 0.1506 and 0.2399 eV for Na(Ba
0.7Ca
0.3)PO
4:0.01Eu
2+ with 0.03NaCl and Na(Sr
0.8Ca
0.2)PO
4:0.01Eu
2+ with 0.03NaCl, which indicate that the phosphors show relatively good thermal stability and can be used in an LED.
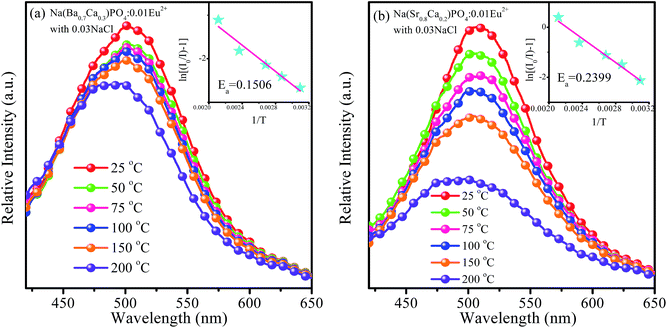 |
| | Fig. 16 Temperature-dependent emission spectra of Na(Ba0.7Ca0.3)PO4:0.01Eu2+ with 0.03NaCl (a) and Na(Sr0.8Ca0.2)PO4:0.01Eu2+ with 0.03NaCl (b) excited at 365 nm. The inset shows the activation energy of Na(Ba0.7Ca0.3)PO4:0.01Eu2+ with 0.03NaCl (a) and Na(Sr0.8Ca0.2)PO4:0.01Eu2+ with 0.03NaCl (b). | |
To verify the actual application of the phosphor, we chose the sample with the broadest full width at half maximum to fabricate a white LED. The devices were combined with a 380 nm UV chip (CaSr)AlSiN3:Eu2+ and Na(Ba0.7Ca0.3)PO4:0.01Eu2+ with 0.03NaCl phosphors, Fig. 17a. CIE coordinates were (0.3750, 0.3634), and the image shows an excellent white light, as shown in Fig. 17b. Fig. 17c shows the electroluminescence spectrum of the white LED. Tt can be seen that the spectrum shows a stronger emission in the range of 480–510 nm. The quantum efficiency of Na(Ba0.7Ca0.3)PO4:0.01Eu2+ with 0.03NaCl was 45.06%. Therefore, Na(Ba/Sr/Ca)PO4:0.01Eu2+ with 0.03NaCl has potential applications in white LEDs.
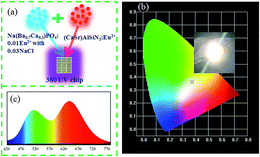 |
| | Fig. 17 (a) Diagram of white LED package. (b) CIE chromaticity coordinates and photos of white LED, which is fabricated by Na(Ba0.7Ca0.3)PO4:0.01Eu2+ with 0.03 NaCl and (CaSr)AlSiN3:Eu2+ phosphors. (c) Electroluminescence spectra of white LED composed of a 380 nm UV chip. | |
 Open Access Article
 *,
Zhijun Wang
 *,
Shuchao Xu,
Ting Li and
Zhiping Yang
![[thin space (1/6-em)]](https://www.rsc.org/images/entities/char_2009.gif) :
:![[thin space (1/6-em)]](https://www.rsc.org/images/entities/char_2009.gif) b = 0
b = 0![[thin space (1/6-em)]](https://www.rsc.org/images/entities/char_2009.gif) :
:![[thin space (1/6-em)]](https://www.rsc.org/images/entities/char_2009.gif) 1, 0.1
1, 0.1![[thin space (1/6-em)]](https://www.rsc.org/images/entities/char_2009.gif) :
:![[thin space (1/6-em)]](https://www.rsc.org/images/entities/char_2009.gif) 0.9, 0.3
0.9, 0.3![[thin space (1/6-em)]](https://www.rsc.org/images/entities/char_2009.gif) :
:![[thin space (1/6-em)]](https://www.rsc.org/images/entities/char_2009.gif) 0.7, 0.5
0.7, 0.5![[thin space (1/6-em)]](https://www.rsc.org/images/entities/char_2009.gif) :
:![[thin space (1/6-em)]](https://www.rsc.org/images/entities/char_2009.gif) 0.5, 0.7
0.5, 0.7![[thin space (1/6-em)]](https://www.rsc.org/images/entities/char_2009.gif) :
:![[thin space (1/6-em)]](https://www.rsc.org/images/entities/char_2009.gif) 0.3, and 1
0.3, and 1![[thin space (1/6-em)]](https://www.rsc.org/images/entities/char_2009.gif) :
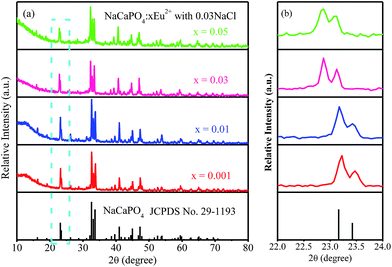
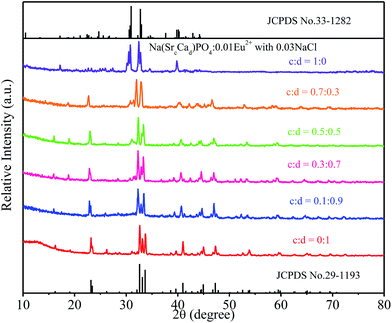
:![[thin space (1/6-em)]](https://www.rsc.org/images/entities/char_2009.gif) 0) phosphors are given in Fig. 5. The standard data for NaCaPO4 (JCPDS no. 29-1193) and NaBaPO4 (JCPDS no. 33-1210) are also shown as a reference in Fig. 5. We can see that Na(BaaCab)PO4:0.01Eu2+ with 0.03NaCl can be basically indexed to the NaCaPO4 phase (JCPDS no. 29-1193) when a ≤ 0.5. The phases of Na(BaaCab)PO4:0.01Eu2+ with 0.03NaCl agreed well with the standard data for the NaBaPO4 phase (JCPDS no. 33-1210) with the increase of a.
0) phosphors are given in Fig. 5. The standard data for NaCaPO4 (JCPDS no. 29-1193) and NaBaPO4 (JCPDS no. 33-1210) are also shown as a reference in Fig. 5. We can see that Na(BaaCab)PO4:0.01Eu2+ with 0.03NaCl can be basically indexed to the NaCaPO4 phase (JCPDS no. 29-1193) when a ≤ 0.5. The phases of Na(BaaCab)PO4:0.01Eu2+ with 0.03NaCl agreed well with the standard data for the NaBaPO4 phase (JCPDS no. 33-1210) with the increase of a.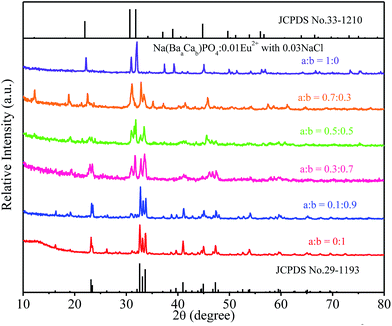
![[thin space (1/6-em)]](https://www.rsc.org/images/entities/char_2009.gif) :
:![[thin space (1/6-em)]](https://www.rsc.org/images/entities/char_2009.gif) b = 0.3
b = 0.3![[thin space (1/6-em)]](https://www.rsc.org/images/entities/char_2009.gif) :
:![[thin space (1/6-em)]](https://www.rsc.org/images/entities/char_2009.gif) 0.7) and Na(SrcCad)PO4:0.01Eu2+ with 0.03NaCl (c
0.7) and Na(SrcCad)PO4:0.01Eu2+ with 0.03NaCl (c![[thin space (1/6-em)]](https://www.rsc.org/images/entities/char_2009.gif) :
:![[thin space (1/6-em)]](https://www.rsc.org/images/entities/char_2009.gif) d = 0.3
d = 0.3![[thin space (1/6-em)]](https://www.rsc.org/images/entities/char_2009.gif) :
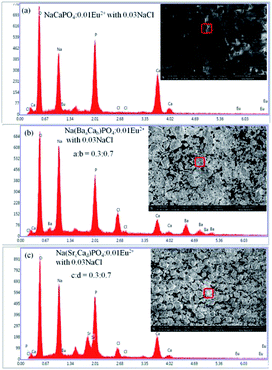
:![[thin space (1/6-em)]](https://www.rsc.org/images/entities/char_2009.gif) 0.7). It can be clearly observed that the grains of NaCaPO4:0.01Eu2+ with 0.03NaCl have a spherical shape, and the EDX results indicates that the phosphor has a chemical composition of Na, Ca, P, O, Cl, and Eu. Phosphors showed an irregular shape of blocky particles when Ba2+ and Sr2+ were doped in NaCaPO4:0.01Eu2+ with 0.03NaCl. The EDX spectra of Na(BaaCab)PO4:0.01Eu2+ with 0.03NaCl (a
0.7). It can be clearly observed that the grains of NaCaPO4:0.01Eu2+ with 0.03NaCl have a spherical shape, and the EDX results indicates that the phosphor has a chemical composition of Na, Ca, P, O, Cl, and Eu. Phosphors showed an irregular shape of blocky particles when Ba2+ and Sr2+ were doped in NaCaPO4:0.01Eu2+ with 0.03NaCl. The EDX spectra of Na(BaaCab)PO4:0.01Eu2+ with 0.03NaCl (a![[thin space (1/6-em)]](https://www.rsc.org/images/entities/char_2009.gif) :
:![[thin space (1/6-em)]](https://www.rsc.org/images/entities/char_2009.gif) b = 0.3
b = 0.3![[thin space (1/6-em)]](https://www.rsc.org/images/entities/char_2009.gif) :
:![[thin space (1/6-em)]](https://www.rsc.org/images/entities/char_2009.gif) 0.7) and Na(SrcCad)PO4:0.01Eu2+ with 0.03NaCl (c
0.7) and Na(SrcCad)PO4:0.01Eu2+ with 0.03NaCl (c![[thin space (1/6-em)]](https://www.rsc.org/images/entities/char_2009.gif) :
:![[thin space (1/6-em)]](https://www.rsc.org/images/entities/char_2009.gif) d = 0.3
d = 0.3![[thin space (1/6-em)]](https://www.rsc.org/images/entities/char_2009.gif) :
:![[thin space (1/6-em)]](https://www.rsc.org/images/entities/char_2009.gif) 0.7) confirmed the presence of all elements in the samples. These results suggest that well-crystallized powders were obtained.
0.7) confirmed the presence of all elements in the samples. These results suggest that well-crystallized powders were obtained.

![[thin space (1/6-em)]](https://www.rsc.org/images/entities/char_2009.gif) 000 cm−1 for Eu2+), V is the valence of the active cation (V = 2 for Eu2+), n is the coordination number, and r is the radius of the host cation (Ca2+) replaced by the activator Eu2+ ion (Å). The value of Ea was difficult to obtain due to the complexity of the host, but it was constant in the same host. E is proportional to the n and r of the sample; hence, Eu2+ ions with a higher coordination number generally emit at a higher energy, corresponding to a lower wavelength. As a result, 510 (Eu2) and 542 nm (Eu1) emission bands correspond to Ca(2) (Ca(3)) and Ca(1), respectively.
000 cm−1 for Eu2+), V is the valence of the active cation (V = 2 for Eu2+), n is the coordination number, and r is the radius of the host cation (Ca2+) replaced by the activator Eu2+ ion (Å). The value of Ea was difficult to obtain due to the complexity of the host, but it was constant in the same host. E is proportional to the n and r of the sample; hence, Eu2+ ions with a higher coordination number generally emit at a higher energy, corresponding to a lower wavelength. As a result, 510 (Eu2) and 542 nm (Eu1) emission bands correspond to Ca(2) (Ca(3)) and Ca(1), respectively.

![[thin space (1/6-em)]](https://www.rsc.org/images/entities/char_2009.gif) :
:![[thin space (1/6-em)]](https://www.rsc.org/images/entities/char_2009.gif) 0.5, the full width at half maximum decreased. For Na(SrcCad)PO4:0.01Eu2+ with 0.03NaCl, the emission spectra show a broadened full width at half maximum with the increasing Ba2+ ions. Based on the abovementioned discussion, the emission spectra could be deconvoluted into two Gaussian components with the maxima at 510 nm (Eu(2)) and 542 nm (Eu(1)). For Na(BaaCab)PO4:0.01Eu2+ with 0.03NaCl and Na(SrcCad)PO4:0.01Eu2+ with 0.03NaCl, the fitted spectra of 510 nm and 542 nm are shown in Fig. 12a–d. The intensities of the 510 nm and 542 nm spectra for Na(BaaCab)PO4:0.01Eu2+ with 0.03NaCl increased with the increasing Ba2+ concentration up to a
0.5, the full width at half maximum decreased. For Na(SrcCad)PO4:0.01Eu2+ with 0.03NaCl, the emission spectra show a broadened full width at half maximum with the increasing Ba2+ ions. Based on the abovementioned discussion, the emission spectra could be deconvoluted into two Gaussian components with the maxima at 510 nm (Eu(2)) and 542 nm (Eu(1)). For Na(BaaCab)PO4:0.01Eu2+ with 0.03NaCl and Na(SrcCad)PO4:0.01Eu2+ with 0.03NaCl, the fitted spectra of 510 nm and 542 nm are shown in Fig. 12a–d. The intensities of the 510 nm and 542 nm spectra for Na(BaaCab)PO4:0.01Eu2+ with 0.03NaCl increased with the increasing Ba2+ concentration up to a![[thin space (1/6-em)]](https://www.rsc.org/images/entities/char_2009.gif) :
:![[thin space (1/6-em)]](https://www.rsc.org/images/entities/char_2009.gif) b = 0.2
b = 0.2![[thin space (1/6-em)]](https://www.rsc.org/images/entities/char_2009.gif) :
:![[thin space (1/6-em)]](https://www.rsc.org/images/entities/char_2009.gif) 0.8. Due to the concentration quenching effect, the intensities decreased with further increase in the concentration of Ba2+ ions. For Na(SrcCad)PO4:0.01Eu2+ with 0.03NaCl, the intensities of 510 nm and 542 nm increased and reached maxima at c
0.8. Due to the concentration quenching effect, the intensities decreased with further increase in the concentration of Ba2+ ions. For Na(SrcCad)PO4:0.01Eu2+ with 0.03NaCl, the intensities of 510 nm and 542 nm increased and reached maxima at c![[thin space (1/6-em)]](https://www.rsc.org/images/entities/char_2009.gif) :
:![[thin space (1/6-em)]](https://www.rsc.org/images/entities/char_2009.gif) d = 0.3
d = 0.3![[thin space (1/6-em)]](https://www.rsc.org/images/entities/char_2009.gif) :
:![[thin space (1/6-em)]](https://www.rsc.org/images/entities/char_2009.gif) 0.7 and then decreased with the increment of Sr2+ ions concentration. Fig. 13a–d show the normalized spectra of 510 nm and 542 nm for Na(BaaCab)PO4:0.01Eu2+ with 0.03NaCl and Na(SrcCad)PO4:0.01Eu2+ with 0.03NaCl excited at 365 nm. For Na(BaaCab)PO4:0.01Eu2+ with 0.03NaCl, it can be seen that the spectra of 510 nm and 542 nm shifted to a lower wavelength, as shown in Fig. 13a and b, respectively. Moreover, the full width at half maximum of the 510 nm spectra for Na(BaaCab)PO4:0.01Eu2+ with 0.03NaCl decreased when the ratio of Ba to Ca exceeded 0.5
0.7 and then decreased with the increment of Sr2+ ions concentration. Fig. 13a–d show the normalized spectra of 510 nm and 542 nm for Na(BaaCab)PO4:0.01Eu2+ with 0.03NaCl and Na(SrcCad)PO4:0.01Eu2+ with 0.03NaCl excited at 365 nm. For Na(BaaCab)PO4:0.01Eu2+ with 0.03NaCl, it can be seen that the spectra of 510 nm and 542 nm shifted to a lower wavelength, as shown in Fig. 13a and b, respectively. Moreover, the full width at half maximum of the 510 nm spectra for Na(BaaCab)PO4:0.01Eu2+ with 0.03NaCl decreased when the ratio of Ba to Ca exceeded 0.5![[thin space (1/6-em)]](https://www.rsc.org/images/entities/char_2009.gif) :
:![[thin space (1/6-em)]](https://www.rsc.org/images/entities/char_2009.gif) 0.5. However, for Na(SrcCad)PO4:0.01Eu2+ with 0.03NaCl, the full width at half maximum of 510 nm spectra decreased when the radio of Sr and Ca was greater than 0.7
0.5. However, for Na(SrcCad)PO4:0.01Eu2+ with 0.03NaCl, the full width at half maximum of 510 nm spectra decreased when the radio of Sr and Ca was greater than 0.7![[thin space (1/6-em)]](https://www.rsc.org/images/entities/char_2009.gif) :
:![[thin space (1/6-em)]](https://www.rsc.org/images/entities/char_2009.gif) 0.3, and no shift could be observed. The 542 nm spectra showed a blue shift with the increase of Sr2+ ions. Generally, the crystal field splitting (Dq) trends with bond length can be determined by the following equation:38–40
0.3, and no shift could be observed. The 542 nm spectra showed a blue shift with the increase of Sr2+ ions. Generally, the crystal field splitting (Dq) trends with bond length can be determined by the following equation:38–40


![[thin space (1/6-em)]](https://www.rsc.org/images/entities/char_2009.gif) exp(−Ea/kT)]
exp(−Ea/kT)]

