 Open Access Article
Creative Commons Attribution 3.0 Unported Licence
Pressure-induced ionic liquid crystal in 1-dodecyl-3-methylimidazolium tetrafluoroborate†
Xiang Zhuab,
Haining Libd,
Zheng Wangbd,
Chaosheng Yuanb,
Pinwen Zhu*a,
Lei Su *bc,
Kun Yangb,
Jie Wub,
Guoqiang Yang
 *c and
Xiaodong Lie
aState Key Laboratory of Superhard Materials, Jilin University, Changchun, 130012, China. E-mail: zhupw@jlu.edu.cn
bCenter for High Pressure Science and Technology Research, Zhengzhou University of Light Industry, Zhengzhou, 450002, China
cKey Laboratory of Photochemistry, Institute of Chemistry, University of Chinese Academy of Sciences, Chinese Academy of Sciences, Beijing 100190, China. E-mail: leisu2050@iccas.ac.cn; gqyang@iccas.ac.cn
dSchool of Sciences, Wuhan University of Technology, Wuhan, Hubei 430070, China
eBeijing Synchrotron Radiation Facility, Institute of High Energy Physics, Chinese Academy of Sciences, Beijing 100039, China
First published on 17th May 2017
Abstract
The phase behaviors of 1-dodecyl-3-methylimidazolium tetrafluoroborate ([C12MIM][BF4]) had been investigated by means of Raman spectroscopy and polarized optical microscopy under pressure values up to 2.0 GPa at the temperature of 80.0 °C. Upon compression, change in the ratio of peak heights of symmetric and asymmetric CH2 stretching modes of Raman spectra in [C12MIM][BF4] (r(CH2)ss/(CH2)as) indicated that it might experience two successive phase transitions. The structure evolution of the sample, which was investigated through the image analysis from polarized optical microscopy, was found to share many of the known quantitative properties of the smectic A phase of [C12MIM][BF4]. These facts were suggestive of ionic liquid crystal induced by compression in [C12MIM][BF4] under the pressure between 0.25 GPa to 0.60 GPa, which was similar to ionic liquid crystal upon cooling from its melt.
1. Introduction
Ionic liquid crystals (ILCs) are a class of liquid-crystalline compounds containing (positively charged) cations and (negatively charged) anions.1–5 The ionic character means that some of the properties of the ILCs differ significantly from that of conventional liquid crystals (LCs). In particular, the incorporation of an ionic functionality affords the resulting ILCs several advantages over conventional LCs, such as intrinsic ionic conductivity, a relatively wide mesophase temperature range, and enhancement of the mesophase phase stability. Their liquid crystal behaviors, including phase transition temperature, mesogenic temperature range and mesogenic phase, can be fine-tuned by the rational combination of cation, anion, mesogenic unit, alkyl chain, and even functional groups.6 They are anisotropic solvents and can be used as ordered reaction media that impart selectivity in reactions,7 or as templates for the synthesis of mesoporous materials8–11 and nanomaterials,12–14 or zeolitic materials.15 ILCs are also very promising candidates to design anisotropic ion-conductive materials because they have an anisotropic structural organization and ionic character.4Since the first ILCs were reported by Knight and Shaw in 1938,16 only a limited range of ionic liquid crystalline species had been known. So far, a few papers reported thermotropic ionic liquid crystalline materials containing imidazolium-based salts, ammonium-based salts, phosphonium-based salts, pyridinium-based salts, 4,4′-bipyridinium-based salts, and several new cationic cores for ILCs.4,5 Generally, similar to common LCs, ILCs could be divided into two basic classifications: thermotropic and lyotropic. Except for thermotropic mesophases, studies on lyotropic mesophases obtained from ILs in aqueous solution had also been reported.17–21 And several photo-induced mesophases of ILs involving photochromic moieties obtained by photoirradiation had been reported.22–27 In general, a thermotropic mesophase was formed by heating a solid or cooling an isotropic liquid, and a lyotropic mesophase was prepared by dissolving an amphiphilic mesogen (a compound that displayed liquid crystalline behavior) in a suitable solvent, under appropriate conditions of concentration and temperature. And a photo-induced mesophase was obtained by irradiation with either ultraviolet light or visible light.
In fact, for solidification of melt, there are two ways. The conventional method is cooling, and the other effective way is compression. Inspired by thermotropic mesophase, lyotropic mesophase and photo-induced mesophase, it could be speculated that there might be a pressure-induced mesophase, which might be formed by compressing an isotropic liquid. 1-Dodecyl-3-methylimidazolium tetrafluoroborate ([C12MIM][BF4]), a typical ILC with a mesophase close to room temperature, is chosen as the research object considering that the phase behavior of [C12MIM][BF4] have been frequently investigated by using differential scanning calorimetry (DSC) and polarized optical microscopy (POM).27–29 In order to further investigate the structure and phase transition of room temperature ionic liquids under extreme conditions, and enhance a better understanding of solidification of this class of compounds, in this work, in situ Raman and POM measurement of [C12MIM][BF4] was conducted under high pressure in detail. Especially, the first observation of pressure-induced ionic liquid crystal in [C12MIM][BF4] was discussed in detail.
2. Experimental section
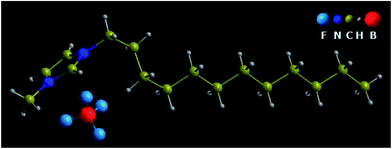
1-Dodecyl-3-methylimidazolium tetrafluoroborate, namely [C12MIM][BF4] (Lanzhou Institute of Chemical Physics, the Chinese Academy of Sciences, Lanzhou, China), with purity above 99.5%, was used as the starting material. The molecular weight of [C12MIM][BF4] is 338.24 g mol−1. Fig. 1 shows the schematic diagram of [C12MIM][BF4]. The melting point and clearing point of the sample were determined by heated-stage polarized optical microscopy (an Olympus BX50 microscope equipped with a Linkam THMS600 Heating and Freezing Stage, Japan High tech).The temperature and pressure of the sample were simultaneously controlled by a resistance-heated diamond anvil cell (DAC). Two type-Ia diamonds were used and the diamond culet size was 0.5 mm. The sample was contained in a 0.2 mm diameter hole in a T301 gasket which was preindented to a thickness of about 90 μm and clamped between the two diamond anvils. The temperature was measured by NiCr–NiSi thermocouples with a precision of 1 K. The pressure was measured by the ruby-scale method.30 The samples were held under each predetermined temperature and pressure for a long time, so that the equilibrium was established, and then the data were determined. Raman spectra were obtained by using a Renishaw inVia Raman microscope (Renishaw, United Kingdom) with 532 nm wavelength excitation. Raman spectra were collected in a backscattering geometry with a 2400 gr per mm holographic grating, and the slit width was selected as 65 μm corresponding to a resolution of ca. 0.5 cm−1. All of the obtained Raman spectra were fitted with Gaussian–Lorentzian mixing functions using the WIRE 3.3 software (Renishaw, United Kingdom) for analyzing the spectral data.
3. Results and discussion
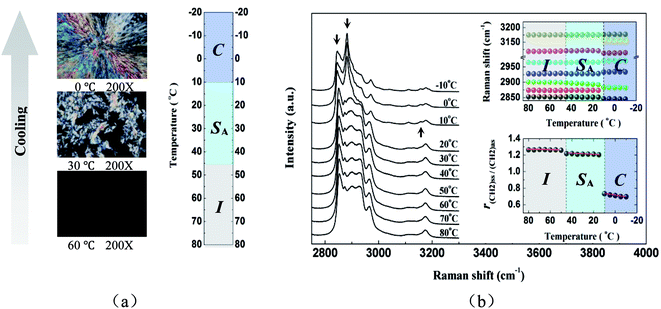
Fig. 2a showed representative polarized microscopy images of [C12MIM][BF4] from the temperature of 80.0 °C to −10.0 °C. With decreasing temperature at the rate of 5.0 °C min−1, phase transitions were observed at the temperature of 47.5 °C and 10.5 °C, and they were assigned as isotropic liquid (I) to smectic A (SA) and SA to crystal (C) respectively, which were similar to the results gained by previous researchers.27–29 At the higher temperature, a rather dark image maintained the isotropic phase. Upon cooling, a lot of small batonnets formed, and then rapidly dispersed into many regions of focal conic-like texture, which was indicative of a layered SA mesophase, supporting the assignment of the phase transition detected at ∼47.5 °C as I–SA. Upon further cooling, the optical image changed to a characteristic crystal texture, and thus the transition at ∼10.5 °C was assigned as SA–C. The results were in excellent agreement with those reported by Zhang et al. within the experimental error.27It is well known that Raman spectroscopy is deemed to be a very convenient technique to study structures and structural changes of materials. “It was reported that the changes in the C–H stretching region of Raman spectra could be correlated with polymethylene chain conformation and chain environment.31–38 Larsson reported that the C–H stretching vibration region in lipid Raman spectra could be used to identify different states of order.34 And then, Larsson and Rand pointed out that these spectral effects mainly were due to differences in the environment of the hydrocarbon chains.35 Snyder et al. pointed out that the intensity of methylene symmetric stretching mode was sensitive to lateral interactions and hence to the packing arrangement.36 Brown et al. pointed out that the intensity of methylene asymmetric stretching mode was sensitive to the conformation of the methylene chain, decreasing in the liquid-phase as compared to the solid.37 Wallach et al. pointed out that the ratio of the intensities of methylene antisymmetric and symmetric stretching modes was sensitive to both conformational disorder of the alkyl chains as well as their packing.38 In fact, this correlation had now become the basis for an important technique for investigating lipid structure in biological membranes”.39–41 Fig. 2b showed the selected Raman spectra in the C–H stretching region of [C12MIM][BF4] from 80.0 °C to −10.0 °C. As was shown in Fig. 2b, upon cooling, it could be easily seen that Raman spectra of [C12MIM][BF4] significantly varied at ∼10.5 °C, which was previously assigned as the SA–C phase transition. However, it was unexpected that the spectrum at below ∼47.5 °C (the sample should be expected to be in the SA phase) and that at above ∼47.5 °C (the sample should be expected to be in the I phase) were almost the same, indicating that the molecular structure of [C12MIM][BF4] in the SA phase was similar to that in the I phase.
According to the previously reported Raman spectra and approximately assignments of alkane-based materials and 1-alkyl-3-methylimidazolium based ionic liquids,39–43 the bands at ∼2845 cm−1 and ∼2880 cm−1 (marked by down arrow in Fig. 2b) could be easily assigned as the symmetric (ν(CH2)ss) and asymmetric CH2 stretching modes (ν(CH2)as). To our knowledge, r(CH2)ss/(CH2)as, which was the ratio of peak heights of ν(CH2)ss and ν(CH2)as, had been used as a measurement of the degree of order in a number of organic materials containing several ionic liquids.40,42,43 In addition, a lower value of r(CH2)ss/(CH2)as indicated a larger degree of linearity of alkyl chain in materials. As was shown in Fig. 2b, the r(CH2)ss/(CH2)as almost kept a constant value of 1.26 from 80.0 °C to 50.0 °C. However, the r(CH2)ss/(CH2)as suddenly decreased at the temperature of 45.0 °C and then maintained the value of 1.21 from 45.0 °C to 15.0 °C. Upon further cooling, the r(CH2)ss/(CH2)as dramatically decreased to the value of 0.75 at the temperature of 10.0 °C and then slightly reduced from 10.0 °C to −10.0 °C. It could be speculated that [C12MIM][BF4] might experience two successive phase transitions at about 45.0 °C and 10.0 °C, respectively. And these two phase transitions obtained by Raman spectroscopy were further confirmed completely the I–SA phase transition at ∼47.5 °C and the SA–C phase transition at ∼10.5 °C, which were detected by POM. Moreover, for the phases I, SA, and C, the r(CH2)ss/(CH2)as was approximately equal to 1.26, 1.21, and 0.75, respectively, which indicated that the I phase had the smallest degree of linearity of alkyl chain, the SA phase had slightly larger degree of linearity of alkyl chain than the I phase, and the C phase had the largest degree of linearity of alkyl chain. From the above analysis, a conclusion might be drawn that the discontinuous points of r(CH2)ss/(CH2)as of Raman spectra in [C12MIM][BF4] as a function of temperature indicated phase transitions of [C12MIM][BF4]. In addition, the value of r(CH2)ss/(CH2)as in the SA phase was close to that in the I phase, which further indicated that the molecular structure of [C12MIM][BF4] in the SA phase was similar to that in the I phase.
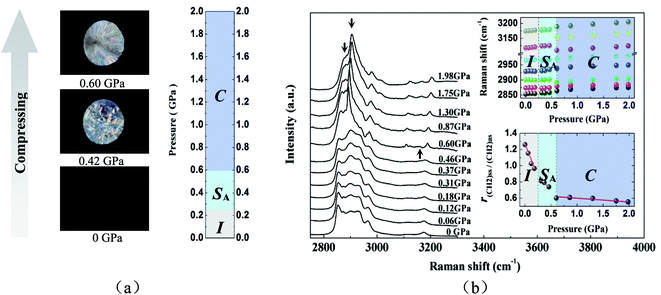
POM measurements had also been performed from the isotropic liquid under polarized light in order to study pressure-induced ILC in [C12MIM][BF4] at the temperature of 80.0 °C. Fig. 3a showed representative polarized microscopy images of [C12MIM][BF4] at different pressures from ambient pressure to ∼2.0 GPa. It was well known that a rather dark image in Fig. 3a referred to the isotropic phase. Upon compression from ambient pressure to ∼0.25 GPa, small batonnets first formed, and then rapidly dispersed into a homeotropic texture (i.e. the optical axis was perpendicular to the diamond anvils) with birefringence. Gray et al. pointed out that if a mesophase film was deformed, regions of focal conic and oily-streak texture were observed indicative of a layered SA mesophase.44 When the sample was compressed between two diamond anvils, spontaneous formation of a single homeotropic monodomain was frustrated and a fan-like texture was observed (as shown in Fig. 3a). It could be speculated that a layered SA mesophase formed. Upon further compression to ∼0.60 GPa, the optical image changed to a characteristic crystal texture (as shown in Fig. 3a). From the result above, it could be speculated that the phase transitions of I–SA and SA–C occurred at the pressure of ∼0.25 and ∼0.60 GPa, respectively.
Fig. 3b displayed the Raman spectra in the C–H stretching region of [C12MIM][BF4], Raman shift and r(CH2)ss/(CH2)as of Raman spectra in [C12MIM][BF4] as a function of pressure upon compression. Similar to temperature-induced Raman spectral changes of [C12MIM][BF4], pressure-induced isothermal SA–C phase transition was easily detected, while pressure-induced isothermal I–SA phase transition was rather difficult to discern. As was shown in Fig. 3b, it was expected that Raman spectra of [C12MIM][BF4] dramatically varied (the new band at 3157 cm−1 appeared suddenly and several bands had discontinuous change as a function of pressure) at ∼0.60 GPa assigned as SA–C by POM, and that slightly changed at ∼0.25 GPa assigned as I–SA by POM. In order to further investigate the pressure-induced I–SA phase transition from Raman spectroscopy, r(CH2)ss/(CH2)as in [C12MIM][BF4] as a function of pressure upon compression was also shown in Fig. 3b. It could been seen that the r(CH2)ss/(CH2)as decreased monotonously with increasing pressure, which meant that the linearity of alkyl chain of [C12MIM][BF4] increased upon compression. From Fig. 3b, it also could be seen that [C12MIM][BF4] experienced two successive phase transitions at ∼0.25 and ∼0.60 GPa, which were in excellent agreement with those detected by POM.
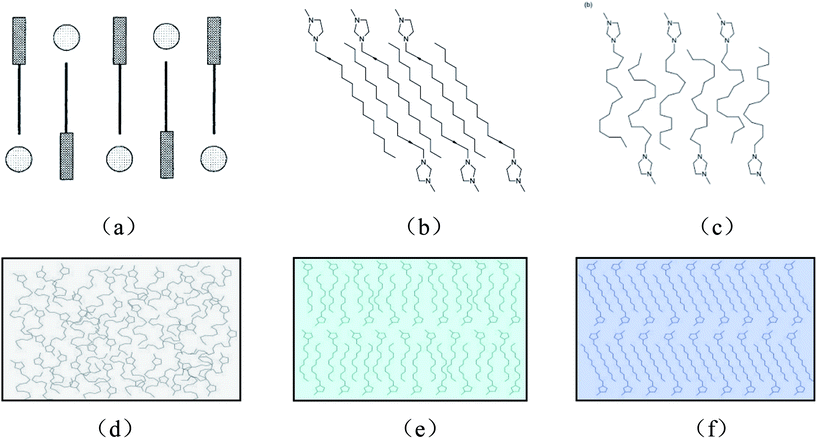
So far, most of the studies on imidazolium salts-related ILCs were restricted to compounds forming smectic mesophases. It was reported by Hardacre et al. that mesophases of 1-alkyl-3-methylimidazolium tetrachloropalladate(II) salts were observed when the alkyl chain was either C14H29, C16H33, or C18H37.45 And the mesophase was identified as a fully interdigitated SA phase. Bowlas et al. investigated the mesophase behavior of 1-alkyl-3-methylimidazolium salts with chloride, tetrachlorocobaltate(II) and tetrachloronickelate(II) counterions, and the compounds with C12H25, C14H29, C16H33, and C18H37 chain exhibited a SA phase with a large thermal stability range.46 And the suggested mesophase structure was shown in Fig. 4a. Gordon et al. investigated the phase behavior of 1-alkyl-3-methylimidazolium hexafluorophosphate salts [CnMIM][PF6], and the compounds with an alkyl chain of 14 or more carbon atoms displayed an enantiotropic mesophase, which was identified as a SA phase.47 And the respective crystalline and mesophase structure was suggested as those shown in Fig. 4b and c. Holbrey and Seddon investigated the thermal behavior of 1-alkyl-3-methylimidazolium tetrafluoroborate salts, [CnMIM][BF4] (n = 0–18).28 And the compounds with longer alkyl chains (n = 12–18) were low melting point solids that showed a mesophase upon heating. On the basis of the defect texture observed by POM, the mesophase was also identified as a SA phase. In view of the textures of mesophases of [C12MIM][BF4], observed by POM in the process of decreasing temperature or increasing pressure in this study, the structures of [C12MIM][BF4] were similar to the 1-alkyl-3-methylimidazolium salts which mentioned above. Specially, it was worth noting that the degree of linearity of alkyl chain increased when [C12MIM][BF4] experienced the phase transitions from I to SA then to C, based on the further analysis of Raman spectra. Therefore, we proposed the respective structure in I, SA and C of [C12MIM][BF4] as those shown in Fig. 4d–f. That is, the degree of linearity of alkyl chain increased with the degree of ordering in the sample. Of course, in order to ensure the detailed information of the phase above, there should be a series of high pressure experiments in situ, such as small angle X-ray studies of [C12MIM][BF4]. Further work will be conducted in the future.
In summary, the phase behaviors of [C12MIM][BF4] have been investigated by using in situ Raman spectroscopy and POM under high pressure. The results indicated that ionic liquid [C12MIM][BF4] experienced continuous phase transitions at the pressure of ∼0.25 and ∼0.60 GPa upon compression, which was similar to solidification from the melt of [C12MIM][BF4] upon cooling. And the first observation of pressure-induced ILC in [C12MIM][BF4] was discussed in detail. Our findings might enhance a better understanding of solidification of room temperature ionic liquids under extreme conditions.
Acknowledgements
This work is supported by the National Natural Science Foundation of China (No. 21273206, No. 21503194 and No. 31201377), Key Research Project of Higher Education of Henan Province (No. 15A140016 and No. 2010GGJS-110), and the School Scientific Research Fund project (No. 2013XJJ009).Notes and references
- G. A. Jeffrey, Acc. Chem. Res., 1986, 19, 168 CrossRef CAS.
- M. J. Blandamer, B. Briggs, P. M. Cullis and J. B. F. N. Engberts, Chem. Soc. Rev., 1995, 24, 251 RSC.
- F. Neve, Adv. Mater., 1996, 8, 277 CrossRef CAS.
- K. Binnemans, Chem. Rev., 2005, 105, 4148 CrossRef CAS PubMed.
- K. Goossens, K. Lava, C. W. Bielawski and K. Binnemans, Chem. Rev., 2016, 116, 4643 CrossRef CAS PubMed.
- K. V. Axenov and S. Laschat, Materials, 2011, 4, 206 CrossRef CAS.
- R. G. Weiss, Tetrahedron, 1988, 44, 3413 CrossRef CAS.
- N. Nishiyama, S. Tanaka, Y. Egashira, Y. Oku and K. Ueyama, Chem. Mater., 2003, 15, 1006 CrossRef CAS.
- K. E. Strawhecker and E. Manias, Chem. Mater., 2003, 15, 844 CrossRef CAS.
- T. Brennan, A. V. Hughes, S. J. Roser, S. Mann and K. J. Edler, Langmuir, 2002, 18, 9838 CrossRef CAS.
- H. P. Lin and C. Y. Mou, Acc. Chem. Res., 2002, 35, 927 CrossRef CAS PubMed.
- J. W. Gilman, W. H. Awad, R. D. Davis, J. Shields, R. H. Harris Jr, C. Davis, A. B. Morgan, T. E. Sutto, J. Callahan, P. C. Trulove and H. C. DeLong, Chem. Mater., 2002, 14, 3776 CrossRef CAS.
- J. Zhu, A. B. Morgan, F. J. Lamelas and C. A. Wilkie, Chem. Mater., 2001, 13, 3774 CrossRef CAS.
- L. S. Li, J. Walda, L. Manna and A. P. Alivisatos, Nano Lett., 2002, 2, 557 CrossRef CAS.
- B. O'Regan and M. Gratzel, Nature, 1991, 353, 737 CrossRef.
- G. A. Knight and B. D. Shaw, J. Chem. Soc., 1938, 682 RSC.
- J. Bowers, C. P. Butts, P. J. Martin, M. C. Vergara-Gurierrez and R. K. Heenan, Langmuir, 2004, 20, 2191 CrossRef CAS PubMed.
- A. Beyaz, W. S. Oh and V. P. Reddy, Colloids Surf., B, 2004, 35, 119 CrossRef CAS PubMed.
- B. P. Binks, A. K. F. Dyab and P. D. I. Fletcher, Chem. Commun., 2003, 2540 RSC.
- M. A. Firestone, J. A. Dzielawa, P. Zapol, L. A. Curtiss, S. Seifert and M. L. Dietz, Langmuir, 2002, 18, 7258 CrossRef CAS.
- S. E. Friberg, Q. Yin, F. Pavel, R. A. Mackay, J. D. Holbrey, K. R. Seddon and P. A. Aikens, J. Dispersion Sci. Technol., 2000, 21, 185 CrossRef CAS.
- S. Xiao, X. Lu, Q. Lu and B. Su, Macromolecules, 2008, 41, 3884 CrossRef CAS.
- T. Yoshimi, M. Moriyama and S. Ujiie, Mol. Cryst. Liq. Cryst., 2009, 511, 319 Search PubMed.
- M. Marcos, C. Sanchez, R. Alcala, J. Barbera, P. Romero and J. L. Serrano, Chem. Mater., 2008, 20, 5209 CrossRef CAS.
- Q. Zhang, X. Wang, C. J. Barrett and C. G. Bazuin, Chem. Mater., 2009, 21, 3216 CrossRef CAS.
- S. Xiao, X. Lu and Q. Lu, Macromolecules, 2007, 40, 7944 CrossRef CAS.
- S. G. Zhang, S. M. Liu, Y. Zhang and Y. Q. Deng, Chem.–Asian J., 2012, 7, 2004 CrossRef CAS PubMed.
- J. D. Holbrey and K. R. Seddon, J. Chem. Soc., Dalton Trans., 1999, 2133 RSC.
- J. Larionova, Y. Guari, C. Blanc, P. Dieudonne, A. Tokarev and C. Guerin, Langmuir, 2009, 25, 1138 CrossRef CAS PubMed.
- H. K. Mao, P. M. Bell, J. T. Shaner and D. J. Steinberg, J. Appl. Phys., 1978, 49, 3276 CrossRef CAS.
- B. J. Bulkin and K. Krishnan, J. Am. Chem. Soc., 1971, 93, 5998 CrossRef CAS.
- B. J. Bulkin and N. Krishnamachari, J. Am. Chem. Soc., 1972, 94, 1109 CrossRef CAS PubMed.
- K. G. Brown, W. L. Peticolas and E. Brown, Biochem. Biophys. Res. Commun., 1973, 54, 358 CrossRef CAS PubMed.
- K. Larsson, Chem. Phys. Lipids, 1973, 10, 165 CrossRef CAS.
- K. Larsson and B. P. Rand, Biochim. Biophys. Acta, Lipids Lipid Metab., 1973, 326, 245 CrossRef CAS.
- R. G. Snyder, S. L. Hsu and S. Krimm, Spectrochim. Acta, Part A, 1978, 34, 395 CrossRef.
- K. G. Brown, E. Bicknell-Brown and M. Ladjadj, J. Phys. Chem., 1987, 91, 3436 CrossRef CAS.
- D. F. H. Wallach, S. P. Verma and J. Fookson, Biochim. Biophys. Acta, 1979, 559, 153 CrossRef CAS.
- C. J. Orendorff, M. W. Ducey and J. E. Pemberton, J. Phys. Chem. A, 2002, 106, 6991 CrossRef CAS.
- H. L. Casal, D. G. Cameron and H. H. Mantsch, J. Phys. Chem., 1985, 89, 5557 CrossRef CAS.
- A. A. Dmitriev and N. V. Surovtsev, J. Phys. Chem. B, 2015, 119, 15613 CrossRef CAS PubMed.
- N. V. Venkataraman, S. Bhagyalakshmi, S. Vasudevan and R. Seshadri, Phys. Chem. Chem. Phys., 2002, 4, 4533 RSC.
- J. D. Roche, C. M. Gordon, C. T. Imrie, M. D. Ingram, A. R. Kennedy, F. L. Celso and A. Triolo, Chem. Mater., 2003, 15, 3089 CrossRef.
- G. W. Gray and J. W. G. Goodby, Smectic Liquid Crystals, Leonard Hill, Glasgow, England, 1984 Search PubMed.
- C. Hardacre, J. D. Holbrey, P. B. McCormac, S. E. J. McMath, M. Nieuwenhuyzen and K. R. Seddon, J. Mater. Chem., 2001, 11, 346 RSC.
- C. J. Bowlas, D. W. Bruce and K. R. Seddon, Chem. Commun., 1996, 1625 RSC.
- C. M. Gordon, J. D. Holbrey, A. R. Kennedy and K. R. Seddon, J. Mater. Chem., 1998, 8, 2627 RSC.
Footnote |
| † Dedicated to Prof. Guangtian Zou on the occasion of his 80th birthday. |
| This journal is © The Royal Society of Chemistry 2017 |


