 Open Access Article
Capacitive deionization of NaCl solutions with ambient pressure dried carbon aerogel microsphere electrodes†
Xueping Quanab,
Zhibing Fub,
Lei Yuanb,
Minglong Zhongb,
Rui Mib,
Xi Yangb,
Yong Yi*a and
Chaoyang Wang *b
*b
aSchool of Materials Science and Engineering, Southwest University of Science and Technology, Mianyang, Sichuan 621000, China. E-mail: yiyong@swust.edu.cn
bResearch Center of Laser Fusion, China Academy of Engineering Physics, Mianyang 621900, China. E-mail: wangchy807@caep.cn
First published on 19th July 2017
Abstract
Carbon aerogel (CA) microspheres were pyrolyzed from resorcinol–formaldehyde (RF) organic aerogels, which were prepared by emulsion polymerization of resorcinol and formaldehyde using ambient drying technique. Structural and microstructural characteristics of CA microspheres were investigated by scanning electron microscopy (SEM), Raman spectroscopic techniques and nitrogen adsorption. The SEM images show that the resultant CA microspheres are all fine spherical without cracks. Results of Raman spectroscopy indicate that CA microspheres are mainly formed by amorphous carbon structure with a few graphite carbons. The surface area and porosity analysis prove that the CA microspheres have high specific surface area (910 m2 g−1), appropriate pore size distribution (PSD) (3–15 nm) and high ratio of mesoporosity (44%). The results of cyclic voltammetry indicate that the CA microspheres have ideal capacitive behavior, and the maximum specific capacitance values of 83 F g−1 was measured at a scan rate of 10 mV s−1 in 1 M NaCl. These parameters can significantly improve the desalination capacity for the carbon-based electrode materials in capacitive deionization (CDI). The performance of CDI is investigated by different solution concentrations (500–650 mg L−1) and applied voltages (0.8–1.4 V). With the optimum initial NaCl concentration of 500 mg L−1 and applied voltage of 1.2 V, the specific salt-adsorption capacity for CA microspheres was found to be 5.62 mg g−1. The electrosorption and electrodesorption procedures displayed the stability and regeneration of CA microsphere electrodes. This preliminary study demonstrated that the CA microsphere electrodes in CDI process can be considered to be an alternative candidate for desalination.
1. Introduction
From the last few decades, nearly a seventh of the worldwide population is currently experiencing a serious purified water shortage. To solve this problem, scientists have shown great interest in developing desalination technologies, and following this many desalination methods have been proposed. Among them, the most widely known universal technologies are thermal distillation,1 reverse osmosis (RO),2 and electrodialysis.3 However, these technologies are always energy intensive and expensive, which limit their further application. Compared with conventional processes, the process of capacitive deionization (CDI) is simple, energy-efficient, economical, safe, and clean. These advantages of the CDI process make it the best alternative process in recent years.4–6CDI is a low pressure and no membrane deionization method. In the process of electrosorption, ions can be adsorbed onto the surface of porous electrodes via the application of an electric field, to produce deionized water. Then, in the process of electrodesorption, adsorbed ions would be desorbed by reversing the voltages or removing the electric field, resulting in the regeneration of the electrodes.7 Thus, for CDI, the electrode material is the key component.
Recent efforts have mainly concentrated in novel electrode materials for the CDI process such as carbon aerogel (CA),4,5 carbon nanotubes (CNT),8 activated carbon (AC),9 ordered mesoporous carbon (OMC),10 graphene11 and their composites.12–14 Among them, the specific salt-adsorption capacity (Q) is defined as the salt adsorption amount of per gram activated material and shows the performance of CDI. The value of Q are 3.32 for CNT, 3.68 for AC, and 10.56 mg g−1 for OMC, respectively.15–17 Even though the value of OMC is high, the supra-molecular templates of synthesized OMC, such as P123 and CTAB, are often too expensive for bulk production. Accordingly, one of the most promising materials in CDI is CA because of their controllable pore structure, wide range of density variation, high electrical conductivity, relatively low cost, high surface area and great mesopore volume.18 Pekala et al.18–20 first reported organic aerogel and CA prepared in the resorcinol–formaldehyde (RF) system. Now, researchers always use monolithic CA as electrode materials in CDI.4,5,21 However, the monolithic CA is generally prepared via supercritical drying, and the drying methods demand high pressure and temperature, which restrict their development in the commercial market. Facing this dilemma, more recently, the CA microspheres have drawn more attention as they may offer an attractive alternative to monolith production.22–25
The CA microspheres are novel CA materials, which can be synthesized by emulsion polymerization of RF in a slightly basic aqueous solution via an ambient drying technology, followed by carbonizing at a high temperature under nitrogen atmosphere.24–26 There is no solvent exchange process, and hence the cost of production is low and fabrication procedure is uncomplicated as it uses the ambient drying method rather than the traditional supercritical drying. From this aspect, CA microspheres prepared by ambient drying technology pose ideal electrode materials if the pore size distribution (PSD) and available surface area can meet the demand of CDI application. Unfortunately, there have been few reports on the synthesis and properties of CA microspheres used for CDI.
Herein, we first developed CA microspheres with appropriate PSD and high available surface area for CDI via ambient drying process. The morphological and structural performances of the CA microspheres have been characterized in detail. The capacitive property of CA microsphere electrodes are further examined by deionization experiments on NaCl solution. The effect of specific salt-adsorption capacity of the CDI systems is also evaluated during the operating conditions.
2. Experimental
2.1 Preparation of CA microspheres
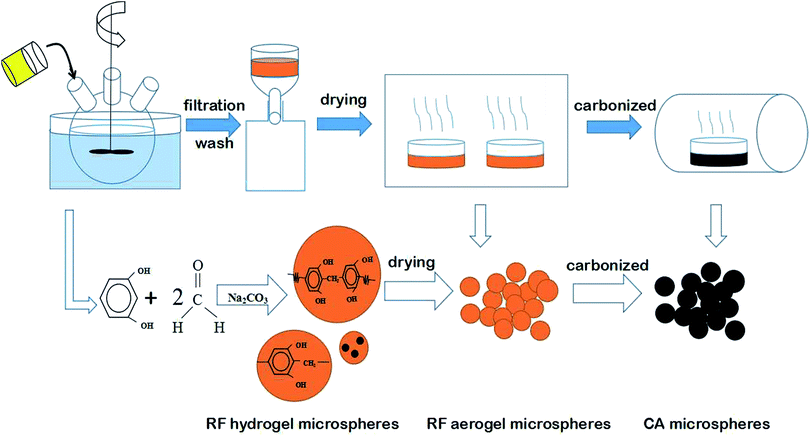
Fig. 1 shows the detailed steps in the synthesis of CA microspheres. As the first step, emulsion polymerization was conducted to synthesize the RF hydrogel microspheres. The molar ratios of resorcinol to sodium carbonate (R/C) and resorcinol to formaldehyde (R/F) were fixed at the value of 500 and 0.5, respectively. The theoretical density of the RF solution was set at 0.6 g mL−1, and distilled water was added as the diluent. Simultaneously, in a three-necked flask, 600 mL industrial white oil and 6.0 g surfactant SPAN80 were added and stirred using a mechanical stirrer at approximately 1000 rpm. Subsequently, the homogeneous RF solution was poured into the industrial white oil containing the surfactant. The solution was stirred for half an hour at 1000 rpm and then the speed of rotation was decelerated to 100 rpm. The emulsions were kept at 333 K with stirring until the dispersive RF microspheres were gelled. The synthesized RF hydrogel microspheres were separated from the industrial white oil through centrifugation and cleaned using dichloromethane. The spheres were then dried at room temperature.Finally, the CA microspheres were carbonized at 1123, 1223 and 1323 K. The results are shown in Fig. S1 and Table S1 contains the ESI,† which indicates that the optimum carbonization temperature is 1223 K. Therefore, the CA microspheres were obtained by carbonizing at 1223 K for 4 h in an inert atmosphere of nitrogen gas.
2.2 Electrode preparation
The electrodes were obtained by admixing CA microspheres, carbon black and polyvinylidene fluoride (PVDF). PVDF dissolved in N-methyl-2-pyrrolidone (NMP) was used as the binder solution. The ratio of CA microspheres, carbon black and PVDF was 7![[thin space (1/6-em)]](https://www.rsc.org/images/entities/char_2009.gif) :
:![[thin space (1/6-em)]](https://www.rsc.org/images/entities/char_2009.gif) 1
1![[thin space (1/6-em)]](https://www.rsc.org/images/entities/char_2009.gif) :
:![[thin space (1/6-em)]](https://www.rsc.org/images/entities/char_2009.gif) 2 by weight. The slurry of CA microspheres was coated uniformly using a tape coating machine on a titanium plate collector with the size of 10 × 10 cm, and the thickness of the electrode materials was 600 μm. The coated electrodes were dried at 333 K in a vacuum drying oven for 8 h. Electrodes with active material loading of 850 mg were prepared for salt removal experiments.
2 by weight. The slurry of CA microspheres was coated uniformly using a tape coating machine on a titanium plate collector with the size of 10 × 10 cm, and the thickness of the electrode materials was 600 μm. The coated electrodes were dried at 333 K in a vacuum drying oven for 8 h. Electrodes with active material loading of 850 mg were prepared for salt removal experiments.
2.3 Characterization
Scanning electron microscopy (SEM) analysis of CA microspheres was carried out to study their surface morphology (JEOL JSM 5900LV). Raman spectroscopy was performed with laser Raman spectrometer using a laser (514 nm) in the range from 1000 to 2000 cm−1 (SPEXCo., USA). Fitting of the spectra was carried out using the Origin software. The PSD and specific surface area of CA microspheres were calculated by analyzing the nitrogen adsorption–desorption isotherms. The system makes use of Brunauer–Emmett–Teller (BET) theory for determining specific surface area and Barrett–Joyner–Halenda (BJH) theory for PSD of mesopores (2–50 nm). The mesopore volume and mesopore surface area of CA microspheres were calculated using the t-plot method. The electrosorption behavior of electrodes was evaluated by cyclic voltammetry (CV) measurements in a conventional three electrode cell. The working electrode was formed with the electrode under test. Platinum electrode was used as counter electrode, and a saturated Ag/AgCl electrode was used as the reference electrode. CV were obtained in the potential range from −0.5 to +0.5 V in 1 M NaCl electrolyte.27,28 The samples were subjected to scan rates of 5, 10 and 20 mV s−1. The specific capacitance expressed in farads per gram, was evaluated using eqn (1):
 | (1) |
2.4 CDI experiments
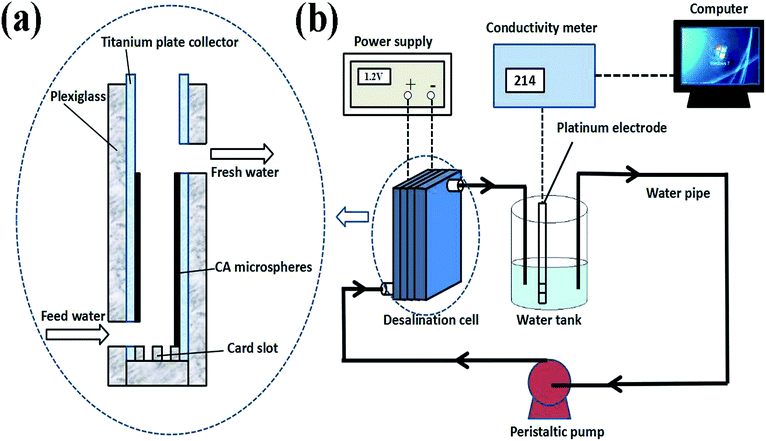
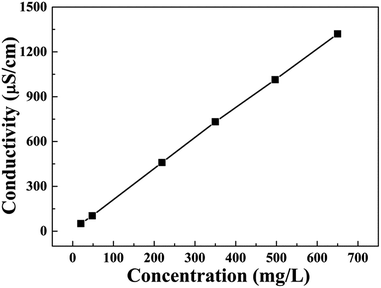
As shown in Fig. 2(b), CDI experiments were underway in a continuous circulation system including a CDI unit cell, a conductivity meter, peristaltic pump, and a stabilized voltage supply. In this system, the NaCl solution was controlled by the peristaltic pump and flowed through the CDI unit cell. The variation of conductivity of the NaCl solution was measured by the conductivity meter. In CDI unit cell, the size of the electrodes was 10 × 10 cm, and the distance between electrodes was 3–5 mm (Fig. 2(a)). In all experiments, 200 mL NaCl solution with different initial concentration was employed as feed solution with a flow rate of 100 mL min−1.The conductivity linearly increases with the increasing concentration of solution, and thus the concentration of NaCl solution was determined by measuring conductivity of the solution. The calibration curve is shown in Fig. 3. Using this calibration curve, we obtain eqn (2):
| Cond. = 12.67 + 2.02CNaCl | (2) |
 | (3) |
3. Result and discussion
3.1 SEM images of CA microspheres
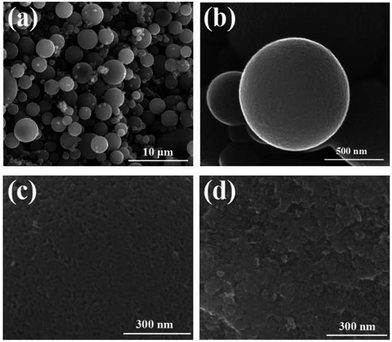
The SEM images of CA microspheres are shown in Fig. 4. It can be observed that the CA microspheres were all fine spherical and the range of diameters is 1–10 μm (Fig. 4(a)), possessing a smooth surface without cracks and impurity at high magnification (Fig. 4(b)). The resultant CA microspheres have very narrow diameter distribution, which can be attributed to the fact that the microdroplets of the RF aqueous phase are dispersed homogeneously and evenly in the process of the emulsion polymerization. As shown in Fig. 4(c), CA microspheres exhibit porous morphology, and several macropores and large mesopores can be observed at the surface of the microspheres. Fig. 4(d) shows the inner structure of CA microspheres. The CA microspheres are formed by the interconnection of carbon particles. The SEM images indicate that the CA microspheres prepared via the ambient pressure drying process have no volume shrinkage. This also shows that using 6.0 g surfactant SPAN80 and the stirring speeds of 1000 rpm, we can successfully synthesize the spherical CA microspheres by the emulsion polymerization and the ambient drying method.253.2 Raman spectra of CA microspheres
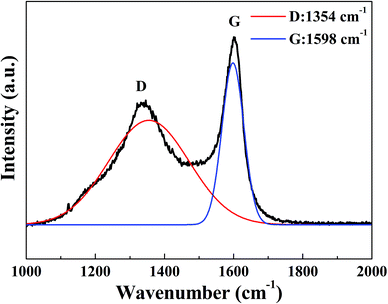
Fig. 5 shows the Raman spectrum of CA microspheres. The spectrum is subjected to peak fitting using the software Origin to resolve the curve into 2 Gaussian bands.30,31 The fitting results of the sample are given in Table 1.| D shift (cm−1) | G shift (cm−1) | Band width | ID/IG | ||
|---|---|---|---|---|---|
| ΔD (cm−1) | ΔG (cm−1) | ||||
| Value | 1354 | 1598 | 223.38 | 63.27 | 2.38 |
In Fig. 5, there were two broadened and overlapped peaks, the disorder-induced D-band and the ubiquitous G-band, which were located at 1360 and 1580 cm−1, respectively.32 Generally, the D-band is usually attributed to the lack of long-range translation symmetry in disordered carbons.33 The G-band corresponds to a tangential stretching E2g, resulting from the ‘in plane’ displacement of carbon atoms that are strongly coupled in the hexagonal sheets,32,34 which indicates that there are crystalline graphitic carbon in the CA micropheres. It was found that the D bands of CA microspheres displayed a broad shape and relatively high intensity, indicating the high content of amorphous carbon and some defects in the CA microspheres.
Herein, ID and IG represent the peak intensities of the disorder-induced D-band and the ubiquitous G-band, respectively. The in-plane microcrystalline size decreases with an increase in the ID/IG.35 The ID/IG also reflects the ratio of disordered carbon and ordered carbon in the CA. Table 1 shows that the ID/IG of CA micropheres is consistent with the ID/IG ratio of the monolithic CA prepared using supercritical drying,35 indicating that the crystal structure of CA microspheres prepared by emulsion polymerization and ambient drying technique is mainly amorphous carbon structure with a few graphite carbon.
3.3 Porous properties of CA microspheres
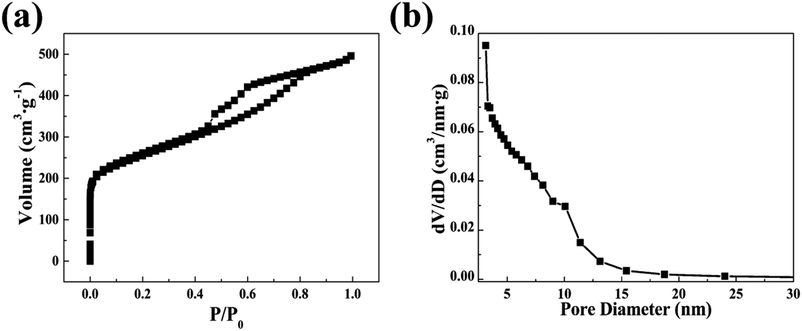
The porous attributes of CA microspheres were characterized by nitrogen sorption tests. Fig. 6 shows the N2 adsorption–desorption isotherms and the corresponding pore size distribution of CA microspheres, which were calculated using the Barrett–Joyner–Halenda method. Significant adsorption occurred on CA microspheres, and their isotherms belonged to the IV type of the IUPAC classification. There was a hysteresis loop in the curve when the pressure (P/P0) was larger than 0.4, indicating a large number of mesopores within the sample.Fig. 6(b) is the mesopore size distributions of the CA microspheres reckoned from the isotherm using the BJH method. The results in Fig. 6(b) demonstrate that the diameters of most pores are below 15 nm. The pore diameter of sample concentrates mainly on around 3.7 nm. The pore size distributions further indicate that there is a little volume shrinkage in the CA microspheres prepared via the ambient pressure drying method. More importantly, in the process of CDI experiment, the removal property often depends on the hydrated radii of the sodium ions and chloride ions. The hydrated radii of the sodium ions and chloride ions are 3.58 Å and 3.32 Å, respectively,36 which are far less than the pore size of the CA microspheres. Hence the CA microspheres satisfy the requirements of CDI.
As shown in Table 2, the BET specific surface area, the pore volume, and the average pore diameter for CA microspheres are 910 m2 g−1, 0.77 cm3 g−1, and 3.38 nm, respectively. The N2 adsorption–desorption isotherms and the pore size distribution curve suggest that the CA microspheres produced via ambient drying technique have mesoporous structure, which is similar with the monolithic CA products prepared by traditional supercritical drying. It is worth noting that for the CA microspheres, 44% of the BET specific surface area is attributed to the mesopores (2–50 nm). The high ratio of mesoporosity can significantly improve the desalination performance of the carbon-based electrode materials in CDI.31 It is clear that the synthesized CA microspheres are propitious to the application of CDI as they have appropriate PSD and high available surface area. Therefore, the CA microspheres synthesized by emulsion polymerization and ambient drying may show great CDI performance when used as electrode material.
3.4 Specific capacitance measurements
The CV curves of the CA microsphere electrodes measured at 5, 10 and 20 mV s−1 of scan rate in 1 M NaCl are displayed in Fig. 7. The profiles of curves show quasi-rectangular symmetric and reversible shape in the voltage range from −0.5 to +0.5 V. It is clearly observed that the curves are without any additional oxidation and reduction peaks, suggesting the ideal capacitive behavior. This also means that ions are adsorbed on the surface of electrodes by forming an electric double layer due to coulombic interaction rather than electrochemical reaction.37 The obtained values of specific capacitance were 83, 75, and 71 F g−1 for the scan rate of 5, 10 and 20 mV s−1, respectively. Herein, the capacitance decreases with an increase in the scan rate. This phenomenon can be explained as follows: when the scan rate is slower, ions have more time to be transported into the pores of the materials from solution; thus, the specific capacitance can be more proportional to the specific surface area. The results of the CV curves indicate that CA microspheres with a good adsorption performance may be used as good electrode materials in CDI.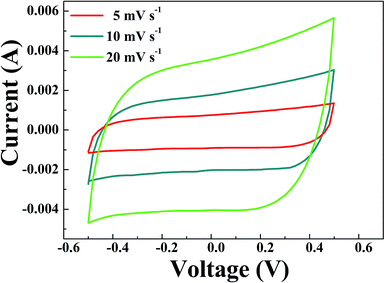 | ||
| Fig. 7 Cyclic voltammetry curves of CA microspheres electrode in 1 M NaCl solution at several sweep rates. | ||
3.5 CDI experiment
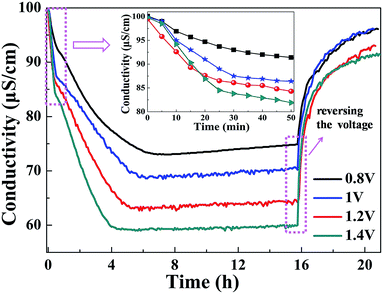
In all experiments, the solution temperature was kept at 298 K. The flow rate of the solution was controlled by the peristaltic pump at 100 mL min−1. During each experiment, the NaCl solution passed through the cell without applying voltage until the system reached equilibrium. Furthermore, an expected voltage was applied between the electrodes to reach a new equilibrium. The regeneration was achieved by discharging the cells at 0 V or by reversing the voltage of the electrodes. After that, the CDI unit was washed by deionized water, and the voltage of the CDI unit was reversed to lengthen the life of the CA microsphere electrodes. The important experimental parameters were then investigated. The solution concentration (50–650 mg L−1)38–40 and applied voltage (0.8–1.4 V) were found to have an effect on the CDI systems. Under the operation parameters, the specific salt-adsorption capacity of CA microspheres was calculated. Moreover, the regeneration performance of the electrodes was investigated.Fig. 8 indicates the conductivity variation of the NaCl solution with operating time at various applied voltages (0.8–1.4 V). When the voltage is applied on the system, the solution conductivity decreases with time, and it is said that the NaCl concentration decreases quickly. With an increase in the applied voltage, the ion removal amounts and rates increase. The specific salt-adsorption capacity drop to approximately 1.57 mg g−1, 1.81 mg g−1, 2.15 mg g−1 and 2.33 mg g−1 at 0.8 V, 1 V, 1.2 V and 1.4 V after 6 h, respectively. The adsorption can be maintained for 12 hours. After 16 h of adsorption, 95% Na+ and Cl− can be recovered by reversing the voltage. This phenomenon demonstrates that the CA microspheres used as electrode material make the CDI cell exhibit excellent regeneration performance. When the applied voltage is 1.4 V, some bubbles can be observed during the experiment. This is mainly attributed to the fact that the electrochemical decomposition potential of water is 1.23 V. When the applied voltage is larger than 1.23 V, water hydrolyzes partially to produce hydrogen and oxygen. Therefore, the optimum applied voltage for the CDI process was set at 1.2 V.
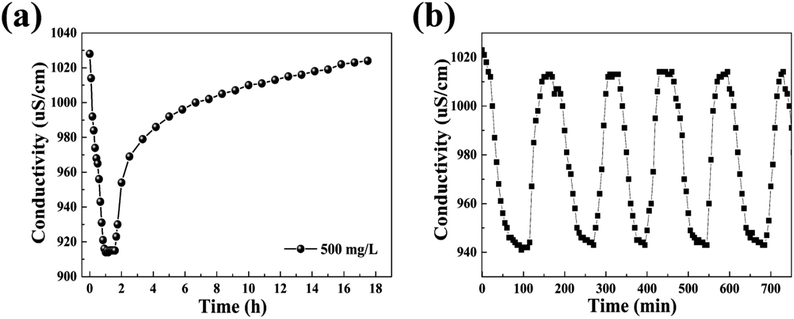
Fig. 9 shows the variation of specific salt-adsorption capacity with different solution concentrations. In the range of 50–500 mg L−1, the specific salt-adsorption capacity increases with an increase in solution concentration. Nevertheless, when the concentration is 650 mg L−1, the specific salt-adsorption capacity begins to decrease. As shown in Table 3, the specific salt-adsorption capacity is calculated from eqn (2). For the 500 mg L−1 NaCl solution, the maximum specific salt-adsorption capacity of the CDI unit system was about 5.62 mg g−1. The value is higher than those of CNT15 and AC,16 and is consistent with the reports.38 The results of the CDI test match well with the above results of nitrogen adsorption and CV test.
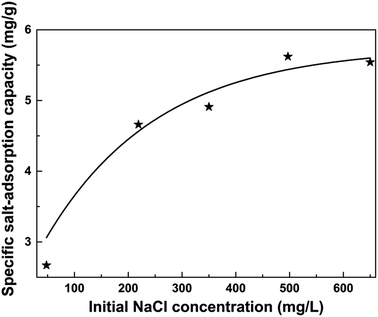 | ||
| Fig. 9 The specific salt-adsorption capacity variation of NaCl solution with the various initial NaCl concentration. | ||
| NaCl conc. (mg L−1) | Conductivity (μS cm−1) | Adsorption time (min) | Q (mg g−1) | |
|---|---|---|---|---|
| Initial | Final | |||
| 50 | 109 | 63 | 360 | 2.67 |
| 219 | 459 | 379 | 300 | 4.66 |
| 350 | 732 | 648 | 250 | 4.91 |
| 500 | 1014 | 915 | 90 | 5.62 |
| 650 | 1320 | 1225 | 70 | 5.54 |
4. Conclusion
Herein, CA microspheres are successfully fabricated via pyrolyzing RF organic aerogels, which were synthesized through emulsion polymerization of RF solution, containing sodium carbonate as a catalyst by ambient drying method. The SEM images indicate that all of the prepared CA microspheres were well spherical, possessing a smooth surface without cracks. The obtained Raman spectrum suggests that the CA microspheres prepared by emulsion polymerization and ambient drying technique are mainly formed by amorphous carbon structure with a small amount of graphite carbon. The obtained CA microspheres with average pore diameter of 3.38 nm exhibited the appropriate PSD (3–15 nm) and high available BET specific surface area (910 m2 g−1). The pore size of CA microspheres fully meets the requirements of CDI. The results of cyclic voltammetry indicate that the CA microspheres have an ideal capacitive behavior, and the maximum specific capacitance of the electrode reaches 83 F g−1 when measured at a scan rate of 10 mV s−1 in 1 M NaCl.The performances of CDI using CA microspheres as electrodes were investigated. The results indicate that the optimum applied voltage and initial NaCl concentration are 1.2 V and 500 mg L−1, respectively. Under optimum experimental parameters, the highest specific salt-adsorption capacity was found to be 5.62 mg g−1. This value is higher than the reported values for related monolithic carbon aerogels. The CA microspheres also exhibited great stability and regeneration as electrodes. This preliminary study demonstrated that the CDI process using CA microsphere electrodes can be considered to be an effective technology for desalination.
Acknowledgements
This study was financially supported by the Science and Technology Project of Sichuan Provincial (2016GZ0235).References
- A. J. Morton, I. K. Callister and N. M. Wade, Desalination, 1997, 108, 1–10 CrossRef CAS
.
- V. G. Gude, Desalin. Water Treat., 2011, 36, 239–260 CrossRef CAS
.
- L. J. Banasiak, T. W. Kruttschnitt and A. I. Schaefer, Desalination, 2007, 205, 38–46 CrossRef CAS
.
- C. J. Gabelich, T. D. Tran and I. H. Suffet, Environ. Sci. Technol., 2002, 36, 3010–3019 CrossRef CAS PubMed
.
- T. Kim and J. Yoon, RSC Adv., 2015, 5, 1456–1461 RSC
.
- R. W. Pekala, J. C. Farmer, C. T. Alviso, T. D. Tran, S. T. Mayer, J. M. Miller and B. Dunn, J. Non-Cryst. Solids, 1998, 225, 74–80 CrossRef CAS
.
- J. C. Farmer, D. V. Fix, G. V. Mack, R. W. Pekala and J. F. Poco, J. Appl. Electrochem., 1996, 26, 1007–1018 CrossRef CAS
.
- H. Li, Y. Gao, L. Pan, Y. Zhang, Y. Chen and Z. Sun, Water Res., 2008, 42, 4923–4928 CrossRef CAS PubMed
.
- L. Zou, G. Morris and D. Qi, Desalination, 2008, 225, 329–340 CrossRef CAS
.
- C. Tsouris, R. Mayes, J. Kiggans, K. Sharma, S. Yiacoumi, D. DePaoli and S. Dai, Environ. Sci. Technol., 2011, 45, 10243–10249 CrossRef CAS PubMed
.
- Z. Wang, B. Dou, L. Zheng, G. Zhang, Z. Liu and Z. Hao, Desalination, 2012, 299, 96–102 CrossRef CAS
.
- Z. Peng, D. Zhang, L. Shi and T. Yan, J. Mater. Chem., 2012, 22, 6603–6612 RSC
.
- Y. Liu, C. Nie, X. Liu, X. Xu, Z. Sun and L. Pan, RSC Adv., 2015, 5, 15205–15225 RSC
.
- D. Zhang, T. Yan, L. Shi, Z. Peng, X. Wen and J. Zhang, J. Mater. Chem., 2012, 22, 14696–14704 RSC
.
- X. Z. Wang, M. G. Li, Y. W. Chen, R. M. Cheng, S. M. Huang, L. K. Pan and Z. Sun, Electrochem. Solid-State Lett., 2006, 9, E23–E26 CrossRef CAS
.
- Y.-J. Kim and J.-H. Choi, Sep. Purif. Technol., 2010, 71, 70–75 CrossRef CAS
.
- F. Duan, Y. Li, H. Cao, Y. Xie and Y. Zhang, Desalin. Water Treat., 2014, 52, 1388–1395 CrossRef CAS
.
- R. W. Pekala, J. Mater. Sci., 1989, 24, 3221–3227 CrossRef CAS
.
- R. W. Pekala, Mater. Res. Soc. Symp. Proc., 1990, 171, 285–292 CrossRef CAS
.
- R. W. Pekala, C. T. Alviso, F. M. Kong and S. S. Hulsey, J. Non-Cryst. Solids, 1992, 145, 90–98 CrossRef CAS
.
- H.-H. Jung, S.-W. Hwang, S.-H. Hyun, L. Kang-Ho and G.-T. Kim, Desalination, 2007, 216, 377–385 CrossRef CAS
.
- C. T. Alviso, R. W. Pekala, J. Gross, X. Lu, R. Caps and J. Fricke, in Microporous and Macroporous Materials, ed. R. F. Lobo, J. S. Beck, S. L. Suib, D. R. Corbin, M. E. Davis, L. E. Iton and S. I. Zones, 1996, vol. 431, pp. 521–525 Search PubMed
.
- T. Horikawa, J. Hayashi and K. Muroyama, Carbon, 2004, 42, 169–175 CrossRef CAS
.
- N. Liu, S. Zhang, R. Fu, M. S. Dresselhaus and G. Dresselhaus, J. Appl. Polym. Sci., 2007, 104, 2849–2855 CrossRef CAS
.
- X. Wang, L. Liu, X. Wang, L. Bai, H. Wu, X. Zhang, L. Yi and Q. Chen, J. Solid State Electrochem., 2011, 15, 643–648 CrossRef CAS
.
- G. Wang, C. Pan, L. Wang, Q. Dong, C. Yu, Z. Zhao and J. Qiu, Electrochim. Acta, 2012, 69, 65–70 CrossRef CAS
.
- Z. Wang, B. Dou, L. Zheng, G. Zhang and Z. Liu, Desalination, 2012, 299, 96–102 CrossRef CAS
.
- Y. Liu, W. Ma, Z. Cheng, J. Xu, R. Wang and X. Gang, Desalination, 2013, 326, 109–114 CrossRef CAS
.
- X. Wang, X. Wang, L. Liu, L. Bai, H. An, L. Zheng and L. Yi, J. Non-Cryst. Solids, 2011, 357, 793–797 CrossRef CAS
.
- H.-B. Zhao, B.-W. Liu, X.-L. Wang, L. Chen, X.-L. Wang and Y.-Z. Wang, Polymer, 2014, 55, 2394–2403 CrossRef CAS
.
- H.-B. Zhao, Z.-B. Fu, H.-B. Chen, M.-L. Zhong and C.-Y. Wang, ACS Appl. Mater. Interfaces, 2016, 8, 1468–1477 CAS
.
- F. Tuinstra and J. L. Koenig, Bull. Am. Phys. Soc., 1970, 53(3), 1126–1130 CAS
.
- R. P. Vidano, D. B. Fischbach, L. J. Willis and T. M. Loehr, Solid State Commun., 1981, 39, 341–344 CrossRef CAS
.
- A. Cuesta, P. Dhamelincourt, J. Laureyns, A. Martinezalonso and J. M. D. Tascon, Carbon, 1994, 32, 1523–1532 CrossRef CAS
.
- A. C. Ferrari and J. Robertson, Phys. Rev. B: Condens. Matter Mater. Phys., 2000, 61, 14095–14107 CrossRef CAS
.
- C.-L. Yeh, H.-C. Hsi, K.-C. Li and C.-H. Hou, Desalination, 2015, 367, 60–68 CrossRef CAS
.
- M. W. Ryoo, J. H. Kim and G. Seo, J. Colloid Interface Sci., 2003, 264, 414–419 CrossRef CAS PubMed
.
- D. K. Kohli, R. Singh, A. Singh, S. Bhartiya, M. K. Singh and P. K. Gupta, Desalin. Water Treat., 2015, 54, 2825–2831 CrossRef CAS
.
- H.-H. Jung, S.-W. Hwang, S.-H. Hyun, L. Kang-Ho and G.-T. Kim, Desalination, 2007, 216, 377–385 CrossRef CAS
.
- L. Zou, G. Morris and D. Qi, Desalination, 2008, 225, 329–340 CrossRef CAS
.
Footnote |
| † Electronic supplementary information (ESI) available: Adsorption isotherms and PSD of CA microspheres under different carbonized temperatures; surface area characteristic of CA microspheres under different carbonized temperatures. See DOI: 10.1039/c7ra05226j |
| This journal is © The Royal Society of Chemistry 2017 |

