 Open Access Article
Creative Commons Attribution 3.0 Unported Licence
Production of acetic acid from ethanol over CuCr catalysts via dehydrogenation-(aldehyde–water shift) reaction
Ning Xiang ,
Peng Xu,
Nianbo Ran and
Tongqi Ye*
School of Chemistry and Chemical Engineering, Hefei University of Technology, Xuancheng, Anhui 242000, PR China. E-mail: yetq@hfut.edu.cn; Tel: +86-563-3831065
First published on 7th August 2017
Abstract
A series of CuCr catalysts were prepared by co-precipitation method and used to produce acetic acid from ethanol via dehydrogenation-(aldehyde–water shift) reaction. The catalysts were characterized by X-ray diffraction (XRD), X-ray photoelectron spectroscopy (XPS), Brunauer–Emmett–Teller analysis (BET), inductively coupled plasma atomic emission spectroscopy (ICP-AES), and temperature programmed reduction (TPR). The effects of copper contents and atmosphere on catalytic performance were investigated. The enhanced catalytic performance can be ascribed to the existence of chromium oxide. A possible mechanism for the production of acetic acid from ethanol without oxidant was also proposed.
Introduction
Nowadays, the outlook and motivation towards the conversion of renewable biomass to fuels and commodity chemicals is growing due to the diminishing petroleum resources and global warming problems.1 Bio-ethanol is one of the most widely discussed options: it could provide alternative routes to produce chemicals, such as acetaldehyde, acetic acid, ethylene oxide and ethyl acetate, which are currently produced from ethane, ethene, or methanol.2 As one of the most promising approaches, catalytic oxidation of ethanol to acetic acid has been widely studied in recent decades.A number of heterogeneous catalysts have been reported for the conversion of ethanol to acetic acid in gas phase, such as Mo0.61V0.31Nb0.08Ox/TiO2,3 MoV0.3Nb0.12Te0.23Ox,4 V2O5/TiO2,5–7 Mo–CeOx/SnO2,8 etc. On the other hand in liquid phase oxidation, catalysts mainly consist of noble metal compounds have also been investigated, such as Au/MgAl2O4,9,10 Au/Ni0.95Cu0.05Ox,11 RuOx/CeO2,12 Ru(OH)x/CeO2,13 etc. Most of these catalysts use O2 as oxidant, whether pure oxygen or air. As Scheme 1 shows, oxidation of ethanol to acetic acid generally proceeds in two steps. Ethanol is firstly oxidized to acetaldehyde and the acetaldehyde is then oxidized to acetic acid. This reaction is considered as a green catalytic process for the only reduction product is water.14 However, safety is one of the major issues concerning O2-based oxidation process, in relation to flammability limits and explosion hazards.15
In fact, other than O2, water can also influence or take part in the process of conversion ethanol to acetic acid. P. R. S. Medeiros et al. studied the role of water in ethanol oxidation over SnO2-supported molybdenum oxides, showing that the presence of water in the stream decreased ethanol conversion but increased selectivity to acetic acid.8 While M. M. Rahman et al. reported that the water promoted the secondary acetaldehyde oxidation to acetic acid conversion over ZnO catalyst and inhibited the acetaldehyde aldol-condensation to crotonaldehyde.16 When O2 is nonexistence in the reaction system, ethanol is dehydrogenated to produce acetaldehyde, and then water, acting as the oxidizer, reacts with acetaldehyde to produce acetic acid, concomitantly releasing hydrogen gas.17–19 As Scheme 2 shows, the latter one is also named “aldehyde–water shift” reaction (AWS).
A number of homogeneous catalysts employing noble metal species have been used to the AWS reaction. Based on the study of the dehydrogenation of alcohols to carboxylic acids, Milstein and Grützmacher et al. proposed the AWS was an intermediate reaction step involving dehydrogenation of a hydrated aldehyde (geminal-diol).20,21 Recently, Heinekey et al. reported that a series of (p-cymene) ruthenium(II) diamine complexes and π-arene (or cyclopentadienyl) complexes of iridium, rhodium, and ruthenium were shown to be active catalysts for the conversion of aldehydes and water to carboxylic acids.17,18 However, all these homogeneous reaction systems have the obvious disadvantages on the separation of products and the recycling of catalyst. Thus a more attractive process for industrial application would be heterogeneous reaction system especially over the base metal catalysts, because of the convenience of catalyst separation, facile continuous process operation and cost effectiveness. We noticed that some patents were related to the production of acetic acid from ethanol via dehydrogenation-AWS reaction,22,23 but none of them studied the catalytic mechanism of this process.
It is well known that the copper based catalysts are active for dehydrogenation of alcohols to produce correspondence aldehydes.24 According to Colley, ethanol dissociated on the Cu component to form ethoxy species, and then ethoxy species were dehydrogenated to acetyl species.25 Work by Jiang on the dehydrogenation of ethanol to ethyl acetate on CuCr catalyst proposed that the Cu0 species played an important role in ethanol dehydrogenation to acetaldehyde, while the Lewis acidic site on Cr2O3 phase might be responsible for the desorption of product ethyl acetate from CuCr catalyst's surface.
In this paper, an attempt to develop CuCr catalyst for ethanol dehydrogenation along with AWS reaction to produce acetic acid was given. Catalysts were characterized by various techniques including BET, ICP-AES, XRD, XPS, H2-TPR and N2O chemisorption. The relationship between the composition of the CuCr catalysts and catalytic performance were also discussed.
Experimental
Catalyst preparation
The CuCr catalysts with various Cu contents (calculated by CuO of 100 wt%, 70 wt%, 50 wt%, 30 wt%, 0 wt%) were prepared by co-precipitation method using respective metal nitrates solutions as precursors and Na2CO3 solution as precipitator. Sodium carbonate was added dropwise to the stirred aqueous solutions of mixtures of Cu2+ and/or Cr3+ nitrates at 343 K until pH 7 was reached. The precipitate was aged at 343 K in the mother liquor for 2 h, and then it was washed thoroughly with deionized water and dried in air at 393 K for 12 h. The formed CuCr mixed hydroxides were thereafter calcined at 623 K for 4 h in air to obtain the corresponding mixed oxide catalysts. The latter ones were finally made into granules with 40–60 mesh sizes.Catalyst characterization
An ICP-AES (Optima 7300 DV, Perkin Elmer, Korea) was used for the determination of Cu element content in calcined catalysts. Brief operation conditions and optics of the ICP-AES used in the present study are as follows: axial mode plasma: 15 L min−1, auxiliary: 0.2 L min−1, nebulizer: 0.65 L min−1, RF powder: 1300 W, flow rate: 1.5 mL min−1. Cu element was measured in the radial mode of the ICP-AES.Nitrogen adsorption experiments for pore size distribution, pore volume, and surface area measurements were conducted on a COULTER SA 3100 analyser. All samples were calcined at 673 K under vacuum before the measurements. The X-ray diffraction (XRD) was measured on an X'pert Pro Philips diffractometer with a CuKα radiation (λ = 0.154 nm). The measurement conditions were in the range of 2θ = 5–80°, step counting time 5 s, and step size 0.017° at 298 K. The surface elements and their states were analysed by X-ray photoelectron spectroscopy (XPS). The XPS measurements were performed on an ESCALAB-250 (Thermo-VG Scientific, USA) spectrometer with AlKα (1486.6 eV) irradiation source.
The reducibility of the calcined catalysts was determined by temperature programmed reduction (TPR) with a heating rate of 10 K min−1 to 823 K under a flowing atmosphere of 10 vol% H2/Ar. The copper dispersions and particle sizes were determined by the dissociative N2O adsorption method. The experiments were performed using the same apparatus as for the TPR measurements. The catalysts were first reduced at 623 K under 10 vol% H2/Ar for 2 h. After cooling to 333 K in a He flow, the reduced samples were exposed to a N2O flow for 0.5 h at 333 K. Finally, the re-oxidized samples were cooled to room temperature to start another TPR run with 10 vol% H2/Ar at a ramping rate of 10 K min−1 to 773 K. The average copper particle size and dispersion were calculated by assuming 1.4 × 10¹⁹ copper atoms per m2 and a molar stoichiometry N2O/Cus = 0.5,26 where the symbol Cus means the copper atoms on the surface. The dispersion of copper was calculated by the following equation:
Catalytic test
The “free-oxygen” conversion of ethanol to acetic acid was carried out in the continuous flow systems, using a quartz fixed-bed reactor under atmospheric pressure. In a typical experiment, 1 g of the catalyst diluted with an equal amount of quartz grains was introduced into the reactor. The catalyst bed was packed with quartz grains, which serve as the preheated zone. Prior to the reaction, the catalysts were pre-reduced by H2 stream at 623 K for 3 h. The liquid feed consisting of 25 wt% of ethanol and water mixer was fed into the reactor using a syringe pump during the reaction. High purity Ar (99.999%) was used as carrier gas in the experiments, keeping constant flow rate by using mass flow controllers. The products were analysed by gas chromatography equipped with a flame ionization detector (FID) connected to a PEG-20M capillary column (for the liquid products) and a TCD connected to a Porapak Q packed column (for the gas products).Results and discussion
Results of characterization
As shown in Table 1, the Cu contents in the catalysts analysed by ICP-AES are in correspondence with the feed ratio. Some other important properties of fresh catalysts, such as BET surface areas, Cu dispersions and particle sizes are listed in Table 1. Compared to the pure copper and chromium of Cu100 and Cu0, the hybrid of the two components gives much higher BET surface areas and Cu dispersion. The Cu70 shows maximal BET surface area and pore volume among the mixed metal oxides. With the increase of Cr content, it decreases from 42.8 to 26.4 m2 g−1 and 0.237 to 0.120 cm3 g−1 respectively. However, the Cu50 gives the largest pore size and Cu dispersion.| Sample | Cua (wt%) | SBET (m2 g−1) | Vp (cm3 g−1) | Dp (nm) | Dispersionb (%) | dCuc (nm) |
|---|---|---|---|---|---|---|
| a CuO content (wt%) measured by ICP-AES.b Cu dispersion calculated by N2O desorption.c Cu particle size for used catalysts calculated by Debye–Scherrer equation. | ||||||
| Cu100 | 99.9 | 4.0 | 0.021 | 20.6 | 1.6 | 23.0 |
| Cu70 | 68.7 | 42.8 | 0.237 | 22.1 | 10.1 | 16.1 |
| Cu50 | 52.1 | 32.1 | 0.203 | 23.0 | 17.5 | 17.0 |
| Cu30 | 33.3 | 26.4 | 0.120 | 18.0 | 15.7 | 15.0 |
| Cu0 | 0 | 3.5 | 0.012 | 14.1 | — | — |
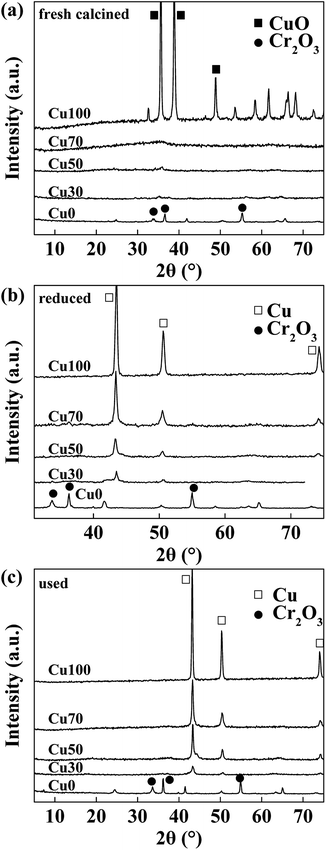
Fig. 1a shows the XRD patterns of the fresh calcined catalysts with various Cu contents. Diffraction peaks of CuO and Cr2O3 are obviously observed in Cu100 and Cu0 respectively. However, they are not shown in the mixed oxide catalysts of Cu70, Cu50 and Cu30, indicating good dispersion in these hybrid samples. After reduction and 8 hours' catalytic reaction, as Fig. 1b and c shows, diffraction peaks of Cu are obviously found on the samples of Cu100, Cu70, Cu50 and Cu30 with declining intensity, which is well corresponding to the Cu content of the four catalysts. However, the Cu0 catalyst keeps the same due to a higher reduction temperature of Cr2O3. The average particle size of Cu0 on the used catalysts are calculated by Debye–Scherrer equation and shown in the Table 1. Results show the average particle sizes are similar and in the range of 15.0 to 17.0 nm, except for the pure copper sample shows a much larger particle size of 23.0 nm.
The reduction behaviour of the catalysts with various Cu contents is studied by H2-TPR characterization and the respective profiles are shown in Fig. 2a. The reduction peaks in all the samples are assigned to the reduction of copper species for the chromic oxide is hard to be reduced. Considering of the Cu70 sample, the mix with chromium decreases the reduction temperature of copper species for the dispersing effect. However, further increase of Cr content is not good for the reduction of Cu species. With the increase of Cr content, the reduction temperature increases gradually. Furthermore, different with others, the Cu70 sample shows two separate reduction peaks centred at 508 K and 521 K respectively. Some authors reported the two hydrogen consumption processes resulted from the two steps of CuO reduction (CuO to Cu2O and Cu2O to Cu),27–29 some others proposed that the two hydrogen consumption processes revealed the presence of different CuO species.30 To confirm that, the reduction behaviour of Cu2O is studied by H2-TPR characterization and the respective profiles are shown in Fig. 2b. The catalysts are reduced at 623 K for 2 h and treated with N2O for another 0.5 h after cooling down to 323 K. After that, H2-TPR characterization is performed. Similar to the TPR profile of pristine catalyst, the N2O treated Cu70 sample also shows two separate reduction peaks that shift to lower temperatures of 398 K and 417 K. However, other catalysts show only one peak just like their pristine samples. The results indicate the two hydrogen consumption processes for the Cu70 sample are corresponding to two kinds of Cu species, rather than the two steps of CuO reduction (CuO to Cu2O and Cu2O to Cu). Compare the peak shape with Cu100 sample; we would like attribute the lower reduction peak to the reduction of CuCr mixed oxide on the surface, while the other to the reduction of CuO.
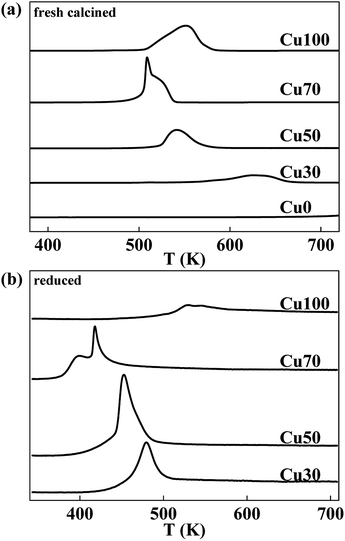 | ||
| Fig. 2 Typical H2-TPR profiles of CuCr catalysts: (a) fresh calcined catalysts and (b) reduced catalysts that treated with N2O. | ||
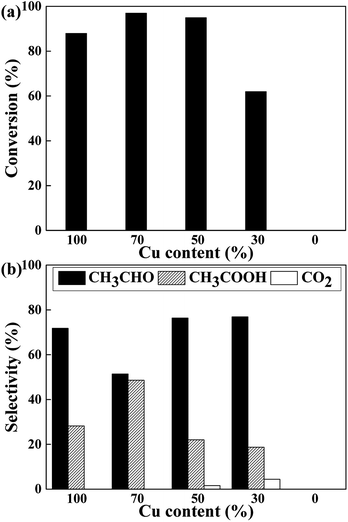
The catalytic performance of CuCr catalysts on conversion of ethanol to acetic acid without oxidant is investigated. Before reaction, the catalysts are pre-reduced at 623 K for 3 h by hydrogen. Then the ethanol solution is preheated and injected under argon atmosphere. For there is no oxidant in the reaction system, we speculate the conversion of ethanol to acetic acid should consists of two steps. The first is dehydrogenation of ethanol to acetaldehyde, and the second is the reaction of acetaldehyde with water which named “aldehyde–water shift” (AWS) reaction to acetic acid.17,18 As the reaction results of Fig. 3 shows, pure Cr2O3 exhibits none of catalytic activity which indicates at least the first step of dehydrogenation can only proceed on copper species. As expected, all of the Cu-containing catalysts exhibited high activity with the ethanol conversion ranging from 62% to 97%.
From the perspective of selectivity, Cu70 catalyst is the best one which shows highest acetic acid selectivity of 48.6%. Furthermore, some deep oxidation product of CO2 appears on the Cu50 and Cu30 catalysts.
The ethanol dehydrogenation on heterogeneous catalysts is a well-researched process. Ethanol is firstly adsorbed as ethoxy and the adsorbed ethoxy species could easily dehydrogenated to form acetyl species via aldehyde.25 Then the acetyl species combine with another ethoxy species to produce adsorbed ethyl acetate which then desorbed. However, when water is in the reaction system, it will compete with ethanol and some other adsorbed species for the same catalytic sites, thus inhibits bridging carboxylates and in favour of form acetic acid.8 Orozco et al. carefully investigated the role of water in the oxidation of aldehyde to carboxylic acid use ZrO2 and CeO2 as model catalysts.31–33 Surface hydroxyl group (from water adsorption and decomposition) could combine with adsorbed aldehyde to form aldehyde hydrate, which then is able to transfer a hydride species and further form molecular hydrogen. Meanwhile, with a surface proton derived from the initial water adsorption, carboxylic acid product can be formed. Different with ZrO2 and CeO2 catalysts, the further ketonization of carboxylic acids is suppressed on the CuCr catalysts thus carboxylic acid is the main product.
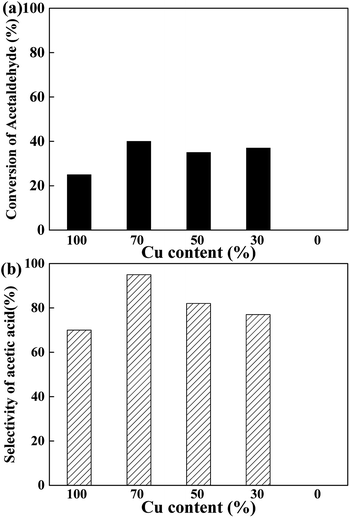
To elucidate the active site for the AWS reaction on the CuCr catalysts, the acetaldehyde solution was pumped into the reactor under the same conditions with above experiments. As the results shown in Fig. 4, no acetaldehyde conversion was detected on the pure Cr2O3 which indicates the step of AWS reaction also performed only on surface Cu species. Interestingly, none of the catalysts exhibited more than 50% of acetaldehyde conversion. We speculate that the abundant surface proton (from water adsorption and decomposition) competed with aldehyde and adsorbed acetyl species for the same catalytic sites, thus hindered the reaction between aldehyde and hydroxyl group, led to a rather low aldehyde conversion.
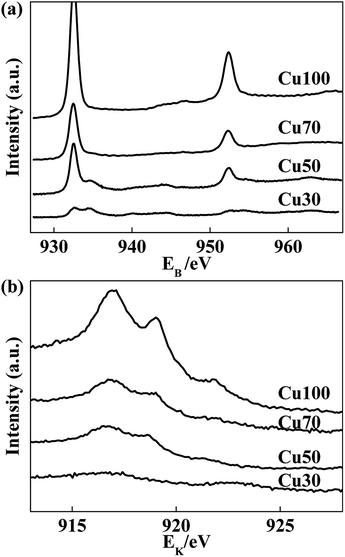
Considering of the decisive role of surface elemental compositions in catalytic performance, we have taken XPS analysis on the Cu-containing catalysts to investigate the relationship between surface compositions and catalytic performance. The XPS spectra of used catalysts are shown in Fig. 5. The peak at 932.5 eV can correspond to Cu0 and/or Cu+, because both spectra are identical within 0.2 eV range. Nonetheless, the spectra of the Cu LMM Auger peaks shown by Fig. 5b indicate the coexistence of Cu0 and Cu+ species for all samples.34,35 However, the peak at 933.8 eV which assigned to Cu2+ (2p3/2) is observed for used Cu50 and Cu30 catalysts. It manifests that the surface copper species get more stable at a relatively higher valence state with the increase of Cr and decrease of Cu contents in the catalysts. The high valence of Cu2+ induces deep oxidation of ethanol and generation of CO2, steam reforming reaction may occur.
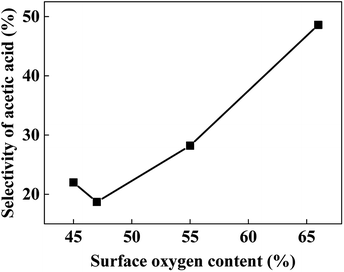
The surface elemental compositions of fresh and used catalysts are listed in Table 2. With the decrease of Cu content, the surface Cu content decreases as expected. And with the increase of Cr content, the surface metal compositions ((Cu + Cr)%) decreases gradually, but much more carbon is detected on the surface, especially for the used samples. However, Cu70 catalyst has a comparatively higher surface oxygen content, leading to more chance of aldehyde react with hydroxyl group, thus the better selectivity of acetic acid (Fig. 3b). As Fig. 6 shows, there is nearly a linear relationship between the selectivity of acetic acid and surface oxygen content.
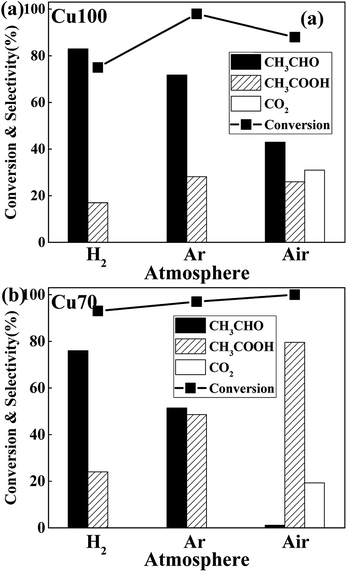
The influence of redox atmosphere is also investigated on the pure Cu and Cu70 catalysts. Three representative gases have been studied: hydrogen (reductive), argon (inert) and air (oxidative). As can be seen from Fig. 7, all catalytic tests show high ethanol conversion over 75%, even under atmosphere of H2. It indicates that the dehydrogenation of ethanol on Cu is little affected by atmosphere. The atmosphere mainly influences the latter AWS reaction and shows rather different selectivity preference. Take catalytic test of Cu70 as an example, the selectivity of acetic acid is 48% under inert argon, while 24% under reducing H2. It manifests that the hydrogen gas suppresses the bonding of adsorbed aldehyde with oxygen species. On the contrary, the selectivity of acetic acid in air reaches 79.5%. The main reason for this phenomenon is ascribed to the consumption of adsorbed hydrogen on catalyst surface by oxygen gas. Therefore, the concentration of surface oxygen species is enhanced. However, over-oxidation of ethanol is obviously a disadvantage in oxidative atmosphere, which liberates undesirable product: carbon dioxide. Especially on the Cu100 catalyst, the CO2 selectivity even reached to 31% under oxidative atmosphere.
To evaluate the stability of the catalysts, performance variation of best chosen Cu70 catalyst with time on stream was conducted at 623 K in Ar atmosphere, and the results are shown in Fig. 8. As can be seen, the catalytic activity did not change obviously in the earlier stage but declined fast after 8 h reaction. The selectivity of acetic acid was continuous declined along with the acetaldehyde selectivity arised gradually. TG analysis method was used to evaluate the influence of carbon deposition on the catalytic performance. However, almost no carbon was detected. Although aldehyde as a product in the reaction system, the high content of water suppressed the aldol condensation to form carbon deposition. Thus the sintering of Cu particles may play an important role in the catalyst deactivation.36,37 As the XRD results show above, the Cu particle size increased from undetectable level to about 16 nm after 8 h reaction. Results show that the catalyst stability needs improve in our future work.
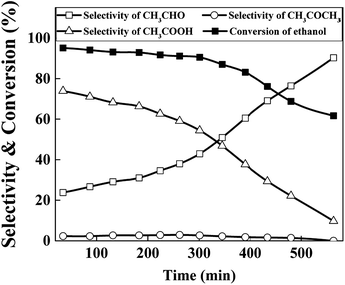 | ||
| Fig. 8 Stability tests of Cu70 catalyst (reaction conditions: catalyst loading = 1 g, T = 623 K, reactant: 25 wt% ethanol solution, total flow rate = 2 mL h−1). | ||
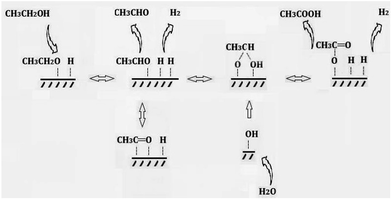
In summary, a possible mechanism for the production of acetic acid from ethanol without oxidant is shown in Scheme 3. Ethanol is firstly adsorbed on the Cu component as ethoxy species. Subsequently, the latter one is dehydrogenated to produce adsorbed acetaldehyde. At the same time, water is adsorbed onto the catalyst surface and dissociates to form same amount of H proton and hydroxyl group. The adsorbed acetaldehyde either desorbed to gas phase or react with hydroxyl group and further to produce acetic acid. While the adsorbed H proton combine with each other and evolve as molecular hydrogen. The aldol condensation of aldehyde and ketonization of acetic acid are all ignorable in this reaction system.
Conclusions
The production of acetic acid from ethanol was performed on a series of CuCr catalysts with different Cu contents. The reaction is carried out via two steps. First, ethanol is dehydrogenated to produce aldehyde species. Second, the adsorbed aldehyde reacts with hydroxyl group and further produce acetic acid. Both steps are catalysed by the Cu0 and/or Cu+ species. The existence of chromium oxide raises the concentration of surface oxygen species, thus the selectivity of acetic acid is also improved. On the other hand, high contents of Cr lead to stabilized Cu2+ on the catalyst surface and produce the excessive oxidation product of carbon dioxide. The reactions are mainly occurred on the Cu component of the catalyst, the chromium component has a positive effect on catalytic performance. The microscopic reaction mechanism will be further studied in our future work.Acknowledgements
The project was supported by the National Natural Science Foundation of China (21406045), the Natural Science Foundation of Anhui Province (1508085QB46) and the Fundamental Research Funds for the Central Universities (JZ2017HGTB0231).References
- A. Corma, S. Iborra and A. Velty, Chem. Rev., 2007, 107, 2411–2502 CrossRef CAS PubMed
.
- T. Takei, N. Iguchi and M. Haruta, Catal. Surv. Asia, 2011, 15, 80–88 CrossRef CAS
.
- X. B. Li and E. Iglesia, Chem.–Eur. J., 2007, 13, 9324–9330 CrossRef CAS PubMed
.
- V. I. Sobolev and K. Y. Koltunov, ChemCatChem, 2011, 3, 1143–1145 CrossRef CAS
.
- B. Jørgensen, S. B. Kristensen, A. J. Kunov-Kruse, R. Fehrmann, C. H. Christensen and A. Riisager, Top. Catal., 2009, 52, 253–257 CrossRef
.
- V. V. Kaichev, Y. A. Chesalov, A. A. Saraev, A. Y. Klyushin, A. Knop-Gericke, T. V. Andrushkevich and V. I. Bukhtiyarov, J. Catal., 2016, 338, 82–93 CrossRef CAS
.
- V. I. Sobolev, E. V. Danilevich and K. Y. Koltunov, Kinet. Catal., 2013, 54, 730–734 CrossRef CAS
.
- P. R. S. Medeiros, J. G. Eon and L. G. Appel, Catal. Lett., 2000, 69, 79–82 CrossRef CAS
.
- B. Jorgensen, S. Egholmchristiansen, M. Dahlthomsen and C. Christensen, J. Catal., 2007, 251, 332–337 CrossRef CAS
.
- C. H. Christensen, B. Jørgensen, J. Rass-Hansen, K. Egeblad, R. Madsen, S. K. Klitgaard, S. M. Hansen, M. R. Hansen, H. C. Andersen and A. Riisager, Angew. Chem., Int. Ed., 2006, 45, 4648–4651 CrossRef CAS PubMed
.
- T. Takei, J. Suenaga, T. Ishida and M. Haruta, Top. Catal., 2015, 58, 295–301 CrossRef CAS
.
- A. B. Laursen, Y. Y. Gorbanev, F. Cavalca, P. Malacrida, A. Kleiman-Schwarsctein, S. Kegnæs, A. Riisager, I. Chorkendorff and S. Dahl, Appl. Catal., A, 2012, 433–434, 243–250 CrossRef CAS
.
- Y. Y. Gorbanev, S. Kegnæs, C. W. Hanning, T. W. Hansen and A. Riisager, ACS Catal., 2012, 2, 604–612 CrossRef CAS
.
- S. K. Klitgaard, A. T. DeLa Riva, S. Helveg, R. M. Werchmeister and C. H. Christensen, Catal. Lett., 2008, 126, 213–217 CrossRef CAS
.
- F. Liguori, C. Moreno-Marrodan, P. Barbaro and H. Sawa, Appl. Catal., A, 2017, 530, 217–225 CrossRef CAS
.
- M. M. Rahman, S. D. Davidson, J. Sun and Y. Wang, Top. Catal., 2016, 59, 37–45 CrossRef
.
- T. P. Brewster, W. C. Ou, J. C. Tran, K. I. Goldberg, S. K. Hanson, T. R. Cundari and D. M. Heinekey, ACS Catal., 2014, 4, 3034–3038 CrossRef CAS
.
- T. P. Brewster, J. M. Goldberg, J. C. Tran, D. M. Heinekey and K. I. Goldberg, ACS Catal., 2016, 6, 6302–6305 CrossRef CAS
.
- W. C. Ou and T. R. Cundari, ACS Catal., 2015, 5, 225–232 CrossRef CAS
.
- T. Zweifel, J.-V. Naubron and H. Grützmacher, Angew. Chem., Int. Ed., 2009, 48, 559–563 CrossRef CAS PubMed
.
- E. Balaraman, E. Khaskin, G. Leitus and D. Milstein, Nat. Chem., 2013, 5, 122–125 CrossRef CAS PubMed
.
- C. H. Christensen, N. C. Schiødt and B. Voss, US Pat., 2010130776A1, 2010
.
- H. Iijima, S. Matsuhira, Y. Mita, T. Nakajo and K. I. Sano, EP Pat., 0022358, 1981
.
- J. Shan, N. Janvelyan, H. Li, J. Liu, T. M. Egle, J. Ye, M. M. Biener, J. Biener, C. M. Friend and M. Flytzani-Stephanopoulos, Appl. Catal., B, 2017, 205, 541–550 CrossRef CAS
.
- S. W. Colley, J. Tabatabaei, K. C. Waugh and M. A. Wood, J. Catal., 2005, 236, 21–33 CrossRef CAS
.
- S. Xia, R. Nie, X. Lu, L. Wang, P. Chen and Z. Hou, J. Catal., 2012, 296, 1–11 CrossRef CAS
.
- C. Yao, L. Wang, Y. Liu, G. Wu, Y. Cao, W. Dai, H. He and K. Fan, Appl. Catal., A, 2006, 297, 151–158 CrossRef CAS
.
- A. Szizybalski, F. Girgsdies, A. Rabis, Y. Wang, M. Niederberger and T. Ressler, J. Catal., 2005, 233, 297–307 CrossRef CAS
.
- J. P. Breen and J. R. H. Ross, Catal. Today, 1999, 51, 521–533 CrossRef CAS
.
- M. Turco, G. Bagnasco, C. Cammarano, P. Senese, U. Costantino and M. Sisani, Appl. Catal., B, 2007, 77, 46–57 CrossRef CAS
.
- L. M. Orozco, M. Renz and A. Corma, Green Chem., 2017, 19, 1555–1569 RSC
.
- L. M. Orozco, M. Renz and A. Corma, ChemSusChem, 2016, 9, 2430–2442 CrossRef CAS PubMed
.
- A. Pulido, B. Oliver-Tomas, M. Renz, M. Boronat and A. Corma, ChemSusChem, 2013, 6, 141–151 CrossRef CAS PubMed
.
- J. P. Tobin, W. Hirschwald and J. Cunningham, Appl. Surf. Sci., 1983, 16, 441–452 CrossRef CAS
.
- M. T. Anthony and M. P. Seah, Surf. Interface Anal., 1984, 6, 95–106 CrossRef CAS
.
- Y. Luan, H. Xu, C. Yu, W. Li and S. Hou, Catal. Lett., 2008, 125, 271–276 CrossRef CAS
.
- K. Tohji, T. Mizushima, Y. Udagawa and A. Ueno, J. Phys. Chem., 1985, 89, 5671–5676 CrossRef CAS
.
| This journal is © The Royal Society of Chemistry 2017 |


