 Open Access Article
Creative Commons Attribution 3.0 Unported Licence
Nitrogen-rich green leaves of papaya and Coccinia grandis as precursors of activated carbon and their electrochemical properties
Paweena Dulyaseree ab,
Masatsugu Fujishigeb,
Ichiro Yoshidab,
Yumiko Toyab,
Yasuo Banbab,
Yu-suke Tanakac,
Takaaki Aoyamac,
Mayuree Phonyiema,
Winadda Wongwiriyapan
 *a,
Kenji Takeuchi*b and
Morinobu Endob
aCollege of Nanotechnology, King Mongkut's Institute of Technology Ladkrabang, Chalongkrung Road, Ladkrabang, Bangkok 10520, Thailand. E-mail: winadda.wo@kmitl.ac.th
bInstitute of Carbon Science and Technology, Shinshu University, 4-17-1 Wakasato, Nagano, 380-8553, Japan. E-mail: takeuchi@endomoribu.shinshu-u.ac.jp
cInterdisciplinary Graduate School of Science and Technology, Shinshu University, 4-17-1 Wakasato, Nagano, 380-8553, Japan
First published on 30th August 2017
Abstract
Activated carbon (AC) was synthesized from papaya and Coccinia grandis leaves (PL-AC and CL-AC, respectively) which are nitrogen-rich precursors and their electrochemical properties were investigated. The synthesis process included carbonization at 400 °C, impurity removal by H2SO4 cleaning, and post activation by NaOH at 720 °C. Surpassing the conventional bamboo-derived AC (B-AC), PL- and CL-ACs show relatively high surface areas of 2664 and 2576 m2 g−1, respectively. Moreover, the nitrogen contents in the PL- and CL-ACs were approximately 2.3 and 1.8 at%, respectively. Furthermore, the electrochemical properties of the synthesized PL- and CL-ACs were investigated using both aqueous and organic electrolytes. The specific capacitances of the PL- and CL-ACs were 98.47 and 89.91 F g−1, respectively, in Na2SO4 electrolyte. Especially, compared to the B-AC, the PL-AC shows a dramatic decrease in series resistances (RS) from 1.33 to 0.53 Ω and charge transfer resistances (RCT) from 25.83 to 9.00 Ω. The decrease of RS and RCT is attributed to the existence of nitrogen in the PL-AC, resulting in a higher conductivity of electrode material and an enhancement of the charge transfer between electrode material and electrolyte. The large surface area of the PL- and CL-ACs was successfully achieved without detriment to the electrical conductivity. These results suggest that nitrogen-rich PL and CL are potential precursors for the synthesis of nitrogen-doped AC in a one-step process, which can be used as an alternative electrode material for electrochemical capacitors and can potentially be applied for large-scale industrial production with low cost.
1. Introduction
Agriculture has long been the mainstay of the Thai economy, with abundant natural resources, and the majority of the Thai population engages in agricultural practices. The total area of Thailand is approximately 513![[thin space (1/6-em)]](https://www.rsc.org/images/entities/char_2009.gif) 000 km2 and 46% of this is used for agricultural purposes. After harvesting, there is a large amount of agricultural waste left. Thus, it is strongly desired to reduce the amount of agricultural waste and investigate the potential to maximize its uses. Agricultural waste can be used as feed for livestock, biomass energy, and raw material for activated carbon (AC) production. For use in AC, the raw materials are currently dominated by trunk, branch, shell, and seed of plants which are mainly composed of cellulose, lignin and hemicellulose.1–7 The obtained AC exhibits a high content of carbon with high surface area and high porosity. These ACs can be used in a wide application such as gas purification, metal extraction, water purification, sewage treatment, air filters and electrode in energy storage devices. Besides the above mentioned parts of the plants, there is a growing interest in the use of green leaves as precursors for the AC production. The green leaves contain nitrogen and a pigment called chlorophyll responsible for photosynthesis. The green leaves-derived AC is expected to contain nitrogen which is initially included in the raw materials, affording one-step preparation process of the nitrogen-doped AC.8–11 The nitrogen-doped AC has the potential to broaden the appeal of AC in both existing and emerging applications, especially in the use as electrode materials of high-performance electrochemical capacitor (EC).
000 km2 and 46% of this is used for agricultural purposes. After harvesting, there is a large amount of agricultural waste left. Thus, it is strongly desired to reduce the amount of agricultural waste and investigate the potential to maximize its uses. Agricultural waste can be used as feed for livestock, biomass energy, and raw material for activated carbon (AC) production. For use in AC, the raw materials are currently dominated by trunk, branch, shell, and seed of plants which are mainly composed of cellulose, lignin and hemicellulose.1–7 The obtained AC exhibits a high content of carbon with high surface area and high porosity. These ACs can be used in a wide application such as gas purification, metal extraction, water purification, sewage treatment, air filters and electrode in energy storage devices. Besides the above mentioned parts of the plants, there is a growing interest in the use of green leaves as precursors for the AC production. The green leaves contain nitrogen and a pigment called chlorophyll responsible for photosynthesis. The green leaves-derived AC is expected to contain nitrogen which is initially included in the raw materials, affording one-step preparation process of the nitrogen-doped AC.8–11 The nitrogen-doped AC has the potential to broaden the appeal of AC in both existing and emerging applications, especially in the use as electrode materials of high-performance electrochemical capacitor (EC).
Recently, EC has been focused due to the increasing energy crisis arising from the limited fossil fuels. EC has the potential to bridge the gap between battery and conventional capacitor, as the great advantages including high power density, high rates of charge/discharge and long cycle life.12–16 To improve the performance of EC, most efforts have been focused on the improvement of electrode materials. AC is currently extensively examined and widely utilized as electrode materials with a focus on high specific surface area (SSA), hierarchical porous structure (combination of macro-, meso-, and micro-pores), and heteroatom doping (introduction of nitrogen (N) and oxygen (O) into the carbon framework).8,17–19 In addition, heteroatom doping can improve capacitance value due to charge transfer from faradic reaction as well as the increased accessibility of the electrolytes to electroactive species.8,18,20–23 The microstructure and the element composition of resulting AC largely depend on the raw materials. Thus, by selecting appropriate raw materials, the AC with a controlled microstructure and a desired amount of heteroatoms could be obtained.
In this study, a novel perspective of agricultural wastes for high-performance AC derived from green leaves, papaya and Coccinia grandis leaves (hereinafter referred to as PL and CL, respectively), is proposed. Papaya and Coccinia grandis are cultivated as an important food plant in many countries such as Mexico, India, Thailand, and Southeast Asia. The great popularity of papaya and Coccinia grandis may be attributed to several factors; it is easy to grow and has a high productivity. All parts of papaya tree and Coccinia grandis contain medicinal properties and are used by Thais as herbal medicine also. Synthesis of AC from PL and CL (hereinafter referred to as PL-AC and CL-AC, respectively) was demonstrated by carbonization at 400 °C followed with acid cleaning and NaOH activation. Surpassing the conventional bamboo-derived AC (hereinafter referred to as B-AC), the PL-and CL-ACs shows the hierarchical porous structure (combination of macro-, meso-, and micro-pores), high SSA, numerous heteroatom (O and N) groups, good electrical conductivity, and the wettability properties. To demonstrate their potential application as electrode material of the EC, the electrochemical properties of the PL- and CL-ACs were investigated. The specific capacitances of the PL- and CL-ACs were 98.47 and 89.91 F g−1, respectively, in aqueous electrolyte. The PL-AC shows the dramatic decrease in the series resistances (RS) from 1.33 to 0.53 Ω and the charge transfer resistances (RCT) from 25.83 to 9.00 Ω. These results suggest that nitrogen-rich PL and CL are potential precursors for the synthesis of nitrogen-doped AC in one-step process and can potentially be applied for large-scale industrial production with a low cost.
2. Experimental
2.1 Preparation of activated carbon from papaya and Coccinia leaves
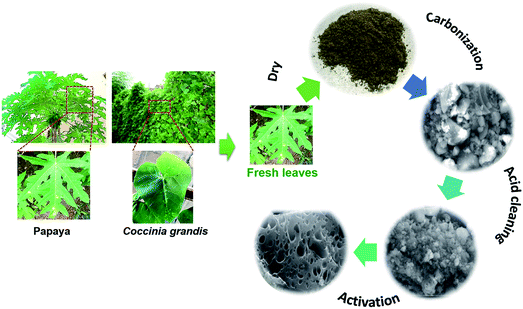
The PL and CL were used as the precursors of the AC production. The fresh PL and CL were obtained from Thailand local farm. The typical AC synthesis process is shown in Fig. 1. Firstly, the fresh leaves were washed with deionized water and dried in an oven at 100 °C for 12 h. The leaves were grinded into small pieces by a blender. The carbonization of the leaves was carried out at 400 °C for 2 h at a heating rate of 10 °C min−1 under argon flow rate of 500 mL min−1. The carbonized sample was then washed with 1 M of sulfuric acid (H2SO4) on a hotplate at 100 °C for 3 h to remove impurities, and was repeatedly washed with deionized water until neutral pH. It was dried at 110 °C in ambient for 12 h. The activation process was conducted by the heat-treatment of a solid mixture of carbonized sample and sodium hydroxide (NaOH) (at the weight ratio of 1![[thin space (1/6-em)]](https://www.rsc.org/images/entities/char_2009.gif) :
:![[thin space (1/6-em)]](https://www.rsc.org/images/entities/char_2009.gif) 2.5) in the tubular furnace at 720 °C for 1 h under argon gas at a flow rate of 500 mL min−1. After that, the sample was washed with deionized water and dried under air ambient at 110 °C for overnight. The ACs thus derived from PL and CL are hereafter referred to as PL-AC and CL-AC, respectively. For comparison, the AC from the bamboo (hereafter referred to as B-AC) was prepared by the same processes.
2.5) in the tubular furnace at 720 °C for 1 h under argon gas at a flow rate of 500 mL min−1. After that, the sample was washed with deionized water and dried under air ambient at 110 °C for overnight. The ACs thus derived from PL and CL are hereafter referred to as PL-AC and CL-AC, respectively. For comparison, the AC from the bamboo (hereafter referred to as B-AC) was prepared by the same processes.
2.2 Material characterizations
The morphologies of all the materials were characterized by scanning electron microscope (SEM, JEOL JSM-700F). The Raman spectra were observed by Raman spectroscope (Renishaw) using a laser wavelength of 532 nm. The nitrogen-adsorption isotherms were observed by the gas adsorption analyzer (Micromeritics ASAP 2020). The BET surface area and pore volume were determined from the adsorption isotherms. The calculation of pore volume was performed based on the method of density functional theory.24 The elemental and the chemical composition of the sample were estimated by X-ray photoelectron spectroscopy (XPS, PHI Quantera II).2.3 Characterization of electrochemical properties
To characterize the electrochemical properties of the synthesized AC, the AC samples were used as the host material of the electrodes of coin type supercapacitor. To construct the electrode, each AC sample was mixed with carbon black and poly-tetrafluoroethylene (PTFE) in the weight ratio of 90![[thin space (1/6-em)]](https://www.rsc.org/images/entities/char_2009.gif) :
:![[thin space (1/6-em)]](https://www.rsc.org/images/entities/char_2009.gif) 5
5![[thin space (1/6-em)]](https://www.rsc.org/images/entities/char_2009.gif) :
:![[thin space (1/6-em)]](https://www.rsc.org/images/entities/char_2009.gif) 5, respectively, in the mortar. Then, the mixture was pressed under applied pressure of 10 kN for 1 min to form an electrode pellet with a diameter of 10 mm, and subsequently dried at 100 °C for 12 h in a vacuum oven. The total mass loading of the electrode material was approximately 20 mg. Two types of electrolytes were used to characterize the electrochemical properties; 1 M Na2SO4 as an aqueous electrolyte and 1 M tetraethylammonium tetrafluoroborate (Et4NBF4) dissolved in propylene carbonate as an organic electrolyte. In the case of the aqueous electrolyte, the electrochemical performance was characterized using a conventional Teflon electrochemistry cell with a three-electrode cell, consisting of two identical electrode pellets on Ni foams with a relatively same weight separated by the a 30 μm-thick separator serving as working and counter electrodes, and a Ag wire as the reference electrode. In the case of the organic electrolyte, the electrochemical performance was determined using a conventional two-electrode coin cell, consisting of two identical electrode pellets with a relatively same weight separated by the a 30 μm-thick separator. All electrochemical tests were carried out by an electrochemical workstation (Bio-Logic Science Instruments VSP Potentiostat). The electrochemical properties were characterized by cyclic voltammetry (CV), galvanostatic charge–discharge (CD), and electrochemical impedance spectroscopy (EIS, with an amplitude of 5 mV in the frequency range of 1 MHz to 10 mHz). The specific capacitances of the supercapacitor (CS) were evaluated from CD curves using the following equations:
5, respectively, in the mortar. Then, the mixture was pressed under applied pressure of 10 kN for 1 min to form an electrode pellet with a diameter of 10 mm, and subsequently dried at 100 °C for 12 h in a vacuum oven. The total mass loading of the electrode material was approximately 20 mg. Two types of electrolytes were used to characterize the electrochemical properties; 1 M Na2SO4 as an aqueous electrolyte and 1 M tetraethylammonium tetrafluoroborate (Et4NBF4) dissolved in propylene carbonate as an organic electrolyte. In the case of the aqueous electrolyte, the electrochemical performance was characterized using a conventional Teflon electrochemistry cell with a three-electrode cell, consisting of two identical electrode pellets on Ni foams with a relatively same weight separated by the a 30 μm-thick separator serving as working and counter electrodes, and a Ag wire as the reference electrode. In the case of the organic electrolyte, the electrochemical performance was determined using a conventional two-electrode coin cell, consisting of two identical electrode pellets with a relatively same weight separated by the a 30 μm-thick separator. All electrochemical tests were carried out by an electrochemical workstation (Bio-Logic Science Instruments VSP Potentiostat). The electrochemical properties were characterized by cyclic voltammetry (CV), galvanostatic charge–discharge (CD), and electrochemical impedance spectroscopy (EIS, with an amplitude of 5 mV in the frequency range of 1 MHz to 10 mHz). The specific capacitances of the supercapacitor (CS) were evaluated from CD curves using the following equations:where CS, I, Δt, ΔV and m are the specific capacitance (F g−1), discharge current (A), discharge time (s), voltage change after a full charge or discharge (V) and the total loading mass of two electrode pellets (g), respectively.
3. Results and discussion
3.1 Morphology and structure characterization
Fig. 2 shows SEM images at low and high magnifications of the PL-AC (Fig. 2a and d), CL-AC (Fig. 2b and e), and B-AC (Fig. 2c and f), respectively. The morphologies of three types of AC were totally different. The PL-AC shows a sponge-like structure, with lots of pores, while the CL-AC contains many small wrinkled sheets fused each other. The B-AC shows the coagulation of fibrous and clustered particles. Fig. 3a shows the nitrogen adsorption and desorption isotherms at 77 K of each sample. The adsorption of nitrogen was remarkably increased in the relatively low pressure region and then gradually saturated. In addison, hysteresis was not obviously observed. The PL-AC shows the highest saturated adsorption amount. Thus, the AC samples can be classified as the type I isotherms (definition of IUPAC25), implying the existence of the microporous solids. Fig. 3b shows the pore size distribution of the AC samples obtained by the DFT method. It can be seen that all the samples have pore sizes mainly in the range of 0.5–3.7 nm, in which the PL- and CL-ACs possess the highest pore volume at the diameter of 0.6 nm, in comparison with that at slightly larger diameter of 0.7 nm for B-AC. The specific surface area (SBET) and pore volume of all the samples calculated from nitrogen adsorption/desorption isotherms were summarized in Table 1. The PL-AC has the highest SBET (2664 m2 g−1) and Vtotal (1.27 cm3 g−1), whereas the B-AC has the lowest SBET (2370 m2 g−1) and Vtotal (0.97 cm3 g−1). The SBET and Vtotal of the CL-AC are 2576 m2 g−1 and 1.05 cm3 g−1, respectively. The PL-AC is characterized by the relatively high Vmicro (0.798 cm3 g−1) and the highest Vmeso (0.466 cm3 g−1 with pore sizes ranging from 2.0 to 3.7 nm). The ratios of the Vmicro to Vtotal and the Vmeso to Vtotal of the PL-AC are 62.83 and 36.69%, respectively. The existence of mesopores in the AC provides a favorable path for transportation and penetration of electrolyte ion, which is important for fast ion transfer.19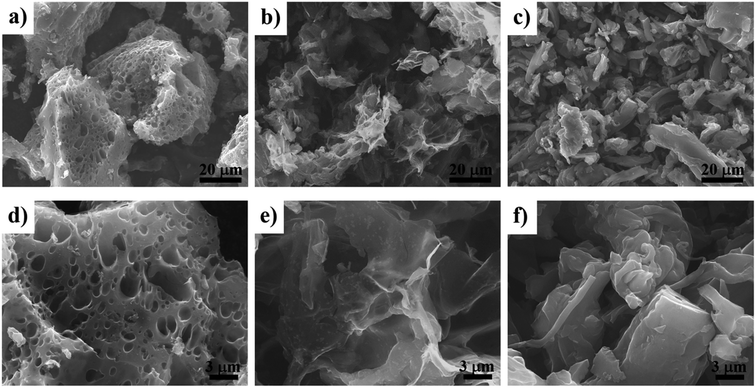 | ||
| Fig. 2 SEM images at low and high magnifications: (a) and (d), PL-AC; (b) and (e) CL-AC; (c) and (f), B-AC. | ||
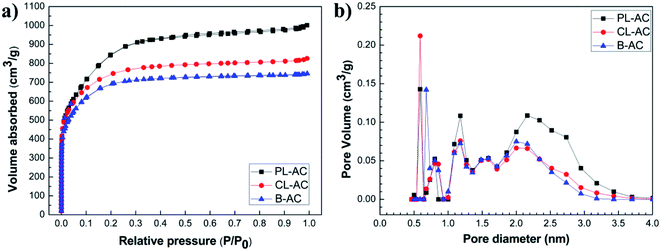 | ||
| Fig. 3 (a) Nitrogen adsorption and desorption isotherms at 77 K, and (b) pore size distribution of PL-, CL- and B-ACs. | ||
| Sample | SBETa (m2 g−1) | Vtotalb (cm3 g−1) | Vmicroc (cm3 g−1) | Vmesod (cm3 g−1) | Vmacroe (cm3 g−1) | Vmicro/Vtotal (%) | Vmeso/Vtotal (%) |
|---|---|---|---|---|---|---|---|
| a BET specific surface area.b DFT total pore volume.c DFT micro-pore volume.d DFT meso-pore volume.e DFT macro-pore volume. | |||||||
| PL-AC | 2664 | 1.270 | 0.798 | 0.466 | 0.005 | 62.83 | 36.69 |
| CL-AC | 2576 | 1.054 | 0.824 | 0.221 | 0.008 | 78.18 | 20.96 |
| B-AC | 2370 | 0.968 | 0.796 | 0.191 | 0.008 | 79.44 | 19.73 |
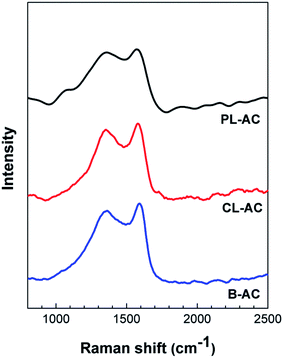
Fig. 4 shows Raman spectra of the AC samples. All the AC samples exhibit two broad overlapping bands, which are the so-called D-band originated from the defects and disordered carbon structure at a Raman shift of around 1360 cm−1, and the G-band originated from the graphitic structure at a Raman shift of around 1600 cm−1.26,27 The ratio of the intensities of the D peak to the G peak (D/G ratio) is generally used as the measure of the degree of graphitization of activated carbon, and the higher ratio means the lower degree of graphitization.27 The corresponding values of the D/G ratio were 1.00, 0.988, and 0.941 for the PL-, CL- and B-AC, respectively. The high D/G ratio indicates the less graphitized carbons.28,29 It is known that the introduction of nanoscale pores on carbon framework usually leads to an increase of defects and disorders.30 Thus, the relatively high D/G ratio of the PL- and CL-ACs implies the structural defects are concerned with the large pore volume in the PL- and CL-ACs. The above results confirms that the PL and CL can be used as the promising precursors to obtain the AC containing nanoporous carbon with relatively large specific surface area and micro-pore volume surpassing the B-AC and the commercial AC (Kansai Coke and Chemicals Company).7
3.2 Elemental and chemical composition
The chemical composition of the AC samples was studied by XPS. Fig. 5 shows XPS spectra of O 1s and N 1s observed for the AC samples. The chemical composition, N/C ratio and the relative N 1s peak area are summarized in Table 2. The PL-AC shows the highest nitrogen content (2.3 at%) and the N/C ratio (0.025), while the CL-AC shows the highest oxygen content of 9.5 at%. The PL- and CL-ACs show relatively high nitrogen content compared to that of the B-AC, implying that nitrogen-rich leaves can be used as precursors of the nitrogen-doped AC. The high-resolution O 1s spectra, shown in Fig. 5a–c, can be divided into three different binding configurations, including O–C![[double bond, length as m-dash]](https://www.rsc.org/images/entities/char_e001.gif) O in carboxylic (533.5 eV), O–C–O/C–OH in ester or phenol (532.2 eV), and C
O in carboxylic (533.5 eV), O–C–O/C–OH in ester or phenol (532.2 eV), and C![[double bond, length as m-dash]](https://www.rsc.org/images/entities/char_e001.gif) O in carbonyl/quinone (531.2 eV).18,31 The content of oxygen functional groups included in each AC is different. The dominant oxygen functional group in the PL- and CL-ACs is C
O in carbonyl/quinone (531.2 eV).18,31 The content of oxygen functional groups included in each AC is different. The dominant oxygen functional group in the PL- and CL-ACs is C![[double bond, length as m-dash]](https://www.rsc.org/images/entities/char_e001.gif) O, while that of the B-AC is O–C–O/C–OH. On the other hand, the high-resolution N 1s spectra, shown in Fig. 5d–f, can be deconvoluted by incorporation of four contributions including pyridine N (398.3 eV, N-6), pyrrolic N (399.89 eV, N-5), quaternary N (401.3 eV, N-Q) and oxidized pyridine N (402.70 eV, N-X).18,31,32 The content of nitrogen functional groups included in the green leaves-derived ACs and the B-AC are completely different. The PL- and CL-ACs show the compositions of N-6, N-5, N-Q and N-X, with the highest content of N-5, while the B-AC shows only the compositions of N-5 and N-Q. Normally, N-5 and N-6 are the defects in the graphene layer and could induce pseudocapacitance property. In addition, high content N-Q group in AC obviously improve the electronic conductivity and the high content of N-X implies the wettability properties. These results show that the raw materials of AC directly affect the microstructure and heteroatom doping properties. Owing to the hierarchical porous structure (combination of macro-, meso-, and micro-pores), high SSA, numerous heteroatom (O and N) groups, good electrical conductivity, and the wettability properties of the PL-and CL-ACs which are important requirements of an ideal electrode material of EC, it is a challenge to investigate the potential of the PL-and CL-ACs as the electrode material of EC.
O, while that of the B-AC is O–C–O/C–OH. On the other hand, the high-resolution N 1s spectra, shown in Fig. 5d–f, can be deconvoluted by incorporation of four contributions including pyridine N (398.3 eV, N-6), pyrrolic N (399.89 eV, N-5), quaternary N (401.3 eV, N-Q) and oxidized pyridine N (402.70 eV, N-X).18,31,32 The content of nitrogen functional groups included in the green leaves-derived ACs and the B-AC are completely different. The PL- and CL-ACs show the compositions of N-6, N-5, N-Q and N-X, with the highest content of N-5, while the B-AC shows only the compositions of N-5 and N-Q. Normally, N-5 and N-6 are the defects in the graphene layer and could induce pseudocapacitance property. In addition, high content N-Q group in AC obviously improve the electronic conductivity and the high content of N-X implies the wettability properties. These results show that the raw materials of AC directly affect the microstructure and heteroatom doping properties. Owing to the hierarchical porous structure (combination of macro-, meso-, and micro-pores), high SSA, numerous heteroatom (O and N) groups, good electrical conductivity, and the wettability properties of the PL-and CL-ACs which are important requirements of an ideal electrode material of EC, it is a challenge to investigate the potential of the PL-and CL-ACs as the electrode material of EC.
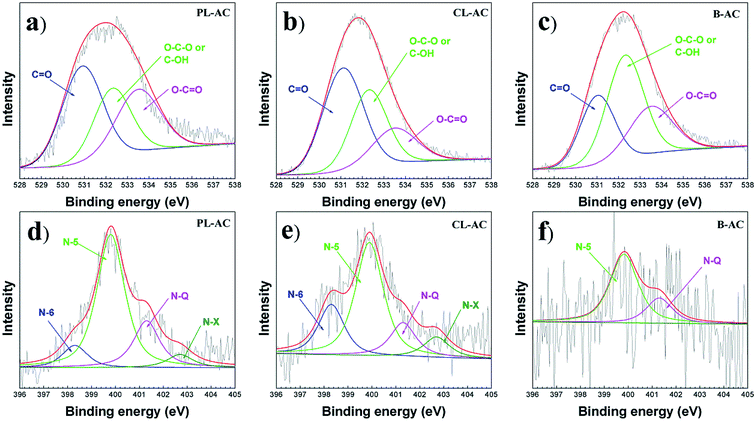 | ||
| Fig. 5 O 1s and N 1s XPS spectra of PL-, CL- and B-ACs: (a) and (d), PL-AC; (b) and (e), CL-AC; (c) and (f), B-AC. | ||
3.3 Electrochemical properties in aqueous electrolyte
The electrochemical properties of the AC samples were investigated in a three-electrode system using 1 M Na2SO4 aqueous electrolyte. The cyclic voltammetry (CV) curves collected at a scan rate 1 mV s−1, and galvanostatic charge–discharge (CD) at an applied constant current of 5 mA are presented in Fig. 6a and b, respectively. The CV curves in a potential window from −1.0 to 0 V present quasi-rectangular shapes with obvious reversible hump, suggesting the capacitive response combination between the electrical double-layer capacitor (EDLC) and pseudo-capacitor. The PL-AC exhibits the largest area of CV curve, indicating the highest capacitance due to the high specific surface area and the high nitrogen content. The steep slopes of the current change at the switching potential at a potential of −0.7 V indicate a small mass-transfer resistance of all electrodes. Obviously, the hierarchical pore structure of all materials provides a short ion pathway and electrolyte reservoir for rapid ionic transportation. The CD curves (Fig. 6b) show a shape of an imperfectly symmetrical triangle, indicating that all AC samples have good electrochemical behaviors accompanied by the pseudocapacitive contribution of the functional group. From CD curves, the specified capacitances of the PL-, CL- and B-ACs were approximately 98.47, 89.91, and 83.68 F g−1, respectively. The excellent capacitive behavior of the PL-AC-based EC was also reflected in their long charge–discharge time. The best electrochemical performance of the PL-AC is attributed to the co-contribution of the high electronic double-layer capacitance due to its high surface area and the additional pseudocapacitance mainly derived from the doped nitrogen. To further understand the origin of the improved electrochemical performance of the PL-AC, the EIS characteristics were investigated.Fig. 6c shows the Nyquist plots of all AC samples in the frequency range of 1 MHz to 10 mHz at an amplitude of 5 mV. The EIS spectra consist of a semicircle in the high-frequency and a linear line in the low-frequency regions. All AC samples show resembles semicircle curve, but different offsets on the x-axis and different diameters, revealing their different characteristics. The offset on the x-axis (Z′) (Ω) of the high-frequency semicircle is a series resistance (RS) of the electrode consisting of the electrode material resistance, the electrolyte resistance and the contact resistance between the electrode material and the current collector. The values of RS of the PL-, CL- and B-ACs are estimated to be 0.53, 1.82, and 1.33 Ω, respectively. The diameter of the semicircle represents the kinetic resistance to the charge transfer, called the charge transfer resistance (RCT). The values of RCT of the PL-, CL- and B-ACs are estimated to be 9.00, 11.86, and 25.83 Ω, respectively. In the case of AC, its properties in terms of surface area, pore structure and conductivity need to be monitored as these properties can be mutually exclusive, that is, one can be improved only to the detriment of another. In this experiment, the significant decrease in RS and RCT of the PL-AC although its relatively large surface area compared to that of the B-AC can be ascribed to the combination properties of high surface area, hierarchical porous structure, and nitrogen doping. In respect of the low value of RS, it may be attributed to the N-Q existence. The quaternary N atoms take the position inside an aromatic ring with sp2 hybridization and fully saturated bonding, and further enhance the electrical conductivity of the carbon material.33 This is evidenced by the high content of N-Q in the PL-AC compared to the B-AC as shown in Table 2, resulting in the low RS of the PL-AC although its high surface area. In respect of the value of RCT, it can be attributed to the following reasons: (i) nanoporous carbon of electrode materials. The large volume of the mesopore of the PL-AC compared to that of the CL- and B-ACs leads provide the accessible route to electrolyte to enter into electrode more easily.34 (ii) the existence of negatively charged nitrogen-containing groups of N-5 and N-6. Generally, N-5 and N-6 species lie at the edges of graphitic layer, where nitrogen atom is bonded to two carbon atoms, creating cavities and defects. The nitrogen atom of N-6 contributes one π-electron to the aromatic ring and has a lone electron pair in the plane of ring, whereas the nitrogen atom of N-5 contributes two π-electron and a hydrogen atom is bound in the plane of the ring.35,36 Due to the high electron density, N-5 and N-6 act as the acceptor and can accept the donors, thereby causing the faradic reaction for contributing to pseudocapacitance (as expressed by e− with the curved blue arrows in Fig. 8). This is evidenced by the high content of N-5 and N-6 in the PL- and CL-ACs compared to the B-AC as shown in Table 2. (iii) The existence of the positively charged nitrogen-containing groups of N-Q and N-X. The N-Q and N-X are the nitrogen species that the nitrogen atom substitutes carbon atom in aromatic ring, and the oxidized pyridine nitrogen atom, respectively, providing the positively charge. Since fast electron transfer is a crucial requirement to keep the constant energy at any operation load. Most of electrochemical capacitors based on porous carbon often suffer from a capacitance drop caused by an increase in the ohmic resistance of porous carbon. Thus, the enrichment of carbons with positively charged N-Q and N-X may help in electron transfer through the porous carbon, resulting in enhancing the capacitance (as expressed by e− with the straight yellow arrows in Fig. 8).18 This is evidenced by the high content of N-Q and N-X in the PL- and CL-ACs compared to the B-AC as shown in Table 2. (iv) The existence of oxygen-containing functional groups. Generally, the micropores of carbon cannot be fully wetted in aqueous electrolyte, and thus are not fully accessible to electrolyte.37 Oxygen-containing functional groups such as C![[double bond, length as m-dash]](https://www.rsc.org/images/entities/char_e001.gif) O and/or C–OH, and the oxidized pyridine (N-X) may improve carbon wettability of the internal structure of micropores, thus resulting in a corresponding decrease in RCT and increase in specific capacitance (as expressed by ions of aqueous electrolyte in Fig. 8). The B-AC could also deliver the relatively good capacitance owing to the existence of the oxygen-containing functional groups and thus compensate the low concentration of nitrogen-containing groups and its relatively low surface area.
O and/or C–OH, and the oxidized pyridine (N-X) may improve carbon wettability of the internal structure of micropores, thus resulting in a corresponding decrease in RCT and increase in specific capacitance (as expressed by ions of aqueous electrolyte in Fig. 8). The B-AC could also deliver the relatively good capacitance owing to the existence of the oxygen-containing functional groups and thus compensate the low concentration of nitrogen-containing groups and its relatively low surface area.
3.4 Electrochemical properties in organic electrolyte
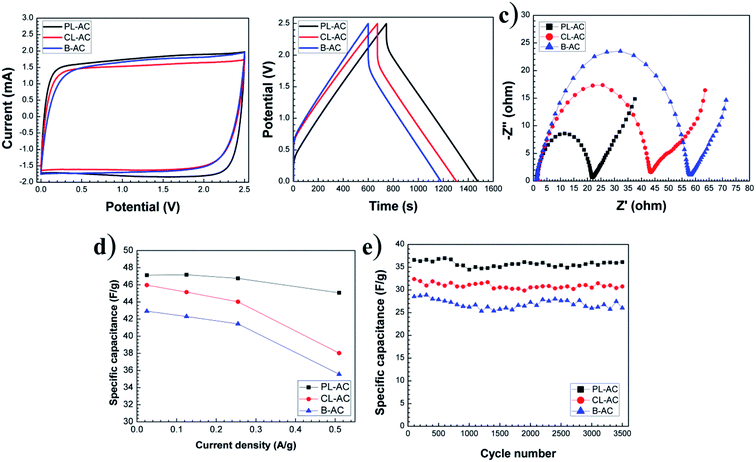
To investigate the versatile use of the green leaves-derived AC in various types of electrolyte, the electrochemical performance of the AC samples were also characterized in the organic electrolyte in order to achieve higher operational voltages and therefore greater specific energy. Similar to the case of aqueous electrolyte, the rectangular CV curves at a scan rate 1 mV s−1 in a potential window from 0 to 2.5 V were obtained confirming the electrochemical properties (Fig. 7a). The imperfectly symmetrical triangle of the CD curves in an applied constant current of 5 mA shown in Fig. 7b also indicates their electrochemical properties. From the Nyquist plot shown in Fig. 7c, the PL-, CL- and B-ACs show the RS of 1.05, 1.27 and 2.40 Ω, respectively, with the RCT of 13.60, 23.06 and 44.02 Ω, respectively. The increase in the RS and RCT in the organic electrolyte compared to that of aqueous electrolyte is due to the lower ionic conductivity of the organic electrolyte. Nevertheless, the PL-AC shows the smallest RS and RCT, especially with the 3.4-fold lowering in RCT compared to that of the B-AC. The specific capacitances calculated from the charge–discharge measurement of all AC samples at different current densities ranging from 0.02 to 0.5 A g−1 are shown in Fig. 7d. The PL-AC shows the highest specified capacitances of 47 F g−1 at the current density of 0.02 A g−1 with the relatively stable specific capacitance at the high current density up to 0.5 A g−1, implying the relatively high capacitance retention of 95.65%. The specific capacitances of the CL- and B-ACs are 45 and 42 F g−1, respectively. Moreover, the energy density and the power density were calculated at the current density of 0.5 A g−1. The energy density of the PL-, CL- and B-ACs was approximately 39, 33 and 30 W h kg−1, respectively, while the power density of the PL-, CL- and B-ACs was approximately 1.7, 3.3 and 4.4 kW kg−1, respectively.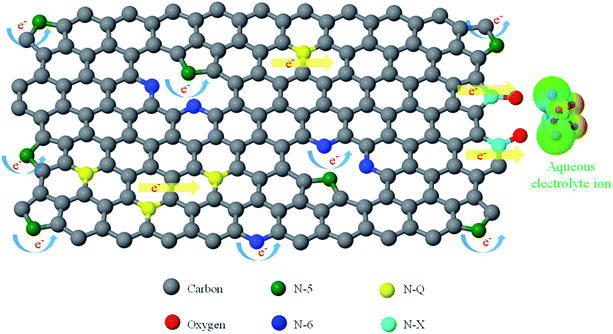 | ||
| Fig. 8 Schematic view of the effect of the properties of the N-5, N-6, N-Q and N-X on the charge transfer resistance. | ||
Fig. 7e shows the specific capacitance vs. the cycle numbers of CD cycles at the constant current of 10 mA of all AC samples. The specific capacitance of the PL-, CL- and B-ACs remains 98.70, 95.02 and 91.26% after 3500 CD cycles. All AC samples show good stability with good retention of capacitance. The specific capacitance, energy density and power density of the PL-AC is relatively comparable to AC derived from other parts of the tree.8,9,11,38,39 In our study, not only the specific surface area of the activated carbon, the effect of the role of heteroatom doping (nitrogen and oxygen) on electrochemical properties also discussed. The morphology and structure of the PL-AC can be further maximized by using the optimized activation agent such as the mixing of K2CO3 and KOH, which is importance in enlargement of pore channel, providing the relatively high specific surface area.17
4. Conclusion
In summary, the nitrogen-containing ACs derived from the green leaves of PL and CL were successfully synthesized by carbonization, acid cleaning and chemical activation processes. The PL- and CL-ACs show the relatively high specific surface area of 2664 and 2576 m2 g−1, respectively, compared to that of the B-AC (2370 m2 g−1). The nitrogen contents composing of N-6, N-5, N-Q and N-X including in the PL- and CL-ACs was approximately 2.3 and 1.8 at%, respectively. Thus, the PL- and CL-ACs offer the relatively high specific surface area, hierarchical porous structure (combination of macro-, meso-, and micro-pores), good conductivity and heteroatom doping, fulfilling the requirement of the use as the electrode material of AC. The PL- and CL-ACs shows excellent electrochemical properties in both aqueous and organic electrolytes. The specific capacitances of the PL- and CL-ACs were 98.47 and 89.91 F g−1, respectively, comparable to 83.68 F g−1 of the B-AC in Na2SO4 electrolyte. Especially, compared to the B-AC, the PL-AC shows the dramatic decrease in the series resistances (RS) from 1.33 to 0.53 Ω and the charge transfer resistances (RCT) from 25.83 Ω to 9.00 Ω. The decrease of RS and RCT is attributed to the existence of the nitrogen in the PL-AC, resulting in a higher conductivity of electrode material and an enhancement of the charge transfer between electrode material and electrolyte. These results suggest that nitrogen-rich PL and CL are potential precursors for the synthesis of nitrogen-doped activated carbon by one-step process, and can potentially be applied for large-scale industrial production with a low cost.Contributions
Synthesis and characterizations were done by P. D., M. F., I. Y., Y. T., Y. B, Y. T., T. A. and M. P. Manuscript was written by P. D., M. F., W. W., K. T. and M. E. with discussions.Conflicts of interest
There are no conflicts to declare.Acknowledgements
This research was partially supported by grants from the Project of the NARO Bio-oriented Technology Research Advancement Institution (Integration research for agriculture and interdisciplinary fields). We also thank Dr Noboru Akuzawa of Shinshu University for his kind suggestions. We also acknowledge the support from the Strategic Scholarships Fellowships Frontier Research Networks (Specific for Southern region) from the Office of the Higher Education Commission (OHEC).References
- J. Deng, T. Xiong, H. Wang, A. Zheng and Y. Wang, ACS Sustainable Chem. Eng., 2016, 4, 3750–3756 CrossRef CAS.
- M. Z. Hussein, M. B. Abdul Rahman, A. H. Yahaya, Y. H. Taufiq-Yap and N. Ahmad, J. Porous Mater., 2001, 8, 327–334 CrossRef.
- A. Jain, V. Aravindan, S. Jayaraman, P. S. Kumar, R. Balasubramanian, S. Ramakrishna, S. Madhavi and M. P. Srinivasan, Sci. Rep., 2013, 3, 1–6 Search PubMed.
- M. Dhelipan, A. Arunchander, A. K. Sahu and D. Kalpana, J. Saudi Chem. Soc., 2016, 21, 487–494 CrossRef.
- R. K. Gupta, M. Dubey, P. Kharel, Z. Gu and Q. H. Fan, J. Power Sources, 2015, 274, 1300–1305 CrossRef CAS.
- S. Uçar, M. Erdem, T. Tay and S. Karagöz, Appl. Surf. Sci., 2009, 255, 8890–8896 CrossRef.
- M. Fujishige, I. Yoshida, Y. Toya, Y. Banba and K. Oshida, Biochem. Pharmacol., 2017, 5, 1801–1808 CAS.
- G. Ma, J. Li, K. Sun, H. Peng, E. Feng and Z. Lei, J. Solid State Electrochem., 2017, 21, 525–535 CrossRef CAS.
- B. Liu, Y. Liu, H. Chen, M. Yang and H. Li, J. Power Sources, 2017, 341, 309–317 CrossRef CAS.
- X. Xia, H. Liu, L. Shi and Y. He, J. Mater. Eng. Perform., 2012, 21, 1956–1961 CrossRef CAS.
- H. Peng, G. Ma, K. Sun, Z. Zhang, Q. Yang and Z. Lei, Electrochim. Acta, 2016, 190, 862–871 CrossRef CAS.
- P. Simon and Y. Gogotsi, Nat. Mater., 2008, 7, 845–854 CrossRef CAS PubMed.
- J. R. Miller and P. Simon, Science, 2008, 321, 651–653 CrossRef CAS PubMed.
- C. Arbizzani, M. Mastragostino and F. Soavi, J. Power Sources, 2001, 100, 164–170 CrossRef CAS.
- A. Burke, Electrochim. Acta, 2007, 53, 1083–1091 CrossRef CAS.
- R. Kötz and M. Carlen, Electrochim. Acta, 2000, 45, 2483–2498 CrossRef.
- Y. T. Li, Y. T. Pi, L. M. Lu, S. H. Xu and T. Z. Ren, J. Power Sources, 2015, 299, 519–528 CrossRef CAS.
- B. D. Hulicova-jurcakova, M. Seredych, G. Q. Lu and J. Bandosz, Adv. Funct. Mater., 2009, 19, 438–447 CrossRef.
- X. Ying, C. Chen, Z. Jie, D. Hua, X. Deng and J. Wei, J. Power Sources, 2013, 230, 50–58 CrossRef.
- M. Inagaki, H. Konno and O. Tanaike, J. Power Sources, 2010, 195, 7880–7903 CrossRef CAS.
- A. Chen, Y. Wang, Y. Yu, H. Sun, Y. Li, K. Xia and S. Li, J. Mater. Sci., 2017, 52, 3153–3161 CrossRef CAS.
- B. Duan, X. Gao, X. Yao, Y. Fang, L. Huang, J. Zhou and L. Zhang, Nano Energy, 2016, 27, 482–491 CrossRef CAS.
- J. Chang, Z. Gao, X. Wang, D. Wu, F. Xu, X. Wang, Y. Guo and K. Jiang, Electrochim. Acta, 2015, 157, 290–298 CrossRef CAS.
- J. P. Olivier, Carbon, 1998, 36, 1469–1472 CrossRef CAS.
- M. Thommes, K. Kaneko, A. V. Neimark, J. P. Olivier, F. Rodriguez-Reinoso, J. Rouquerol and K. S. W. Sing, Pure Appl. Chem., 2015, 87, 1051–1069 CrossRef CAS.
- M. S. Dresselhaus, G. Dresselhaus, R. Saito and A. Jorio, Phys. Rep., 2005, 409, 47–99 CrossRef.
- M. S. Dresselhaus, A. Jorio, M. Hofmann, G. Dresselhaus and R. Saito, Nano Lett., 2010, 10, 751–758 CrossRef CAS PubMed.
- T. C. Chieu, M. S. Dresselhaus and M. Endo, Phys. Rev. B: Condens. Matter Mater. Phys., 1982, 26, 5867–5877 CrossRef CAS.
- C. Hu, S. Sedghi, A. Silvestre-Albero, G. G. Andersson, A. Sharma, P. Pendleton, F. Rodrguez-Reinoso, K. Kaneko and M. J. Biggs, Carbon, 2015, 85, 147–158 CrossRef CAS.
- H. Wang, Z. Xu, A. Kohandehghan, Z. Li, K. Cui, X. Tan, T. J. Stephenson, C. K. King, C. M. B. Holt, B. C. Olsen, J. K. Tak, D. Harfield, A. O. Anyia and D. Mitlin, ACS Nano, 2013, 7, 5131–5141 CrossRef CAS PubMed.
- R. Arrigo, M. Ha, S. Wrabetz, R. Blume, M. Lerch, J. Mcgregor, E. P. J. Parrott, J. A. Zeitler, L. F. Gladden, A. Knop-gericke, R. Schlo and D. S. Su, J. Am. Chem. Soc., 2010, 132, 9616–9630 CrossRef CAS PubMed.
- M. Zhou, F. Pu, Z. Wang and S. Guan, Carbon, 2013, 68, 185–194 CrossRef.
- M. Yang and Z. Zhou, Adv. Sci., 2017, 1600408 CrossRef.
- N. Guo, M. Li, Y. Wang, X. Sun, F. Wang and R. Yang, RSC Adv., 2016, 6, 101372–101379 RSC.
- J. R. Pels, F. Kapteijn, J. A. Moulijn, Q. Zhu and K. M. Thomas, Carbon, 1995, 33, 1641–1653 CrossRef CAS.
- J. Casanovas, J. M. Ricart, J. Rubio, F. Illas and J. M. Jiménez-Mateos, J. Am. Chem. Soc., 1996, 118, 8071–8076 CrossRef CAS.
- C. T. Hsieh and H. Teng, Carbon, 2002, 40, 667–674 CrossRef CAS.
- C. Chen, D. Yu, G. Zhao, B. Du, W. Tang, L. Sun, Y. Sun, F. Besenbacher and M. Yu, Nano Energy, 2016, 27, 377–389 CrossRef CAS.
- Y. Zhao, M. Lu, P. Tao, Y. Zhang, X. Gong, Z. Yang, G. Zhang and H. Li, J. Power Sources, 2016, 307, 391–400 CrossRef CAS.
| This journal is © The Royal Society of Chemistry 2017 |

