 Open Access Article
Characteristics of toluene decomposition and adsorbent regeneration based on electrically conductive charcoal particle-triggered discharge
Gang Xiao,
Weiping Xu ,
Zhongyang Luo
 * and
Hua Pang
State Key Laboratory of Clean Energy Utilization, Zhejiang University, Hangzhou 310027, China. E-mail: zyluo@zju.edu.cn; Tel: +86-571-87952440
First published on 19th September 2017
Abstract
Volatile organic compounds (VOCs) are detrimental to human health, and are also among the most important causes of secondary particulate formation and ozone pollution. The combined method of adsorption and non-thermal plasma has been attracting increasing interest due to its efficient energy consumption. This study aims to explore a new approach for removing gaseous toluene using electrically conductive charcoal (ECC) as an adsorbent and to trigger discharge. ECC was prepared from biomass and had a low electrical conductivity of 0.354 Ω cm and an abundant porous structure with a surface area of 717 m2 g−1. After toluene adsorption (53–217 mg g−1), adsorbent particles were fluidized with oxygen-containing gas and subjected to high voltages (17.4–26.3 W). Micro-arcs formed between the fluidized ECC particles, which led to toluene desorption and decomposition while the ECC was regenerated. The desorption was facilitated compared to thermal desorption. The adsorbed toluene was almost completely desorbed, and 59.23% of toluene was decomposed at one time. Almost no ozone or nitrogen oxides were found in the gas produced from decomposed toluene. Higher adsorption and discharge power were beneficial for decomposition capacity, but the former was limited by short residence time. The adsorption capacity of ECC increased by 16.4% after four cycles. A design was presented for continuous treatment of VOC pollutant without the emission of VOCs.
1. Introduction
Among gaseous pollutants, volatile organic compounds (VOCs) are detrimental to both human health and the environment. Many VOCs are carcinogenic, causing serious health problems1 and high levels of exposure can lead to paralysis of the nerve centre, nausea, muscle weakness, etc. Apart from the direct harmful effects caused by VOCs, indirect air pollution has also received considerable attention.China is facing critical particulate pollution.2 The concentrations of PM2.5 in 74 major Chinese cities have exceeded the Chinese pollution standard of 75 μg m−3 for 40% of days in January, 2017.3 A large portion (51–77%) of PM2.5 mass consists of secondary species, i.e., secondary aerosols. Controlling secondary aerosol precursors is also becoming a major concern. VOCs play an important role in the formation of secondary aerosols through a series of gas-to-particle conversion paths,4 as shown in Fig. 1. Ozone pollution is also becoming increasingly severe due to photochemical smog, which is formed in the presence of VOCs. The 13th Chinese Five-Year Plan stated that total VOC emissions should be reduced by at least 10% by 2020.5 Reducing VOC emission in China is going to be a critical issue over the next few years.
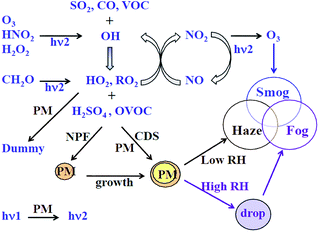 | ||
| Fig. 1 The most important chemical processes for forming photochemical smog and haze–fog4 (PM: aerosol particles, NPF: new particle formation, CDS: the condensation of trace gases on aerosol surfaces). | ||
Toluene is widely used as a solvent and raw material in chemical industries, pharmaceutical factories, and painting industries. Toluene plays an important role in the VOCs emission in China.6,7 It was estimated that toluene covered 6.2% of the total industrial VOCs emission in China in 2013.7 Toluene has been a common VOC used for investigation in previous studies on DBD,8–10 gliding arc discharge,11,12 corona discharge.13,14 It was selected as a pollutant for testing in this study.
Adsorption is an effective method of removing VOCs. It has been reported that the market share of adsorption was 38% of VOC treatment in China, based on 330 VOC treatment cases.15 Porous carbonaceous materials, such as activated carbon, are widely used because of their abundant porous structures and high adsorption capacity. Once saturated, the adsorbents become hazardous residues that are then disposed or incinerated. This causes secondary pollution, but replacing carbonaceous materials with a new adsorbent is not cost-effective. From energy saving and economic point of view, regenerating the adsorbents and decomposing adsorbed VOCs would be preferable.
Of the numerous solutions to this problem, combining an adsorption method with non-thermal plasma (or sequential treatment) has been widely investigated due to its efficient energy consumption and cost-effectiveness.16–21 This approach could treat a wide range of VOC pollutant concentrations. Sivachandiran et al.20 used a TiO2-based catalyst to adsorb isopropanol and then packed it in a dielectric barrier discharge (DBD) to remove isopropanol (IPA). They found that plasma regeneration of the IPA-saturated TiO2 surface led to simultaneous IPA desorption and mineralization. Mok et al.18 and Dang et al.16 investigated DBD packed with γ-Al2O3 pellets via performing two sequential processes: toluene adsorption, followed by DBD oxidation. They found that adsorbed toluene was completely decomposed and ozone was the only by-product. Kuroki et al.17 combined xylene adsorption by zeolite with decomposition by nonthermal plasma with gas circulation and compared two power sources with different frequencies. They reported that high frequency power increased energy efficiency; however, NOx by-products were found to be generated. Zhao et al.21 investigated the removal of low-concentration formaldehyde from air using cycled storage-discharge (CSD), a plasma catalytic process, and used HZSM-5 impregnated with Ag/Cu as both catalyst and adsorbent. They found out that the process had an extremely low energy cost and excellent humidity tolerance, with almost no secondary pollution. In summary, they focused on zeolite, TiO2, HZSM-5, and Al2O3-based catalysts/adsorbents loaded with heavy or transition metals, and almost all of the non-thermal plasma used DBD. These adsorbents have relatively low surface areas (such as ∼40 m2 g−1 for TiO2-based catalysts,20 ∼230 m2 g−1 for Al2O3-based catalysts,18 ∼300 m2 g−1 for HZSM-5-based catalysts21), and thus their abilities for concentrating VOCs are limited. Most catalysts use transition or noble metals such as Mn or Ag. These are not renewable resources and the catalyst deactivation issue remains to be resolved.22,23 The adsorbents mentioned above are also not electrically conductive and when they are submerged in the discharge area, they act as packed materials. Discharge was generated via dielectric barrier discharge and was not directly triggered by the adsorbents; thus, upscaling of the reactor would be limited by dielectric barrier discharge.
Electrically conductive charcoal (ECC) that has excellent adsorption performance and electrical conductivity was suggested as an adsorbent and to trigger discharge. This type of adsorbent has a high surface area (>700 m2 g−1), and thus the concentration of VOCs could be highly promoted. Carbonaceous adsorbents are cheap and renewable since they can be prepared from biomass, such as agricultural waste. Finally, when conductive adsorbent particles are in motion (for example, fluidized) and subjected to high voltage, micro-discharge occurs between particles. At the points where the particles separate, current densities are extremely high (as much as 104 to 107 A cm−2).24 Arc discharge generated from the surface under an extremely intensive electric field leads to the formation of abundant reactive species, which could be a potential method for regenerating and decomposing adsorbed VOCs. The discharge area and the reactor could be scaled up more easily than those based on DBD. Based on this observation, this study investigated this approach and aimed to understand the mechanism. Discharge characteristics were presented to examine the arc formation process. The influence of factors on the desorption and decomposition of toluene were also investigated.
2. Experimental setup
2.1 Preparation of granular electrical conductive charcoal (ECC)
According to previous studies, the electrical conductivity of charcoal was related to its carbonization temperature.4,25 To enhance discharge between particles, charcoal with lower electrical resistivity was prepared through high temperature carbonization. CO2-activation was conducted for abundance of porous structure.Granular corncob, obtained from Shandong Gaotangtewei Technology Co., Ltd, was used as a precursor for ECC preparation. A corundum container with 15 g dried granular corncob (30–40 mesh) was put into the tube furnace. N2 (99.999%) was added into the furnace at a flow rate of 500 mL min−1 for half an hour to create an inert atmosphere. After that, the heating program started and the flow rate was reduced to 100 mL min−1. The temperature increased at a speed of 5 °C min−1 from room temperature to 400 °C to produce a high yield of charcoal and then at 10 °C min−1 to 800 °C for less of an effect on the charcoal yield. The temperature was maintained at 800 °C for two hours for carbonization (the first hour) and CO2-activation (the second hour). During carbonization, the gas entering the furnace was still N2 at a flow rate of 100 mL min−1. During the CO2-activation period, the gas was changed to CO2 at a flow rate of 400 mL min−1. Following this, the heating was stopped and the gas was changed back to N2 at a flow rate of 100 mL min−1 until the furnace was cooled to room temperature. The charcoal obtained was washed in boiled water for two hours to remove fine particles, and then dried at 135 °C for 12 hours. The particles were collected through a 40–60 mesh and stored in a desiccator. The ECC yield was about 22%. The prepared material had a conductivity of 0.354 Ω cm. The BET surface area of the ECC was 717 m2 g−1 with an average pore size of 2.054 nm.
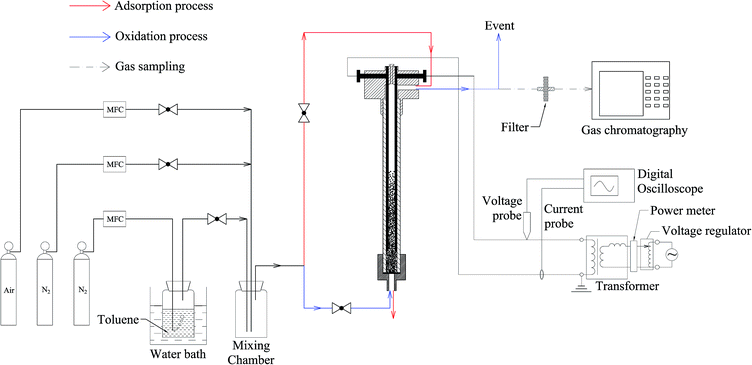
A general schematic of the experimental setup is presented in Fig. 2, including gas preparation, the reactor, power supply, power measurement system and analytical device. These are introduced separately, as follows:
2.2 Gas preparation
Toluene was generated by bubbling N2 through liquid toluene (HPLC grade), which was maintained at 30 °C in a water bath. Gaseous toluene was diluted with N2 or air to a certain concentration in a mixing chamber. In the adsorption process, no voltage was applied. The gas mixture (N2 + toluene) was introduced from the top and during the oxidation process, the gas mixture was changed to N2 + air injected from the bottom. The percentage of O2 was adjusted to 1%, and all of the gas flow rates were controlled by a Mass Flow Controller (MFC, Sevenstar).2.3 Reactor configuration and power supply
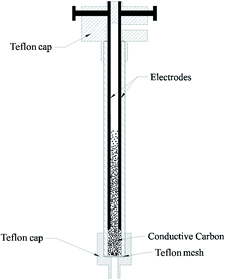
A detailed description of the reactor is presented in Fig. 3. It consists of a quartz tube (din = 10 mm, dout = 16 mm, L = 250 mm) and two parallel cylindrical electrodes (d = 2 mm) made of stainless steel. The two ends of the quartz tube were covered by a Teflon cap. The electrodes were fixed inside the upper Teflon cap, with a distance of 6 mm between them. A Teflon mesh for holding ECC particles was placed at the bottom of the tube. To prevent the mesh from being damaged by discharge, the bottom of the electrode was 20 mm above the Teflon mesh and the input power was restricted.The reactor was supplied with a high voltage transformer (50 Hz, 500 W). A voltage regulator was installed in the circuit to adjust output voltage (0–60 kV). A power meter was installed at the transformer input to measure input power. An inductance was installed in the circuit between the regulator output and the transformer input to protect the transformer from excessive current.
2.4 Power measurement and analytical device
Voltage and current were measured using a high voltage probe (P6015A, Tektronix), a current probe (CP8030A, Shenzhen Zhiyong Electronics), and a digital oscilloscope (DPO2014B, Tektronix). The power waveform was obtained by multiplying the voltage waveform and the current waveform. Discharge power was calculated from four seconds of weighted averaged power (integrating the waveform with respect to 4 s and divided by 4).Gas chromatography (GC, Hangzhou Kexiao Chemical Equipment Co., Ltd.) was used to measure the concentration of toluene and was equipped with a flame ionization detector (FID). It was installed with an ATSE-30 capillary column. The column temperature was set at 90 °C, and the split ratio was set at 5![[thin space (1/6-em)]](https://www.rsc.org/images/entities/char_2009.gif) :
:![[thin space (1/6-em)]](https://www.rsc.org/images/entities/char_2009.gif) 1.
1.
The oxidation product was collected in a Tedlar gas bag (1 L) and analyzed with a Fourier transform infra-red (FTIR) spectrometer (Nicolet iS50) with a resolution of 4 cm−1. It was equipped with a gas cell (Pike Technologies, optical path length = 2.4 m). The entire equipment was operated in a sealed cover to avoid atmospheric interference. Before analysis, N2 (99.999%) was introduced into the spectrometer to drive away the remaining gas in the gas cell for obtaining the background spectrum. Background spectrum before and after the sample analysis is shown in Fig. 4. No difference could be found, as shown in Fig. 4(b), indicating that there was no atmospheric interference. More than 500 mL of sampling gas was introduced and the spectrum of oxidation product was obtained. FTIR spectra were collected with 32 scans per spectrum. The spectra were compared with Standard Reference Database from National Institute of Standards and Technology (NIST)26 to identify the gas components.
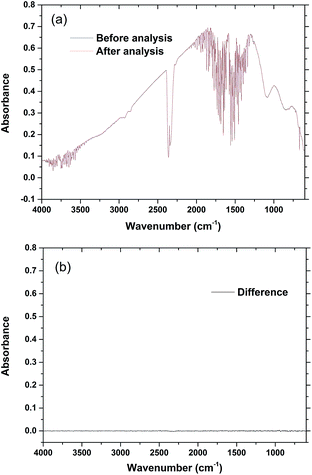 | ||
| Fig. 4 Background spectra analysis. (a) Before (black line) and after (red line) the sample analysis, (b) difference between them. | ||
The oxidation product was analysed using testo 350 gas analyzer (resolution and measuring range: NO (1 ppm, 0–400 ppm), NO2 (0.1 ppm, 0–500 ppm)). It was sampled with a built-in pump at a flow rate of 1 L min−1. It was measured at 20 min after discharge commenced (flow rate: 1.2 L min−1, 1% O2, adsorbed amount: 217 mg g−1, input power: 175 W). The measurement was continued for 10 minutes (1 scan per second).
2.5 Measurement of equilibrium temperature of ECC
Obtaining the temperature of the discharge zone on line by a thermal couple is very difficult because thermal couple's signal would be affected by arc discharge under a high voltage. Temperature at the top of discharge zone was measured with infrared thermometer (TECMAN TM900) during discharge (Tinf.ther). After that, the high voltage power and gas flow were turned off simultaneously and a thermal couple was inserted into the centre of the particle bed within five seconds. The maximum value of the reading was obtained (Tther.coup). It was found that Tinf.ther was in accord with Tther.coup, as shown in Fig. 5. As a result, Tinf.ther was used to represent the temperature of ECC during discharge.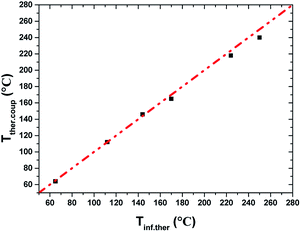 | ||
| Fig. 5 Comparison of Tinf.ther and Tther.coup (dotted line represents curve Tinf.ther = Tther.coup). | ||
2.6 Experimental procedure
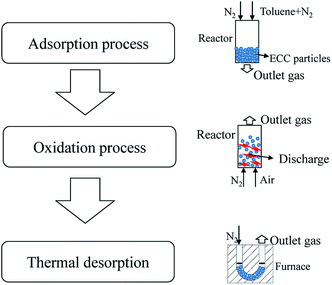
There were three consecutive processes: the adsorption process (red line in Fig. 2), the oxidation process (the blue line in Fig. 2), and the thermal desorption process, as shown in Fig. 6.In the adsorption process, 1 g of ECC was put into the reactor. The gas mixture was set at a high concentration (∼1300 ppm) to reduce adsorption time, with a flow rate of 500 mL min−1. Different amounts of adsorption were obtained through adjusting the adsorption time. The adsorption amount was obtained through the difference between the mass before and after adsorption.
Following the adsorption process, the reactor was flushed with N2 (1.2 L min−1) for one minute to remove the toluene remaining in the reactor.
During the oxidation process, the gas was switched to N2 + air (1% O2) at a flow rate of 1.2 L min−1, with high voltage applied at the same time. The oxidation process was conducted for 90 min.
The toluene concentration at the outlet of the reactor was detected by GC. The gas sampling interval was ∼1.4 min for the initial 10 min, which was increased afterwards (∼3.8 min), because the desorption rate was higher at the beginning of the process. The toluene concentration curves were integrated, and the amount of toluene was obtained, denoted as mescape.
The remaining particles then underwent thermal desorption (TD) to determine the amount of toluene remaining in the adsorbent. The target desorption temperature was 400 °C, which was increased at a rate of 10 °C min−1 in N2 (1.2 L min−1) and then maintained for 1 h. The remaining toluene was completely desorbed at this temperature.27 The toluene concentration was continuously detected by GC so that the amount of toluene remaining in the adsorbent (mremain) could be calculated.
Therefore, mdecomposed was calculated by subtraction (madsorbed − mescape − mremain).
3. Results and discussion
3.1 Discharge characteristics
Typical voltages, current waveforms and a photo of the discharge are presented in Fig. 7. The waveforms were obtained under an input power of 150 W. The peak-to-peak voltage was ∼7 kV. Different time scales were chosen to allow for a deeper understanding of discharge characteristics. Voltages and currents changed periodically, following the frequency of the original power source (50 Hz). Dense current pulses with different amplitudes appeared successively over time, signifying the generation of dense discharge. A single pulse was selected (the dotted-line rectangle in Fig. 7(b)) and described in detail (Fig. 7(a)). When voltage increased to a certain peak value, it dropped abruptly to near-zero, while the current rose up to its maximum value (∼6 A) in less than 200 ns. The maximum current was maintained for about 30 ns and then decreased to near-zero (Fig. 7(a)) in less than 200 ns. The maximum value of current pulses was ∼9 A. These results are typical characteristics of arc discharge,24 and each current pulse indicated electrical breakdown. After one pulse, the voltage increased immediately until it reached the next breakdown voltage and led to a new current pulse. As shown in Fig. 7(b), pulses occurred every 23 μs (i.e. frequency ∼43 kHz). The frequency of repeated pulses ranged from ∼700 Hz to 50 kHz at different phase angles (Fig. 7(c)). Almost no pulses were formed within a small phase angle (∼12°), where a polarity transition occurred. The waveform was occasionally disordered, and current pulses were interrupted irregularly (Fig. 7(e)). The gaps between conductive particles changed arbitrarily due to the turbulence of fluidized particles; thus, arc discharge was distributed randomly within the fluidized volume (Fig. 7(f)).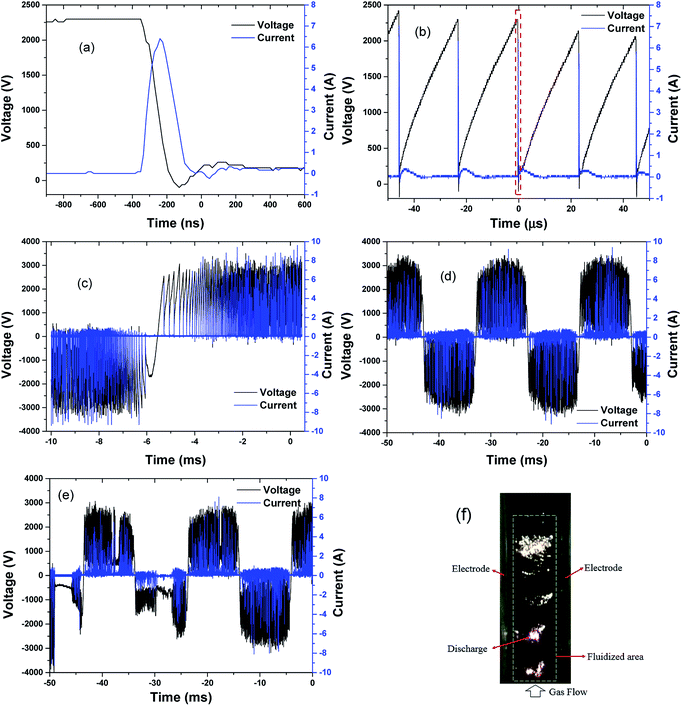 | ||
| Fig. 7 Typical waveforms of voltage and current (a–e) and a photo (f) of particle-triggered discharge (input power: 150 W, gas flow 1.2 L min−1, 1% O2). | ||
3.2 Decomposition characteristics with different adsorption amount
The adsorption amount was set between 53 mg g−1 and 217 mg g−1. The input power was maintained at 175 W, and the average discharge power was ∼23 W. The outlet toluene concentration was presented herein, but no carbon balance analysis was undertaken because the carbon in the adsorbent and toluene were both involved in the reaction process.Fig. 8 presents the outlet concentration of toluene and the temperature evolution with discharge time under different working conditions. It is notable that there are substantial peaks at ∼10 min after the discharge commenced (except saturated adsorption). The equilibrium temperature of ECC during discharge was 218–235 °C. Fig. 9 compares the outlet concentration of toluene from furnace heating (curve A) and discharge (curve B) at the same maximum temperature (∼220 °C) and the same adsorption amount (79 mg g−1). Both the outlet concentrations peaked at around 10 min, indicating that there was a sharp increase in desorption (Fig. 9). Similar results were reported by Mok et al.18 and Klett et al.28 The value of curve A was mostly higher than that of curve B, but the desorption rate was calculated to be ∼82% by furnace heating, which is lower than 98% by discharge (44.7% decomposed and 45.3% escaped). Thus, the arc discharge decomposed toluene and facilitated the desorption of toluene from ECC.29,30 It indicates that desorption of toluene was not just due to the thermal effect. Arc discharge may damage a part of the original active sites and weaken the bond between toluene and the adsorbent. This also accords with results in part 3.4, which showed that adsorption capacity decreased after the first oxidation process.
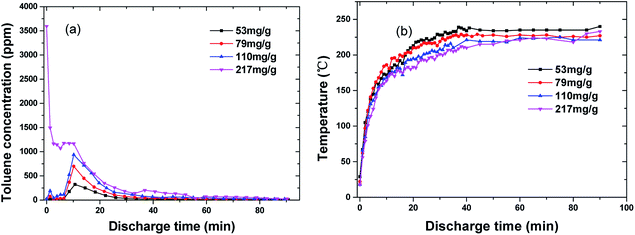 | ||
| Fig. 8 Toluene concentration at the outlet of reactor (a) and temperature (b) as a function of time under different adsorbed amounts (flow rate: 1.2 L min−1, 1% O2, discharge power: ∼23 W). | ||
Fig. 10 provides an overview of the apportionment of adsorbed toluene under different adsorption amounts. Toluene was almost completely desorbed, with little toluene left in the adsorbent (mremain) (Fig. 10). The figure shows that there was a steady increase in the amount of toluene that escaped in the gas flow (mescape) and a slight increase in the decomposition capacity (mdecomposed). The increase in mescape was evident because the desorption of toluene increased steadily as adsorption increased. The increase in mdecomposed, however, was not significant. This was likely because the adsorption amount already covered the decomposition capacity. Background gas was heated by discharge and the temperature increased along the vertical direction. Toluene desorbed more readily at the top of the discharge zone, where there were shorter residence times. This did not make full use of the decomposition capacity. In future upscaling applications, the decomposing capacity might be improved by heat exchange from the upper part to the lower part of the reactor. The oxidation product was collected in a Tedlar gas bag and analysed using FTIR (Nicolet iS50) to determine the oxidation products. The FTIR spectra are shown in Fig. 11. The sample was taken at 20 min after the discharge commenced. Adsorption peaks were detected for CO2, CO, H2O, CH4, and toluene,18,31,32 indicating that decomposed toluene was oxidized into small molecules (CO2, CO, H2O and a small amount of CH4). Almost no ozone or nitrogen oxides were produced in the emitted gas (O3 < 0.01 ppm by Ozone Analyzer Monitor 2B 106M, NO < 2 ppm by testo 350).
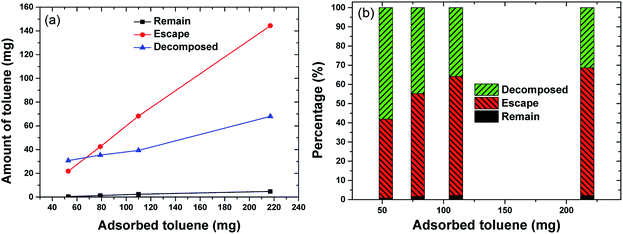 | ||
| Fig. 10 The apportionment of toluene under different initial adsorbed amounts ((a) toluene amount and discharge power, (b) toluene percentage). | ||
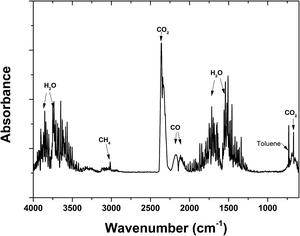 | ||
| Fig. 11 FTIR spectra of the oxidation products (flow rate: 1.2 L min−1, 1% O2. Adsorbed amount: 217 mg g−1. Input power: 175 W). | ||
3.3 Effect of discharge power
The input power was set at 100–200 W (corresponding discharge power was 17.4–26.3 W) to investigate the effect of discharge power. The amount of adsorbed toluene kept almost the same (79 mg g−1).An overview of the toluene apportionment as well as equilibrium temperature is shown in Fig. 12. There was a gradual increase of decomposition efficiency from 24% to 59%. Increasing discharge power enhanced the generation of energetic electrons while leading to the creation of more reactive species (such as O radicals). Toluene decomposition was accelerated by the temperature increase, which is confirmed by the inset in Fig. 12. In practical operation, however, a proper discharge power should be selected because the mass loss of the adsorbent increases at higher power.
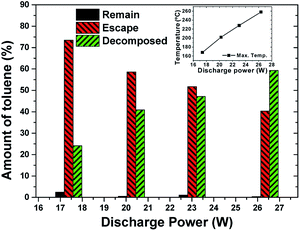 | ||
| Fig. 12 The apportionment of toluene under different discharge power. (Inset figure: equilibrium temperature. Flow rate: 1.2 L min−1, 1% O2. Adsorbed amount: 79 mg g−1). | ||
3.4 Effect of cyclic utilization on the adsorption capacity
The objective of this method was to regenerate the adsorbent while decomposing toluene. This is necessary for evaluating adsorption capacity changes after cyclic utilization. Herein, 1 g of adsorbent was saturated with toluene and used in the oxidation process. After the oxidation process, the residual particles underwent thermal treatment, as introduced in part 2.6. These processes were repeated four times. The input power (175 W), flow rate (1.2 L min−1) and O2 concentration (1% O2) were kept at the same level. Mass before and after each adsorption process was determined to obtain the adsorption capacity. The adsorption capacities are presented in Fig. 13.Adsorption capacity continuously increased after an initial decrease from 217 mg g−1 to 203 mg g−1 in the first cycle. The adsorption capacity increased from 203 mg g−1 to 266 mg g−1 after four cyclic treatments.
The micro-morphologies of the adsorbent particles were observed via scanning electron microscopy (SEM) after each cycle (Fig. 14). The surfaces of the original particles were sharp with many flake-like structures. After the first cycle, the surface became smooth, indicating the loss of surface fragments. Arc discharge impacted the surface, and the flake-like pieces were easily peeled off.33 The pores were likely to have been regenerated (Fig. 14(c–e)) due to the activation of oxygen.34 Arc discharge might have led to the destruction of fine particles as well as the activation of the adsorbent.
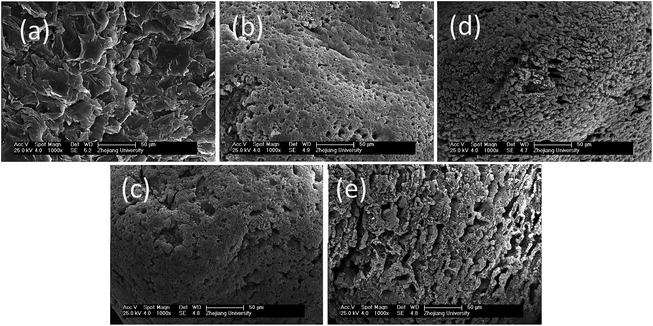 | ||
| Fig. 14 SEM images from before and after each cyclic oxidation stage ((a) primary ECC, (b–e) 1st–4th cycle). | ||
The mass loss of adsorbents was not negligible. For each cycle, about 15% of the original mass was lost on average. This is a problem that needs to be solved in further investigations.
3.5 Design for continuous treatment
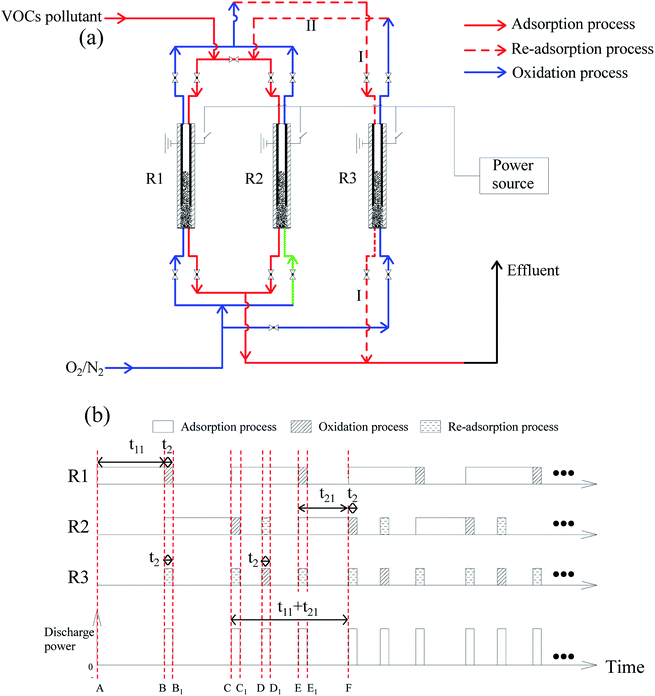
A design for continuous treatment of VOC pollutant and the operating procedure are presented in Fig. 15. The design includes three reactors (R1, R2, and R3). No emissions of VOCs at the effluent gas can be achieved.(1) The adsorption process starts with R1 (red solid line in Fig. 15(a), A → B in Fig. 15(b)), with an adsorption time of t11. Before the breakthrough point, adsorption process is switched to R2 (B → C in Fig. 15(b)), while R1 undergoes an oxidation process (blue line, B → B1). At the same time, R3 undergoes re-adsorption process (red dotted line I), re-adsorbing the undecomposed VOCs of R2.
(2) The adsorption process was switched back to R1 at point C in Fig. 15(b). After two re-adsorption processes (B → B1, C → C1 in Fig. 15(b)), R3 undergoes an oxidation process (blue line in Fig. 15(a), D → D1 in Fig. 15(b)). Moreover, the undecomposed VOC is re-adsorbed by R2 (red dotted line II in Fig. 15(a)). The adsorption period of R2 (i.e. t21, E → F in Fig. 15(a)) is shortened due to prior re-adsorption (D → D1 in Fig. 15(b)). The processes of C → F are then repeated.
Referring to the experimental results in part 3.2, it is supposed that toluene is the only VOC pollutant, and the discharge power (Pdischarge) is 23 W. Each reactor contains 1 g of ECC. The oxidation process is conducted for 90 min (t2). The adsorption amount (ma) is 79 mg each time for each reactor. The decomposition efficiency (η) is 60%. The remaining toluene in the adsorbent was neglected after each oxidation process. Since this method aims to treat low concentration VOCs pollutant, the concentration of toluene (Ct) was set at 10 ppm, with a flow rate (F) of 1.2 L min−1.
In every period of (t11 + t21), three oxidation stages are conducted (Fig. 15(b)). The average energy cost (EC) could be calculated by eqn (1):
 | (1) |
 | (2) |
 | (3) |
It can be calculated that t11 = 1582 min and t21 = 1076 min. Overall discharge time covers ∼10% of the total treatment time on average. The average energy cost is 0.032 kW h m3. Since mass loss of ECC was ∼15% in each oxidation process, 1 g of virgin adsorbent needs to be replenished every 5907 min on average. Further investigation is needed to optimize the energy cost and reduce the adsorbent loss.
4. Conclusions
A new approach for toluene decomposition and adsorbent regeneration based on ECC particle-triggered discharge was investigated. This study identified the influences on the apportionment of adsorbed toluene and adsorption capacity change. The following conclusions were obtained:The arc discharge decomposed toluene and facilitated the desorption of toluene from ECC. Almost 60% of toluene was decomposed at one time under experimental conditions. An increase in the initial adsorption amount and discharge power benefitted the decomposition capacity, but the former was limited due to insufficient residence time. Almost no ozone or nitrogen oxides were produced in the gas product. The adsorption capacity increased by 16.4% after four storage-discharge process cycles. Using three reactors, a design for continuous treatment without the emission of VOCs was presented.
Conflicts of interest
There are no conflicts to declare.Acknowledgements
The authors gratefully acknowledge the support from the National Natural Science Foundation of China (No. 51276167).References
- A. M. Vandenbroucke, R. Morent, N. De Geyter and C. Leys, J. Hazard. Mater., 2011, 195, 30–54 CrossRef CAS PubMed.
- J. Cao, J. Earth Environ., 2012, 3, 1030–1036 Search PubMed.
- C. N. E. M. Centre, Air Quality Report in 74 Chinese Cities in January 2017 (in Chinese), accessed 27 February, 2017.
- G. Xiao, R. Xiao, B. S. Jin, W. Zuo, J. C. Liu and J. R. Grace, J. Biobased Mater. Bioenergy, 2010, 4, 426–429 CrossRef CAS.
- N. D. R. Commission, the 13th Five-Year Plan for Economic and Social Development of the People's Republic of China (in Chinese), accessed 16 March, 2016.
- X. Liang, X. Chen, J. Zhang, T. Shi, X. Sun, L. Fan, L. Wang and D. Ye, Atmos. Environ., 2017, 162, 115–126 CrossRef CAS.
- R. Wu and S. Xie, Environ. Sci. Technol., 2017, 51, 2574–2583 CrossRef CAS PubMed.
- C. Subrahmanyam, A. Renken and L. Kiwi-Minsker, Chem. Eng. J., 2007, 134, 78–83 CrossRef CAS.
- R. Huang, M. Lu, P. Wang, Y. Chen, J. Wu, M. Fu, L. Chen and D. Ye, RSC Adv., 2015, 5, 72113–72120 RSC.
- W. Xu, X. Xu, J. Wu, M. Fu, L. Chen, N. Wang, H. Xiao, X. Chen and D. Ye, RSC Adv., 2016, 6, 104104–104111 RSC.
- A. Indarto, D. R. Yang, C. H. Azhari, W. H. W. Mohtar, J.-W. Choi, H. Lee and H. K. Song, Chem. Eng. J., 2007, 131, 337–341 CrossRef CAS.
- T. Nunnally, A. Tsangaris, A. Rabinovich, G. Nirenberg, I. Chernets and A. Fridman, Int. J. Hydrogen Energy, 2014, 39, 11976–11989 CrossRef CAS.
- M. J. Kirkpatrick, W. C. Finney and B. R. Locke, Catal. Today, 2004, 89, 117–126 CrossRef CAS.
- J. Van Durme, J. Dewulf, W. Sysmans, C. Leys and H. Van Langenhove, Chemosphere, 2007, 68, 1821–1829 CrossRef CAS PubMed.
- J. Xi, J. Wu, H. Hu and G. Wang, China Environ. Sci., 2012, 32, 1955–1960 CAS.
- X. Dang, J. Huang, L. Cao and Y. Zhou, Catal. Commun., 2013, 40, 116–119 CrossRef CAS.
- T. Kuroki, K. Hirai, R. Kawabata, M. Okubo and T. Yamamoto, IEEE Trans. Ind. Appl., 2010, 46, 672–679 CrossRef CAS.
- Y. Mok and D. Kim, Curr. Appl. Phys., 2011, 11, S58–S62 CrossRef.
- T. Ohshima, T. Kondo, N. Kitajima and M. Sato, IEEE Trans. Ind. Appl., 2010, 46, 23–28 CrossRef CAS.
- L. Sivachandiran, F. Thevenet, P. Gravejat and A. Rousseau, Chem. Eng. J., 2013, 214, 17–26 CrossRef CAS.
- D.-Z. Zhao, X.-S. Li, C. Shi, H.-Y. Fan and A.-M. Zhu, Chem. Eng. Sci., 2011, 66, 3922–3929 CrossRef CAS.
- Z. Machala, E. Marode, M. Morvová and P. Lukáč, Plasma Processes Polym., 2005, 2, 152–161 CrossRef CAS.
- W. Mista and R. Kacprzyk, Catal. Today, 2008, 137, 345–349 CrossRef CAS.
- Y. P. Raizer and J. E. Allen, Gas discharge physics, Springer, Berlin, 1997 Search PubMed.
- G. Xiao, M. Ni, R. Xiao, X. Gao and K. Cen, J. Biobased Mater. Bioenergy, 2012, 6, 69–74 CrossRef CAS.
- NIST Chemistry WebBook, http://webbook.nist.gov/chemistry/, accessed 21 March, 2017.
- F. J. Maldonado-Hódar, C. Moreno-Castilla, F. Carrasco-Marín and A. F. Pérez-Cadenas, J. Hazard. Mater., 2007, 148, 548–552 CrossRef PubMed.
- C. Klett, X. Duten, S. Tieng, S. Touchard, P. Jestin, K. Hassouni and A. Vega-González, J. Hazard. Mater., 2014, 279, 356–364 CrossRef CAS PubMed.
- N. Blin-Simiand, P. Tardiveau, A. Risacher, F. Jorand and S. Pasquiers, Plasma Processes Polym., 2005, 2, 256–262 CrossRef CAS.
- V. I. Pârvulescu, M. Magureanu and P. Lukes, Plasma chemistry and catalysis in gases and liquids, John Wiley & Sons, 2012 Search PubMed.
- D.-Z. Zhao, X.-S. Li, C. Shi, H.-Y. Fan and A.-M. Zhu, Chem. Eng. Sci., 2011, 66, 3922–3929 CrossRef CAS.
- Y.-H. Song, S.-J. Kim, K.-I. Choi and T. Yamamoto, J. Electrost., 2002, 55, 189–201 CrossRef CAS.
- Y.-F. Guo, D.-Q. Ye, K.-F. Chen, J.-C. He and W.-L. Chen, J. Mol. Catal. A: Chem., 2006, 245, 93–100 CrossRef CAS.
- S. Tang, N. Lu, J. K. Wang, S.-K. Ryu and H.-S. Choi, J. Phys. Chem. C, 2007, 111, 1820–1829 CAS.
| This journal is © The Royal Society of Chemistry 2017 |

