 Open Access Article
A statistical physics study of the interaction of [7]-helicene with alkali cations (K+ and Cs+): new insights on microscopic adsorption behavior
Mohamed Ben Yahiaa,
Moncef Tounsib,
Fatma Aouainia,
Salah Knani *c,
Manel Ben Yahiad and
Abdelmottaleb Ben Laminea
aResearch Unit of Quantum Physics 11 ES 54, Faculty of Sciences of Monastir, Tunisia. E-mail: abdelmottaleb.benlamine@gmail.com
bInterfaces Laboratory and Advanced Materials, (LIMA), Faculty of Sciences of Monastir, Tunisia
cNorthern Border University, College of Science, Arar, P.O. Box 1631, Saudi Arabia
dDepartment of Physics, Faculty of Science, King AbdulAziz University, Rabigh, Saudi Arabia. E-mail: knanisalah@yhoo.fr; Tel: +966 500886582; +216 95666600.
First published on 19th September 2017
Abstract
The adsorption of a metal ion to a polycyclic aromatic molecule such as helicene is the object of our study. The latter could function as a chiral molecular clamp for the cationic alkali metal. The main contribution of this work is to attribute new microscopic interpretations for the adsorption of potassium and cesium ions onto a thin layer of helicene achieved by the QCM technique. Throughout the grand canonical ensemble and some theoretical considerations, statistical physics processing has been used for modeling of experimental adsorption isotherms. A new model has been developed and chosen as an appropriate one to present a good correlation with experimental isotherms. Six physico-chemical parameters are obtained from the fitting of the experimental adsorption isotherms. Thanks to the steric parameters, we have found that an increase in temperature promotes a rise in the numbers of ions per site n1 and n2 and raises the adsorption capacities NM1 and NM2. The two energetic parameters c1 and c2 allow deduction of the adsorption energies at four temperatures. It is found from the calculated energies that physical adsorption takes place; the helicene can function as potassium and cesium captor and the K+–helicene complex is more stable than the Cs+–helicene complex.
1. Introduction
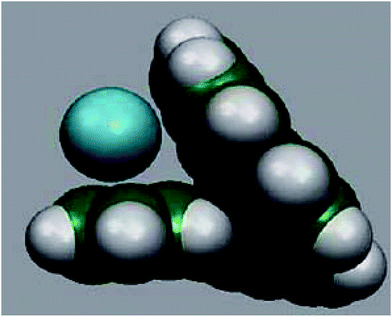
Helicenes are polycyclic aromatic compounds consisting of ortho-fused benzene rings with nonplanar topology with C2-symmetric axis perpendicular to the axis of helicity as a result of the steric repulsive interaction between terminal aromatic rings.1–3 This makes them chiral even though they have no center of chirality. The highly delocalized large π-electron system of fully aromatic helicenes along with the previously mentioned inherent chirality predetermines their unique optical4 and electronic5 properties, as well as their use in many fields of research including supramolecular chemistry,6–9 molecular recognition,10,11 and asymmetric organo- or transition metal catalysis.12,13[7]-Helicene (Fig. 1a) is a particularly interesting member of the carbohelicene family. Seven contiguous benzenoid rings give rise to a scaffold that completes one full turn of the helix (Fig. 1b). Furthermore, the two terminal rings of this helicene are co-facial (Fig. 1c).
It was apparent to us that such a structure provides a central cavity that could potentially host a suitably sized guest, with the co-facial terminal rings providing a stabilizing interaction. In this respect [7]-helicene would be functioning as a “molecular tweezer”,14,15 a term coined by Whitlock16 to describe a simple molecular receptor characterized by two flat, generally aromatic pincers, separated by some kind of tether, which is more or less rigid.16 Indeed, many recent studies have emerged the possibility of [7]-helicene acting as a molecular tweezer of alkali metal cations (Li+, Na+, K+, Cs+), and transition metals (Cr, Mo, W).17
In recent years, several experimental and theoretical studies have been carried out on helicenes and related molecules including the determination of their racemization barriers,18,19 aromatic character20 and nonlinear optical properties (e.g. of tetrathia-helicenes). However, interactions between helicenes and atoms/ions as well as other molecules do not appear to have been studied. This is attempted in the present investigations. We were therefore keen to investigate the experimental possibility of [7]-helicene functioning as a chiral molecular tweezer of metallic cations (K+ and Cs+).
Our study is essentially based on two parts: in the first we detailed the experimental method used to obtain the adsorption isotherms of potassium and cesium onto thin layer of hepta-helicenes at four temperatures. Secondly, throughout the statistical physics formalism, we will propose a new theoretical model which presents a high correlation with the experimental curves to interpret the adsorption processes.
2. Materials and methods
2.1. Adsorbent
The adsorbent used is the hepta-helicene: Fig. 2 shows the reason why [7]-helicene (C30H18) alone has been chosen for the present work.The profile of the molecule shows the two terminal overlapping benzene rings in the form of a crocodile's jaws. Other helicenes do not have such a profile. Therefore, it would be worthwhile to investigate the nature of the interactions of [7]-helicene with cations of alkali metals. In other words, how do the ions and molecules slide into the ‘jaws’ of [7]-helicene and how do the ‘jaws’ open up to receive the ‘food’? Such an interaction might also be able to model, e.g. drug-DNA interactions. It has long been known through crystallographic studies of the DNA–actinomycin D interacting system21 that as the drug slides into DNA, DNA first opens up to receive the incoming molecule and then ‘bites down’ on it through stretching, bending, sliding and unwinding motions of the sugar-phosphate backbone via the corresponding normal modes. For [7]-helicene to mimic such interactions, it would be of interest to see whether this relatively smaller molecule has adequate flexibility in its backbone in the case of its interaction with alkali metals.
2.2. Adsorbates
The adsorbates used are the potassium chloride and the cesium chloride:Cesium chloride is the inorganic compound with the formula CsCl. This colorless solid is an important source of cesium ions in many applications. Cesium chloride dissolves in water.
Potassium chloride (KCl) is a metal halide salt composed of potassium and chloride. It is odorless and has a white or colorless vitreous crystal appearance. The solid dissolves readily in water and its solutions have a salt-like taste. KCl is used in medicine and many other scientific applications.
The ultimate goal of this study was to explore the adsorption phenomenon of alkali metal on a solid surface. The quartz crystal microbalance (QCM) technique may be a comparatively good and effective method for the monitoring of helicene adsorption. The QCM method has been successfully used for the investigation of the adsorption process at the solid–solution interface.22,23
2.3. Adsorption experiments
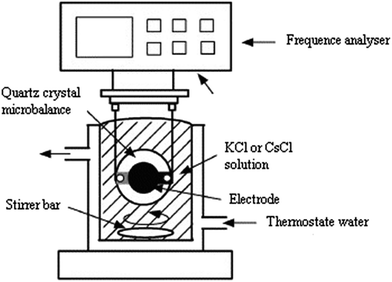
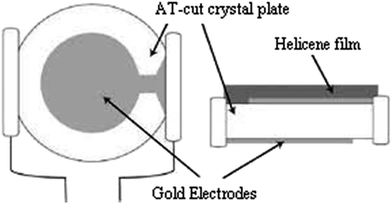
The experimental setup for the adsorption measurements with the quartz crystal microbalance is depicted in Fig. 3. The QCM24–26 setup consisted of the coated electrode, the QCM instrument, a crystal holder, and adsorption cell.For film deposition, a volume of 30 μL of hepta-helicenes was spin coated at 3000 rpm for 1 min onto the larger gold electrode to cover the overlapping electrodes portion (Fig. 4). The coated crystals were then dried at 100 °C for at least 2 h.
After drying, we started our measurements. The QCM crystal holder was immersed in the adsorption cell filled with Vs = 100 mL of pure water. After stabilization of the QCM frequency change, 100 μL of the prepared stock solution of KCl or CsCl was injected and stirred with a magnetic stirrer; one hour was found to be enough to reach adsorption equilibrium. The detection signals and calculated adsorbed mass in the conventional QCM are solely based on the assumption that the changes of the fundamental piezoelectric frequency is proportional to the change of adsorbed mass on the surface of the quartz crystal calculated from the classical Sauerbrey equation:27
 | (1) |
Thus, the constant terms can be combined together to give a crystal sensitivity constant, C, which is specific to crystal:28
 | (2) |
The adsorbed amount of potassium and cesium ions per unit of area expressed in μg cm−2 is conducted directly from the measured frequency after each injection (Fig. 5).
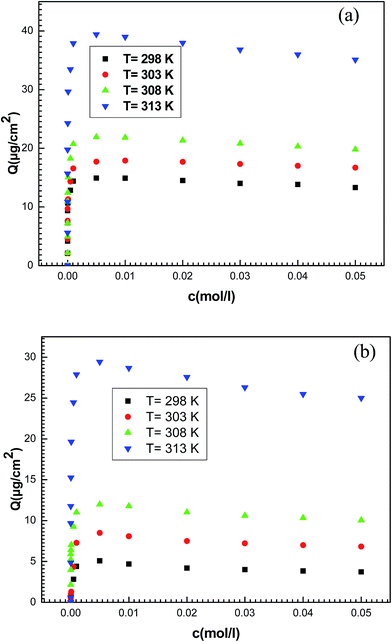 | ||
| Fig. 5 Experimental adsorption isotherms of (a) potassium chloride and (b) cesium chloride on a thin layer of hepta-helicenes for the four temperatures. | ||
In the following we use a statistical physics treatment to establish the expression of statistical model giving the adsorbed quantity versus the concentration. Secondly we apply the adequate analytical expression to fit experimental isotherms.
3. Theory
Measurement and modeling of adsorption isotherms has attracted numerous researchers because of their application in industrial practice. Numerous mathematical models for the description of adsorption isotherms are available in the literature. Some of these models are based on theories of the adsorption mechanism; others have been purely empirical, or semi-empirical. It is difficult to have a unique mathematical model whether theoretical or empirical that describes accurately the adsorption isotherm. The criteria used to select the most appropriate adsorption model were the degree of fit to the experimental data and the simplicity of the interpretation of the model. In our theoretical development, we rely on a statistical physics treatment and some assumptions will be considered to simplify the theoretical calculations. This theoretical base will allow us to better interpret and to deduce information about adsorption process at the microscopic scale.Adsorption involves an exchange of particles from free state to the adsorbed one. Its investigation cannot be performed without employing the grand canonical ensemble to take into account the particle number variation through the introduction of a variable chemical potential μ in the adsorption process. Although the overall system is canonical, the canonical ensemble and the grand canonical one are considered equivalent as it is a macroscopic system. The fluctuations may be neglected as the system is at the thermodynamic limit. Therefore the system can be studied using the grand canonical ensemble with the results being interpreted canonically.29
It is also assumed that the internal degree of freedom of the adsorbate ions may be neglected in aqueous solution there by allowing only the most important degree of freedom, i.e. the translational one, to be taken into account. This arises because the electronic degree of freedom cannot be excited thermally and the rotational degree of freedom is hampered in solution. The vibrational degree of freedom can be neglected in comparison with the translational one.
According to these assumptions, in liquid phase, the adsorption reaction of liquid ions (A) onto receptor sites (S) should include a stoichiometric coefficient n as shown in the following equation:
| nA + S ⇆ AnS | (3) |
The grand canonical partition function in this case, for only one site, has the form:
 | (4) |
| Zgc = (zgc(T,μ))NM | (5) |
The occupation number for NM identical receptor sites is therefore given as follow:33
 | (6) |
The adsorbed quantity (Q) is given per unit surface, because the density of receptor sites (NM) is written per unit surface and is written as:34,35
| Q = nNo | (7) |
Finally, to get any model expression, it is sufficient to write the adequate grand canonical partition function and follow the last steps (eqn (4)–(7)). The use of statistical physics principles will allow, firstly, establishing the model expressions and secondly, to better interpret and deduce information about adsorption process at a molecular level, which could not be achieved by means of empirical models.
There are many theories relating to adsorption equilibrium. So, three models are proposed: monolayer, double layer and finite multilayer models. For the first model, there are three fitting parameters, for the second, it is assumed that each receptor site can be empty or occupied once or twice whereas for the third model we assumed that L1 layers of adsorbed ions are formed one after the other with the first energy (−ε1) and L2 layers with the energy (−ε2).
The equations of these models and their corresponding grand canonical partition functions are summarized in Table 1.
With A, B and C are functions of the concentration such as:
 | (11) |
 | (12) |
 | (13) |
 and
and  .
.
In the expression of adsorbed quantity given by each model there are two classes of parameters, the first is a steric aspect such as the number of ions per site n, the density of receptor sites NM, and the two average number of adsorbed layers L1 and L2, the second aspect is energetic one given by the parameters c1 and c2 which are function of the adsorption energies.
 | (14) |
 | (15) |
We note that our experimental data present a decreasing in the adsorbed quantity after saturation. So in the next step, we will prove that these three statistical models can't describe the adsorption isotherms of potassium and cesium on hepta-helicene.
3.1. Fitting results
Our objective is to select the adequate model, which presents a high correlation with the experimental curves. To fit these adsorption isotherms, computational software was applied based on the Levenberg–Marquardt iterating algorithm using a multivariable non-linear regression.The figure of merit used as indicator of the overall goodness-of-fit of the model to the data is the multiple correlation coefficients squared, R2 also known as the coefficient of determination which is a standardized measure of the goodness-of-fit. This coefficient is given by:36
 | (16) |
![[Q with combining macron]](https://www.rsc.org/images/entities/i_char_0051_0304.gif) i,exp is the average of Q experimentally measured, np is the number of experiments performed and p is the number of parameters of the fitted model.
i,exp is the average of Q experimentally measured, np is the number of experiments performed and p is the number of parameters of the fitted model.
The choice of the ideal fitting model is based on two criteria: the first one is obtained when the value of R2 is close to the unit and the best fitting result is established once the residuals between the experimental data and adsorbed quantities value predicted by the model are minimized according to a determined level of confidence. In our case, the level of confidence was set at 95%. The second is that the parameters are acceptable and can facilitate and enrich the interpretation of the adsorption process.
In Tables 2 and 3 we present the R2 values deduced from the fit of the experimental adsorption isotherms of the potassium and cesium onto helicenes.
| T (K) | 298 | 303 | 308 | 313 |
| Mono-layer | 0.69711 | 0.69795 | 0.89763 | 0.79476 |
| Double-layer | 0.87541 | 0.78373 | 0.67149 | 0.78792 |
| Multi-layer | 0.79832 | 0.89806 | 0.79804 | 0.79779 |
| T (K) | 298 | 303 | 308 | 313 |
| Mono-layer | 0.89711 | 0.79795 | 0.79763 | 0.89476 |
| Double-layer | 0.87541 | 0.68373 | 0.77149 | 0.88792 |
| Multi-layer | 0.79832 | 0.69806 | 0.69804 | 0.86779 |
We noticed that the values of adjustment coefficients R2 given by these models vary from 0.68 to 0.89. These fitting values don't reach the level of confidence. So, we conclude that the adsorption of potassium and cesium ions cannot be explained by these models.
In comparison between the three models we note that the monolayer model presents the best values of R2 which traduce a physical reason that the adsorption cannot exceed one layer. Nevertheless, this model cannot fit the adsorption isotherms with good approximation.
The principal motivation to find another model is that the adsorption isotherms present a decrease of adsorbed quantity versus concentration such behavior cannot be explained by the three previous models. Therefore, a new model will be developed throughout the processing statistical physics and we will show that the proposed model is sufficiently flexible to give a good representation of the experimental data.
3.2. New theoretical development
In order to develop the expression of this model, a variable number of potassium or cesium ion are hypothesized to be adsorbed onto two different adsorption sites having different energy level. The number of sites of the first type is NM1 sites per unit of surface and the number of the second type is NM2. We suppose that the adsorption onto the first type is carried out with the energy (−ε1) and onto the second type with the energy (−ε2). We define the state of occupation Ni and it is assumed that any given receptor site can either be empty, and consequently Ni takes the value 0, or occupied so Ni is equal to the unit. In this case, we can write the grand canonical partition function for each type of receptor site:| z1gc = 1 + eβ(ε1+μ1) | (17) |
| z2gc = 1 + eβ(ε2+μ2) | (18) |
The total grand canonical partition function has the following form:
| Zgc = (z1gc)NM1(z2gc)NM2 | (19) |
The choice of two energies levels is not arbitrary but based on physical reasons. The first is based on work elaborated by Tan et al.43 which suggest that the helicene might be open its two terminal overlapping benzene rings to form a crocodile's jaws able to attract the alkali cations. The second one is that the helicene molecule presents aromatic cycles and for electrostatic reason can probably attract the ions.
Using the same treatment elaborated by Nakhli et al.,37 the adsorbed quantity versus concentration is written as:
 | (20) |
 | (21) |
 | (22) |
 | (23) |
 | (24) |
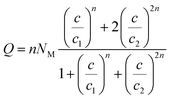
Finally, using the equilibrium condition and the previous definition given by eqn (7) the adsorbed quantity versus concentration is given by the following expression:
The expression of this model giving the adsorbed quantity versus concentration involves six physicochemical parameters. The parameters numbers of ions per site (n1 and n2) imply that the receptor site can be either empty or occupied by one or more potassium or cesium ion. The NM1 and NM2, density of receptor sites, give information about partial saturation when the totality of type of sites is occupied. c1 and c2 are two energetic parameters.
The proposed model will be simulated to the experimental adsorption isotherm.
In Table 4 we present the R2 values deduced from the fit of the experimental adsorption isotherms of the potassium chloride and cesium chloride to helicene.
| Isotherms | T = 298 K | T = 303 K | T = 308 K | T = 313 K |
|---|---|---|---|---|
| Potassium–helicene | 0.996 | 0.995 | 0.998 | 0.997 |
| Cesium–helicene | 0.997 | 0.998 | 0.997 | 0.996 |
In Fig. 6 we illustrate the fit of adsorption isotherms at four temperatures by new model.
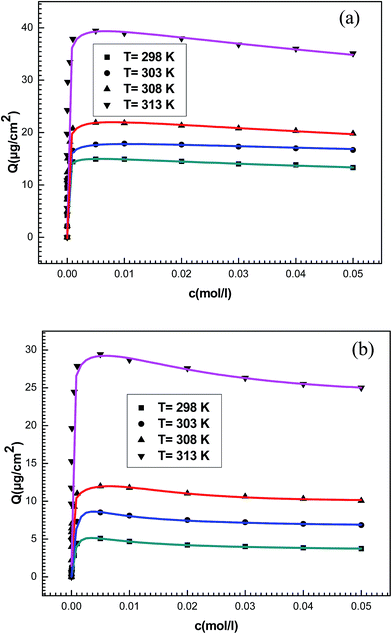 | ||
| Fig. 6 Experimental data of adsorption isotherms of (a) potassium and (b) cesium fitted by statistical model (illustrated by different lines at different colors) at different temperatures. | ||
We noticed that our model presents the high R2 values in comparison with the three previous models. These values vary from 0.995 to 0.998 and the fitting parameters are acceptable physically. So, we conclude that, using a statistical physics treatment, the proposed model is sufficiently flexible to give a good representation of the experimental data and it is able to predict some information about the adsorption of the alkali metals onto the adsorbent surface.
In the next section, we will investigate the effect of each parameter on the adsorbed quantity versus the adsorbate concentration.
3.3. Physical interpretations of the model parameters
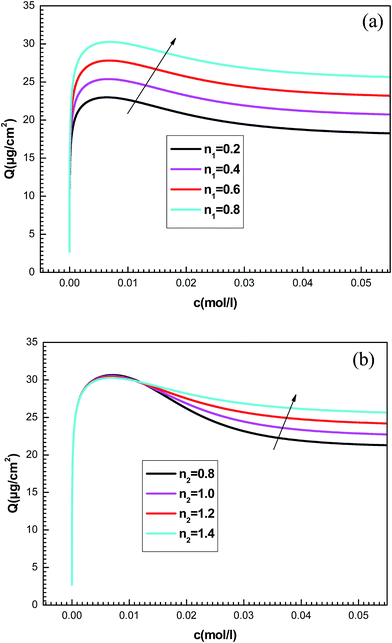
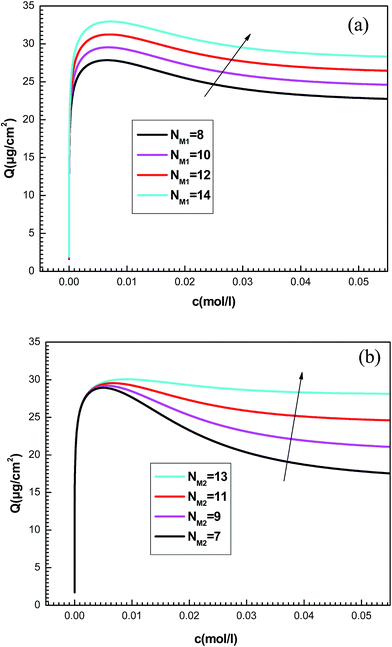
To better understand the physical significance of the six physico-chemical parameters: n1, n2, NM1, NM2, c1 and c2 of the new model with two energy levels, the effect of each parameter on the adsorption isotherms of potassium and cesium onto hepta-helicene will be investigated.The effect of such steric parameters on the adsorption process may be understood from Fig. 7 where the relationship between the adsorbed quantity and the adsorbate concentration is plotted for four values of n1 and n2. We can note that the number of ions per site n1 and n2 are relevant in the behavior of the isotherm. Indeed, the greater the value of n1 and n2, the greater is the adsorbed quantity for both systems. We can also notice that the parameter n1 acts on the first part of the isotherm until saturation, and then the parameter n2 is manifested beyond the first partial saturation due to energetic consideration. In fact, the receptor sites that have the stronger energy will be rapidly and easily occupied. However, at low concentrations, only the first-type receptor sites are occupied. Then the number of ions per site n2 intervenes after the first partial saturation, which is relevant at high concentration when the totality of receptor sites is occupied.
 | ||
| Fig. 8 Influence of the number of the density of receptor sites NM1 (a) and NM2 (b) on the plots of adsorption isotherms. | ||
The quantities NM1 and NM2 are parameters associated with the number of receptor sites and, thus, a steric coefficients. These constants are responsible for the receptor sites accessible to adsorbate ions. We can notice that the influence of NMi(i=1, 2) is similar as that observed for ni(i=1, 2) because these four constants are steric parameters related to the monolayer formation. It can also be noted that the increase of NM1 and NM2 values is followed by the rise of the adsorbed quantity. This is due to the high probability of finding a sufficient number of empty sites to be occupied by the adsorbates.
 | ||
| Fig. 9 Effect of concentrations at half-saturation c1 (a) and c2 (b) on the shapes of adsorption isotherms given by the new model. | ||
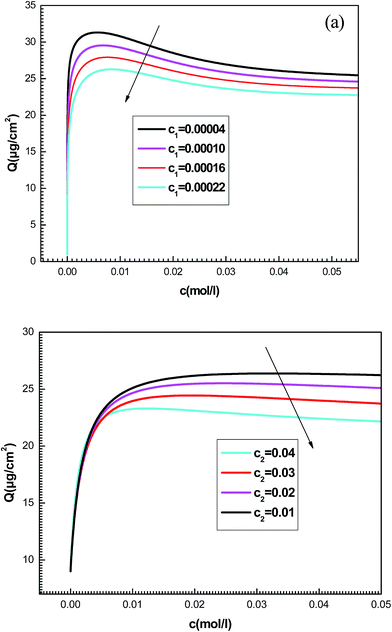
We notice that c1 is the concentration at half-saturation which changes the shape of isotherms at low concentrations and c2 is the concentration at half saturation which intervenes at high concentration. By increasing c1, we notice that the adsorption is delayed with concentration. The greater the value of c1 is, the lower the adsorbed amount becomes. Also the rise in the value of the constant c2 decreases the adsorbed quantity at high concentrations. A simple question can arise regarding the physical meaning of c1 and c2 and why they govern the dynamics of adsorption.
This can be easily understood if we observe that both c1 and c2 are functions of the specific adsorption energies (−ΔE1a) and (−ΔE2a) (kJ mol−1) of the ions on receptor sites which are stated in the expressions (14) and (15). c1 increases as adsorption energy increases algebraically (decreases in module). Therefore, at large values of c1 and c2 that correspond to low energies values in module, i.e. a low binding energy, the adsorption is reduced. Therefore, we can conclude that the receptor sites that have the stronger energy will be rapidly occupied and the adsorbed amount becomes more important.
The different parameter values of the fitted adsorption isotherms of K+ and Cs+ ions and their evolutions versus temperature will be interpreted in the following section.
4. Microscopic study of adsorption processes
The parameters deduced from the fitting of the experimental adsorption isotherms by numerical simulation are presented in Table 5.| Isotherms | T = 298 K | T = 303 K | T = 308 K | T = 313 K |
|---|---|---|---|---|
| System (a): potassium–helicenes | n1 = 0.76723 | n1 = 0.85923 | n1 = 0.89974 | n1 = 0.98655 |
| n2 = 1.02397 | n2 = 1.04551 | n2 = 1.07407 | n2 = 1.08035 | |
| NM1 = 12.20231 | NM1 = 13.63313 | NM1 = 14.73793 | NM1 = 17.04737 | |
| NM2 = 11.9603 | NM2 = 12.07024 | NM2 = 13.32572 | NM2 = 16.42445 | |
| w1 = 0.00002 | w1 = 0.00003 | w1 = 0.00004 | w1 = 0.00006 | |
| w2 = 0.0002 | w2 = 0.00015 | w2 = 0.005 | w2 = 0.006 | |
| c1 = 0.0002 | c1 = 0.00025 | c1 = 0.00027 | c1 = 0.00028 | |
| c2 = 0.01008 | c2 = 0.01652 | c2 = 0.01379 | c2 = 0.01546 | |
| System (b): cesium–helicenes | n1 = 0.61511 | n1 = 0.73827 | n1 = 0.86247 | n1 = 0.88247 |
| n2 = 1.00164 | n2 = 1.03456 | n2 = 1.06478 | n2 = 1.09813 | |
| NM1 = 8.12675 | NM1 = 10.31894 | NM1 = 11.85264 | NM1 = 13.09462 | |
| NM2 = 7.21648 | NM2 = 10.31587 | NM2 = 12.31584 | NM2 = 14.9998 | |
| w1 = 0.00003 | w1 = 0.00004 | w1 = 0.00005 | w1 = 0.0006 | |
| w2 = 0.001 | w2 = 0.003 | w2 = 0.00041 | w2 = 0.005 | |
| c1 = 0.00301 | c1 = 0.00336 | c1 = 0.00302 | c1 = 0.00265 | |
| c2 = 0.07587 | c2 = 0.06324 | c2 = 0.06989 | c2 = 0.07994 |
4.1. Steric interpretations
Concerning the number of adsorbed ions per site n2, they are always greater than the unit for both systems at the four temperatures. So, two adsorbate ions can be gathered in solution forming a kind of aggregate and can be anchored on one site.
n2 is normally an integer but its fitted values are not, since they are an average of some successive integer values. For example, the value of n2 is equal to 1.02 for the adsorption of K+ at 298 K. In the same way n2 can be deduced as average value between two successive integers 1 and 2. This means that the receptor site will be occupied by one or two ions with the respective percentages x and (1 − x). Then, we can write: 1.02 = 1 × x + (1 − x) × 2 which gives a rate of 98% of receptor sites are occupied by one ion and 2% of receptor sites are occupied by two ions indicating that no aggregation occurred prior and during the adsorption process. This is simply due to the repulsive electrostatic positive charge of adsorbate ions K+ and Cs+.
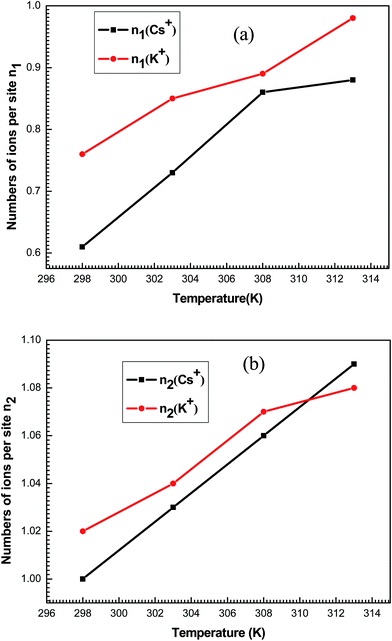
The variation versus temperature of the numbers of ions per sites n1 and n2 is reported in Fig. 10. It is shown that the numbers of adsorbed ions n1 and n2 for the studied systems increased with the temperature. This is due to the thermal agitation effect.
The densities NM1 and NM2 notably increase (Fig. 11) versus temperature for both systems. Indeed, these densities for each ion are relatively similar to the corresponding n1 and n2. So, it can be noted that the increase in temperature allow the formation of supplementary active sites that are hidden at low temperatures due probably to energetic reasons which leads to an increase in the amount of adsorbed ions.
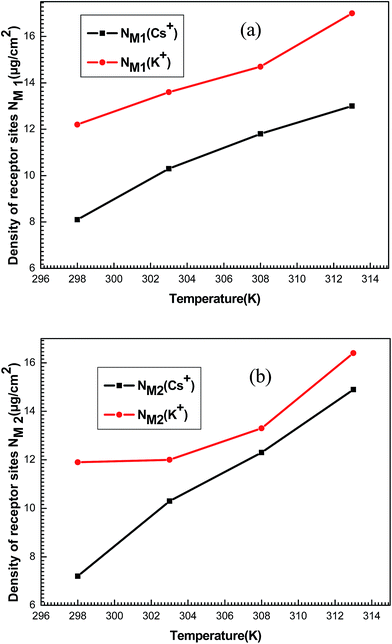 | ||
| Fig. 11 Evolution of the densities of receptor sites NM1 (a) and NM2 (b) of potassium and cesium in function of temperature. | ||
However, it is not possible to predict what kind of chemical or physical binding of the molecule with the receptor sites. Nevertheless, from the binding energy, i.e., adsorption energies (−ΔE1a) and (−ΔE2a) we can propose some different cases, which are plausible with the numerical values.
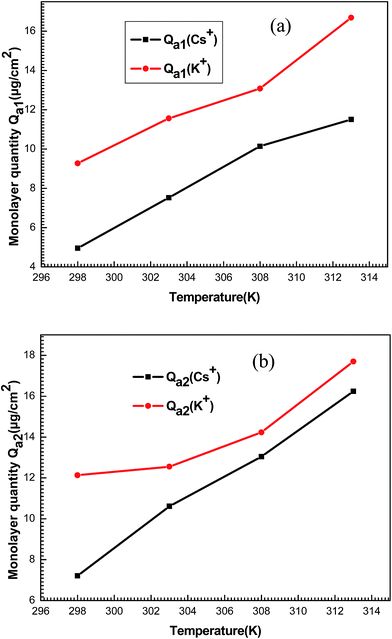 | ||
| Fig. 12 Behavior of monolayer adsorbed quantities Qa1 (a) and Qa2 (b) of potassium and cesium ions as a function of temperature. | ||
It can be seen that the values increased with increased temperature. This behavior is not seen commonly and it can be explained using the correlation of the steric parameters (n1, n2, NM1 and NM2). Aforementioned, the numbers of ions on per site and the densities of receptor sites increased depending on the temperature. Consequently, the behavior of these steric parameters led to the increase of the monolayer adsorbed quantities with the temperature.
The adsorption process is governed by the previous parameters. Nevertheless, these parameters cannot explain the decrease of adsorbed quantities after partial saturation. Then, the energetic parameters c1 and c2 can explain this behavior. Therefore, the adsorption energies constitute a dominant factor of the adsorption process.
4.2. Energetic interpretations and adsorption energies
In general, the adsorption process is controlled by the adsorption energy. The molar adsorption energies (−ΔE1a) and (−ΔE2a) characterize the interactions between the adsorbate ions and the adsorbent surface. Using the values of the parameters w1 and w2 given in eqn (23) and (24) the adsorption energies can be written as:
−ΔE1a = RT![[thin space (1/6-em)]](https://www.rsc.org/images/entities/char_2009.gif) ln(w1/csi) ln(w1/csi)
| (25) |
−ΔE2a = RT![[thin space (1/6-em)]](https://www.rsc.org/images/entities/char_2009.gif) ln(w2/csi) ln(w2/csi)
| (26) |
According to the literature, the type of interaction can be classified, to a certain extent, by the magnitude of the change in adsorption energy. Physical adsorptions such as hydrogen bonding or van der Waals forces usually prove energies values |ΔEa| < 30 kJ mol−1.40,41 Other physical adsorption mechanisms such as electrostatic interactions were between 10 and 50 kJ mol−1.42 Whereas, chemical adsorptions such as covalent binding force or ionic link are usually |ΔEa| > 80 kJ mol−1.47 The calculated adsorption energies are illustrated in Tables 6 and 7.
| T (K) | −ΔE1a (kJ mol−1) | −ΔE2a (kJ mol−1) |
|---|---|---|
| 298 | −35.66 | −25.96 |
| 303 | −35.70 | −25.21 |
| 308 | −36.09 | −25.80 |
| 313 | −36.58 | −26.59 |
| T (K) | −ΔE1a (kJ mol−1) | −ΔE2a (kJ mol−1) |
|---|---|---|
| 298 | −33.02 | −23.05 |
| 303 | −33.29 | −23.31 |
| 308 | −34.13 | −24.04 |
| 313 | −35.01 | −24.67 |
One can note that the different values of the adsorption energies |ΔEa| are <40 kJ mol−1, which imply that the adsorption of K+ and Cs+ ions on hepta-helicenes take place via physical adsorption such binding is electrostatic interactions. These findings are agree with the work elaborated by Tan et al.43 and Tsuzuki et al.44 which suggest that the interaction of [7]-helicene with alkali cations brings in the important problem of cation–π interactions43–46 constitute a general non-covalent binding force. So, the alkali metals are physisorbed onto the adsorbent helicenes.
It is also noted that the adsorption energies of K+ are superior to Cs+ which imply that K+–helicene is more stable than the complex Cs+–helicene. Such proposition is agree with the work of Saini et al.47 which elucidate that the helicene can be used as a biosensor of K+ and Cs+ with same order of stability.
5. Conclusion
The adsorption of potassium and cesium ions onto hepta-Helicens molecules was studied by the grand canonical ensemble in statistical physics, to find new microscopic interpretations. The adsorption measurements have been carried out using a quartz crystal microbalance. A new statistical model with two energies was developed and applied for these systems. It was found that the proposed statistical treatment is sufficiently flexible to give a good representation of experimental data. Some physicochemical parameters related to the adsorption process were introduced in the analytical model expression and they were directly obtained from the fitting of the experimental adsorption isotherms by numerical simulation.These parameters are divided into two types. The first type of parameters contains four main parameters, namely the number of ions per site, n1 and n2, and the densities of receptor sites NM1 as well as NM2. The second type of parameters is mainly the two energetic parameters c1 and c2 which respectively referred to the concentrations at half saturations.
The fitting values of n1 and n2 show that the numbers of adsorbed ions K+ and Cs+ increased with the temperature which is due to the thermal agitation effect. The study of the density of receptor sites NM1 and NM2 indicates that when the temperature increases new hidden sites appear and participate in the adsorption which leads to an increase in the amount of adsorbed ions. The values of the adsorption energies obtained through the model indicated that both adsorptions processes were typical of a physisorption which electrostatic interactions are involved, the [7]-helicene could function as potassium and cesium sensor and the K+–helicene complex is more stable than the Cs+–helicene complex.
Conflicts of interest
There are no conflicts to declare.References
- Y. Shen and C. F. Chen, Chem. Rev., 2012, 112, 1463 CrossRef CAS PubMed.
- M. Gingras, Chem. Soc. Rev., 2013, 42, 968 RSC.
- F. Torricelli, J. Bosson, C. Besnard, M. Chekini, T. Burgi and J. Lacour, Angew. Chem., Int. Ed., 2013, 52, 1796 CrossRef CAS PubMed.
- Y. Nakai, T. Mori and Y. Inoue, J. Phys. Chem. A, 2013, 117, 83 CrossRef CAS PubMed.
- M. J. Fuchter, J. Schaefer, D. K. Judge, B. Wardzinski, M. Weimar and I. Krossing, Dalton Trans., 2012, 41, 8238 RSC.
- K. Nakano, H. Oyama, Y. Nishimura, S. Nakasako and K. Nozaki, Angew. Chem., Int. Ed., 2012, 51, 695 CrossRef CAS PubMed.
- T. J. Katz and J. Pesti, J. Am. Chem. Soc., 1982, 104, 346 CrossRef CAS.
- A. Sudhakar and T. J. Katz, J. Am. Chem. Soc., 1986, 108, 179 CrossRef CAS.
- J. Bosson, J. Gouin and J. Lacour, Chem. Soc. Rev., 2014, 43, 2824 RSC.
- Y. Xu, Y. X. Zhang, H. Sugiyama, T. Umano, H. Osuga and K. Tanaka, J. Am. Chem. Soc., 2004, 126, 6566 CrossRef CAS PubMed.
- D. Z. G. Wang and T. J. Katz, J. Org. Chem., 2005, 70, 8497 CrossRef CAS PubMed.
- N. Takenaka, J. Chen, B. Captain, R. S. Sarangthem and A. Chandrakumar, J. Am. Chem. Soc., 2010, 132, 4536–4537 CrossRef CAS PubMed.
- I. Sato, R. Yamashima, K. Kadowaki, J. Yamamoto, T. Shibata and K. Soai, Angew. Chem., Int. Ed., 2001, 40, 1096 CrossRef CAS PubMed.
- F. G. Klärner and B. Kahlert, Acc. Chem. Res., 2003, 36, 919 CrossRef PubMed.
- M. Harmata, Acc. Chem. Res., 2004, 37, 862 CrossRef CAS PubMed.
- C. W. Chen and H. W. Whitlock Jr, J. Am. Chem. Soc., 1978, 100, 4921 CrossRef CAS.
- M. P. Johansson and M. Patzschke, Chem.–Eur. J., 2009, 15, 13210 CrossRef CAS PubMed.
- R. H. Janke, G. Haufe, E. U. Würthwein and J. H. Borkent, J. Am. Chem. Soc., 1996, 118, 6031 CrossRef CAS.
- S. Grimme and S. D. Peyerimhoff, J. Chem. Phys., 1996, 204, 411 CAS.
- J. M. Schulman and R. L. Disch, J. Phys. Chem. A, 1999, 103, 6669 CrossRef CAS.
- H. M. Sobell, Actinomycin and DNA transcription, Proc. Natl. Acad. Sci. U. S. A., 1985, 82, 5328–5331 CrossRef CAS.
- G. Sener, E. Ozgur, E. Yılmaz, L. Uzun, R. Say and A. Denizli, Biosens. Bioelectron., 2010, 26, 815 CrossRef CAS PubMed.
- J. Rickert, T. Weiss, W. Kraas, G. Jung and W. Göpel, Biosens. Bioelectron., 1996, 11, 591 CrossRef CAS.
- C. K. O'Sullivan and G. G. Guilbault, Biosens. Bioelectron., 1999, 14, 663 CrossRef.
- T. Nomura and M. Okuhara, Anal. Chim. Acta, 1982, 142, 281 CrossRef CAS.
- K. Park, M. Koh, C. Yoon and H. H. Kim, J. Supercrit. Fluids, 2004, 29, 203 CrossRef CAS.
- P. Skládal, J. Braz. Chem. Soc., 2003, 14, 1678 CrossRef.
- A. J. Bard and C. G. Zoski, Electroanalytical Chemistry: A Series of Advances, CRC PressTaylor & Francis Group, USA, 2013 Search PubMed.
- S. Knani, M. Mathlouthi and A. Ben Lamine, Food Biophys., 2007, 2, 183 CrossRef.
- M. Ben Yahia, L. B. H. Hsan, S. Knani, M. Ben Yahia, H. Nasri and A. B. Lamine, J. Mol. Liq., 2016, 222, 576 CrossRef.
- B. Diu, C. Guthmann, D. Lederer and B. Roulet, Physique Statistique, Hermann, Paris, 1989 Search PubMed.
- S. Knani, F. Aouaini, N. Bahloul, M. Khalfaoui, M. A. Hachicha, A. Ben Lamine and N. Kechaou, Phys. A, 2014, 400, 57 CrossRef CAS.
- M. Ben Yahia, F. Aouaini, M. A. Hachicha, S. Knani, M. Khalfaoui and A. Ben Lamine, Phys. B, 2013, 419, 100 CrossRef CAS.
- L. Sellaoui, S. Knani, A. Erto, M. A. Hachicha and A. Ben Lamine, Fluid Phase Equilib., 2016, 408, 259 CrossRef CAS.
- F. Aouaini, S. Knani, M. Ben Yahia, N. Bahloul, N. Kechaou and A. Ben Lamine, Drying Technol., 2014, 32, 1905 CrossRef CAS.
- D. W. Marquardt, J. Soc. Ind. Appl. Math., 1963, 11, 431 CrossRef.
- A. Nakhli, M. Bergaoui, M. Khalfaoui, J. Mollmer, A. Moller and A. Ben Lamine, Adsorption, 2014, 20, 987 CrossRef CAS.
- S. Knani, M. Khalfaoui, M. A. Hachicha, A. Ben Lamine and M. Mathlouthi, Food Chem., 2012, 132, 1686 CrossRef CAS.
- G. L. Dotto, L. A. Pinto, M. A. Hachicha and S. Knani, Food Chem., 2015, 171, 1 CrossRef CAS PubMed.
- B. von Oepen, W. Kördel and W. Klein, Chemosphere, 1991, 22, 285 CrossRef CAS.
- C. Ye, N. Hu and Z. Wang, J. Taiwan Inst. Chem. Eng., 2012, 44, 74 CrossRef.
- Y. Wang, Y. Qi, Y. Li, J. Wu, X. Ma, C. Yu and L. Ji, J. Hazard. Mater., 2013, 260, 9 CrossRef CAS PubMed.
- X. J. Tan, W. L. Zhu, M. Cui, X. M. Luo, J. D. Gu, I. Silman, J. L. Sussman, H. L. Jiang, R. Y. Ji and K. X. Chen, J. Phys. Chem. Lett., 2001, 349, 113 CrossRef.
- S. Tsuzuki, M. Yoshida, T. Uchimaru and M. Mikami, J. Phys. Chem. A, 2001, 105, 769 CrossRef CAS.
- J. C. Ma and D. A. Dougherty, Chem. Rev., 1997, 97, 1303 CrossRef CAS PubMed.
- J. Sunner, K. Nishizawa and P. Kebarle, J. Phys. Chem., 1981, 85, 1814 CrossRef CAS.
- S. Saini and B. M. Deb, Indian J. Chem., Sect. A: Inorg., Bio-inorg., Phys., Theor. Anal. Chem., 2007, 46, 9 Search PubMed.
| This journal is © The Royal Society of Chemistry 2017 |


