 Open Access Article
Creative Commons Attribution 3.0 Unported Licence
Novel layer-by-layer self-assembled peptide nanocarriers for siRNA delivery†
Betül Bozdoğan a,
Öznur Akbal‡
 ab,
Ekin Çelik‡
 cd,
Mustafa Türk
 e and
Emir Baki Denkbaş
 *f
*f
aNanotechnology and Nanomedicine Division, Hacettepe University, Beytepe, Ankara, Turkey
bPolatlı Faculty of Art and Sciences, Gazi University, Polatli, Ankara, Turkey
cBioengineering Division, Hacettepe University, Beytepe, Ankara, Turkey
dAdvanced Technologies Application and Research Center, Hacettepe University, Beytepe, Ankara, Turkey
eDepartment of Bioengineering, Faculty of Engineering, Kirikkale University, Kirikkale, Turkey
fChemistry Department, Hacettepe University, Beytepe, Ankara, Turkey. E-mail: denkbas@hacettepe.edu.tr
First published on 10th October 2017
Abstract
All complex and functional structures of nature consist of simple building blocks that are thermodynamically balanced and self-assembled at the molecular level. Production of functional bio-nanomaterials with molecular self-assembly mechanisms, based on a bottom-up approach, has become increasingly important in recent years. In this study, a biodegradable and biocompatible siRNA nanocarrier system, consisting of diphenylalaninamide (FFA) based nanoparticles, was developed for silencing of HER2, a gene known to be overexpressed in breast cancer. FFA contains an amide functional group that has a dipolar nature with zero net charge. Here we report an original approach to functionalizing peptide nanoparticles based on layer-by-layer polyelectrolyte deposition (LbL PD) technique. The resulting well-defined FFA nanoparticles (FFANPs) were coated with polycationic poly-L-lysine (PLL) by cation–dipole interaction, giving rise to a net positive surface charge. The PLL coating improved the physical stability of FFANPs at physiological pH and temperature. The cationized FFANP was then interacted with the polyanionic siRNA, forming an FFANP–PLL/siRNA complex. Nanoparticles were then interacted with PLL one more time, to create a third layer that can prevent degradation of the siRNA by nucleases and achieve effective delivery of the siRNA into the cytoplasm. These original FFANP–PLL/siRNA/PLL were optimized to achieve efficient in vitro gene silencing. Overall, this study shows that FFANP–PLL/siRNA/PLL are promising gene carriers for gene silencing therapies.
Introduction
RNA interference (RNAi) is a commonly studied gene silencing mechanism that uses siRNAs to prevent protein expression at the post-transcriptional level. Although there are many materials used as nanocarriers, challenges in the effective delivery of siRNAs are not yet fully overcome.1 siRNA delivery systems such as liposomes and polymeric nanoparticles are mainly used, some of which are made from self-assembled materials.2–4 Self-assembly is the most basic mechanism involved in the formation of many structures in nature. It is also a fabrication method for nanocarriers, especially for those with biomolecules (proteins, peptides, lipids, and DNAs) as building blocks. Therefore, by using environmental triggers (such as pH, temperature, and light), biomolecules have often been used to design “smart carriers” for delivering bioactive agents, particularly in living systems.5–9 Self-assembly of peptides was first shown with surfactant-like peptides containing a hydrophilic head and hydrophobic tail, forming peptide nanosphere structures.10Amyloid-derived peptides are the most important peptides used for self-assembly into nanostructures. Amyloid peptides are mainly associated with amyloidosis diseases like Alzheimer's, Prion, Parkinson's, Creutzfeldt–Jakob's, and type-II diabetes. Deposition of β-amyloid peptide (Aβ) on tissues and organs leads to the development of neurodegenerative disorders.11 Diphenylalanine (FF) peptide, the structural motif of the β-amyloid polypeptide, is currently being used as a building block for nanocarrier fabrication. Many studies with FF dipeptides and their derivatives (such as cationic FF, Fmoc-FF, and Boc-FF) report that this peptide can be organized into rings, ellipses, discs, and bowls outside of spherical or tubular structures.12,13 The self-assembly process depends on the concentration and the precise balance of interactions between peptide–peptide and peptide–water molecules. The FF nanostructures are stable due to T-shaped aromatic stacking, intermolecular hydrogen bonds between peptide–peptide, and peptide–water hydrogen bonds. Their simple structure, ease of chemical modification, biocompatibility, and ability to be regulated under different conditions have led to a great deal of interest in FF peptides as drug delivery systems.14–16 Yan et al. were the first to show that cationic FF molecules can be used as gene and drug carriers by regulating the nanovesicles at physiological pH.17,18 Cationic FF molecules have been the subject of many studies to investigate their applications as carriers or sensor components. They can be arranged into nanoparticles with molecular self-assembly mechanisms under different stimuli and conditions.19,20 However, a common problem encountered in all these studies is that the resulting peptide nanoparticles are not stable, and they can change their morphology to accommodate changing ambient conditions. Zhang et al. were the first to develop stable FF-based nanostructures for use as drug carriers.21 These stable nanostructures exhibit high biocompatibility and superior biodegradability.
In this report, nanoparticles were prepared with diphenylalaninamide (FFA), a derivative of FF dipeptide. These nanoparticles were investigated for the successful delivery of siRNA to the HER2 gene in a human breast cancer cell line. To overcome the challenges of siRNA delivery, FFA nanoparticles (FFANPs) were modified using the layer-by-layer polyelectrolyte deposition (LbL PD) technique. The LbL PD technique relies on the adsorption mechanism in a multi-layered approach, in which at least two types of polymers having affinity for each other are attached to the surface.22,23 In this study, polycationic poly-L-lysine (PLL) was added for FFANP dispersion and it adsorbed to the nanoparticle surface by cation–dipole interaction to create the first layer. Then, FFANPs cationized with the PLL layer were interacted with polyanionic siRNA to form the second layer. To form the third layer, nanoparticles were again coated with PLL, which provided a positive charge to the FFANPs. The third layer also protected the siRNA molecule from nuclease activity and facilitated its cellular uptake. Entrapment efficiency (EE) and loading capacity (LC) of siRNA in the nanoparticles was evaluated also release studies were performed. The ability of the designed nanoparticles to be used as a siRNA carrier was assessed by measuring HER2 gene expression levels of BT-474 cells transfected with these nanoparticles. Furthermore, immunocytochemistry studies were carried out to support the results obtained. To the best of our knowledge, this is the first report of the synthesis of stable self-assembled FF-based nanoparticles modified with PLL for use in gene delivery.
Experimental
Chemicals
FFA (H-Phe-Phe-NH2·HCl) was purchased from Bachem (Bubendorf, Switzerland). HFIP (1,1,1,3,3,3-hexafluoro-2-propanol) was purchased from Merck (Darmstadt, Germany); glutaraldehyde (GA) and α-poly-L-lysine hydrobromide (α-PLL, M (monomer, Lys·HBr, C6H13N2OBr) = 209.09 g mol−1, Mw = 15![[thin space (1/6-em)]](https://www.rsc.org/images/entities/char_2009.gif) 000–30
000–30![[thin space (1/6-em)]](https://www.rsc.org/images/entities/char_2009.gif) 000 g mol−1) were purchased from Sigma-Aldrich (St. Louis, MO, USA). Instead of the molar concentration of PLL, the molar concentration of the lysine repeating units was used in measurements. Stock PLL solution (22 mM) was dialyzed against dH2O to remove toxic hydrobromide. All reagents were commercially available and used without further purification unless otherwise noted. Ultrapure water with a resistivity of 18.2 MΩ was used in all experiments.
000 g mol−1) were purchased from Sigma-Aldrich (St. Louis, MO, USA). Instead of the molar concentration of PLL, the molar concentration of the lysine repeating units was used in measurements. Stock PLL solution (22 mM) was dialyzed against dH2O to remove toxic hydrobromide. All reagents were commercially available and used without further purification unless otherwise noted. Ultrapure water with a resistivity of 18.2 MΩ was used in all experiments.
Synthesis and characterization of FFANPs
![[thin space (1/6-em)]](https://www.rsc.org/images/entities/char_2009.gif) :
:![[thin space (1/6-em)]](https://www.rsc.org/images/entities/char_2009.gif) GA = 1
GA = 1![[thin space (1/6-em)]](https://www.rsc.org/images/entities/char_2009.gif) :
:![[thin space (1/6-em)]](https://www.rsc.org/images/entities/char_2009.gif) 1). The solution was then incubated at room temperature overnight to complete cross-linking and self-assembly. The solution became cloudy with formation of the nanoparticles. Finally, the resulting suspension was ultracentrifuged (12
1). The solution was then incubated at room temperature overnight to complete cross-linking and self-assembly. The solution became cloudy with formation of the nanoparticles. Finally, the resulting suspension was ultracentrifuged (12![[thin space (1/6-em)]](https://www.rsc.org/images/entities/char_2009.gif) 000 rpm, 10 min) and washed with ultrapure water three times to remove excess HFIP and residual GA. The FFANPs were kept in ultrapure water at 4 °C for use in further experiments.
000 rpm, 10 min) and washed with ultrapure water three times to remove excess HFIP and residual GA. The FFANPs were kept in ultrapure water at 4 °C for use in further experiments.![[thin space (1/6-em)]](https://www.rsc.org/images/entities/char_2009.gif) :
:![[thin space (1/6-em)]](https://www.rsc.org/images/entities/char_2009.gif) water (1
water (1![[thin space (1/6-em)]](https://www.rsc.org/images/entities/char_2009.gif) :
:![[thin space (1/6-em)]](https://www.rsc.org/images/entities/char_2009.gif) 1, v/v) at a concentration of 10 mg mL−1. MALDI samples were prepared by mixing peptides to be analysed with aforementioned matrices (1
1, v/v) at a concentration of 10 mg mL−1. MALDI samples were prepared by mixing peptides to be analysed with aforementioned matrices (1![[thin space (1/6-em)]](https://www.rsc.org/images/entities/char_2009.gif) :
:![[thin space (1/6-em)]](https://www.rsc.org/images/entities/char_2009.gif) 5, v/v). Subsequently, 0.5 μL of this mixture was dropped on the sample plate and dried at room temperature.
5, v/v). Subsequently, 0.5 μL of this mixture was dropped on the sample plate and dried at room temperature.Preparation and characterization of FFANPs as gene carrier by layer-by-layer polyelectrolyte deposition
LbL assembly was employed to coat FFA nanoparticles to achieve siRNA transport. In brief, to prepare the first polycation layer on the nanoparticle surface, a stock PLL solution (22 mM) was added drop by drop to the FFANP dispersion (1 mg mL−1) at different ratio of amide groups of FFA to amine groups of PLL (Ad/An) under constant stirring. The mixture was incubated under constant stirring in a dark at room temperature for 2 h to complete adsorption. After incubation, the nanoparticles were precipitated (12![[thin space (1/6-em)]](https://www.rsc.org/images/entities/char_2009.gif) 000 rpm, 10 min) and washed 3 times to remove unbound and weakly bound PLL. This prevented undesired complexes between free PLL and siRNA during the adsorption of the next polyelectrolyte layer. Later, to coat with the second layer, stock polyanion siRNA solution (6.7 μM) was added dropwise to the FFANP-PLL dispersion. Final concentrations of siRNA were 27, 50, 100, 130, 200, and 260 nM. After the mixture was incubated for 2 h under constant stirring at room temperature, the resulting FFANP–PLL–siRNA was precipitated (12
000 rpm, 10 min) and washed 3 times to remove unbound and weakly bound PLL. This prevented undesired complexes between free PLL and siRNA during the adsorption of the next polyelectrolyte layer. Later, to coat with the second layer, stock polyanion siRNA solution (6.7 μM) was added dropwise to the FFANP-PLL dispersion. Final concentrations of siRNA were 27, 50, 100, 130, 200, and 260 nM. After the mixture was incubated for 2 h under constant stirring at room temperature, the resulting FFANP–PLL–siRNA was precipitated (12![[thin space (1/6-em)]](https://www.rsc.org/images/entities/char_2009.gif) 000 rpm, 10 min), washed 3 times, and resuspended in ultrapure water. To determine entrapment efficiency (EE) and loading capacity (LC) of siRNA in the nanoparticles, supernatants from washing step were collected and measured for siRNA content using a Ribogreen kit (Thermo Fisher Scientific, Waltham, MA, USA) according to the manufacturer's protocol. EE and LC were calculated as previously reported.24
000 rpm, 10 min), washed 3 times, and resuspended in ultrapure water. To determine entrapment efficiency (EE) and loading capacity (LC) of siRNA in the nanoparticles, supernatants from washing step were collected and measured for siRNA content using a Ribogreen kit (Thermo Fisher Scientific, Waltham, MA, USA) according to the manufacturer's protocol. EE and LC were calculated as previously reported.24
The final PLL coating was applied to the FFANP–PLL–siRNA as mentioned previously. LbL PD was evaluated by zeta potential measurements, SEM analyses, and statistical calculations using the ImageJ program on images obtained from SEM analyses.
Release studies of siRNA from gene carriers
Release of siRNA from the FFANP–PLL/siRNA and FFANP–PLL/siRNA/PLL was evaluated in buffer solutions with pH 7.4 (0.01 M phosphate buffer, PB), pH 5.5 (0.01 M acetate buffer), and pH 4.0 (0.01 M acetate buffer). RNAse-free water was used to prepare the buffer solutions. The pHs were chosen to mimic the blood pH (7.4), endosomal pH (6.0–5.5), and lysosomal pH (4.5–4.0). Briefly, siRNA loaded nanoparticles were suspended in buffer solution (1 mg mL−1) and incubated in a 37 °C shaking water bath for 48 hours. At each predetermined time point, the nanoparticle suspensions were centrifuged (12![[thin space (1/6-em)]](https://www.rsc.org/images/entities/char_2009.gif) 000 rpm, 10 min). The 100 μL of the supernatants from each nanoparticle suspension were collected and their siRNA contents were stained with fluorescence using Ribogreen kit. The fluorescence intensity was measured by CLARIOstar microplate reader (BMG Labtech, Germany). According to the standard curve of siRNA, the percentage of cumulatively released siRNA was calculated.
000 rpm, 10 min). The 100 μL of the supernatants from each nanoparticle suspension were collected and their siRNA contents were stained with fluorescence using Ribogreen kit. The fluorescence intensity was measured by CLARIOstar microplate reader (BMG Labtech, Germany). According to the standard curve of siRNA, the percentage of cumulatively released siRNA was calculated.
Statistical analysis
Experiments were performed in triplicate unless otherwise indicated. Data were analysed using descriptive statistics and presented as mean values ± standard deviation from independent measurements unless otherwise indicated. Statistical comparisons between different treatments were assessed by one-way ANOVA, assuming significance at p < 0.05.In vitro degradation of FFANP and FFANP–PLL
To determine pH-dependent degradation behaviour of FFANP and FFANP–PLL, the following buffer systems were used: pH 7.4 (0.01 M phosphate buffer, PB), pH 5.5 (0.01 M acetate buffer), and pH 4.0 (0.01 M acetate buffer). Briefly, FFANPs were dispersed in the buffer solutions (2 mg per 10 mL) and incubated at 37 °C in the dark for 4 weeks. The turbidity change of nanoparticle dispersions at different time intervals was analysed by a TB 300 IR turbidimeter (Lovibond, Dortmund, Germany). In addition, to check the effect of temperature on the degradation of nanoparticles, FFANP dispersions in ultrapure water were incubated at 4 °C, 25 °C, and 37 °C and turbidity measurements were taken at different time intervals.Enzymatic degradation of FFANP and FFANP–PLL were carried out with trypsin-EDTA (0.25%, Sigma-Aldrich). To do this, nanoparticles at 2 mg mL−1 in PBS pH 7.4 were incubated with 50 μL of trypsin-EDTA and a trace amount of NaN3 (to protect the trypsin from microorganisms) at 37 °C for a week. The degradation results were evaluated with SEM analysis.
Cell culture
The HER2-overexpressed human breast cancer cell line, BT-474 (HTB-20, ATCC), was used in cell culture experiments. Cells were cultured in 25 cm2 flasks with Dulbecco's modified Eagle's medium (DMEM, Sigma-Aldrich), including 10% fetal bovine serum (FBS, Sigma-Aldrich) and 1% L-glutamine (Sigma-Aldrich) and incubated at 37 °C in 5% CO2 humidified atmosphere.Cytotoxicity
Cytotoxic effects of nanoparticles were evaluated with an XTT (2,3-bis-(2-methoxy-4-nitro-5-sulfophenyl)-2H-tetrazolium-5-carboxanilide) assay. Briefly, BT-474 cells were seeded in 96-well plates (5 × 10³ cells per mL) and cultured. After 24 h, the medium was aspirated and fresh medium with a different concentration and formulation of nanoparticles was added to the wells and incubated for 24 h. The medium in every well was replaced with 25 μL of XTT reagent (1 mg mL−1 in PBS) and incubated at 37 °C for 4 h. Cell viability was determined by measuring the absorbance at 450 nm.In vitro siRNA transfection
Transfection studies were performed with two different methods. For transfection with HER2 siRNA (FlexiTube, Qiagen, Hilden, Germany) cells (5 × 10⁴ cells per well) were seeded with antibiotic-free medium in six-well plates 12 h prior to transfection. In the first method, cells were bombarded with 200 μL of 5-fold concentrated gene carrier in serum- and antibiotic-free medium (Transfection Medium, TM) to prevent unwanted protein adsorption to the nanoparticle surface. After 4 h, the wells were diluted 5-fold with serum-containing medium so that final carrier concentration was 1, 2, and 3 mg mL−1. In the second method, transfection agents were prepared directly with the serum-containing medium so that final carrier concentration was 1, 2, and 3 mg mL−1. After 24 h incubation, the medium was replaced with fresh medium. Forty-eight hours after transfection, cells were harvested for cytotoxicity and PCR analysis. Seventy-two hours after transfection cells were collected for immunocytochemistry assay.Polymerase chain reaction (PCR) experiments
RNA isolation and cDNA synthesis were performed with the RNeasy Mini Kit (Qiagen) and QuantiTect Rev. Transcription kits (Qiagen) according to the manufacturer's protocol. Quantitative gene expression analysis was performed with the Viia 7 real-time PCR system (Applied Biosystems) with Qiagen's QuantiTect primer assays and SYBR green master mix. Results were analysed using the ΔΔCT method, via the system's software.Immunocytochemistry
HER2 protein expression was assessed with primary antibody staining (Affymetrix, Santa Clara, CA, USA) via an HRP kit (HRP (RTU), Thermo Scientific), prior to AEC staining (GBI Labs, Bothell, WA, USA). Backgrounds were stained with hematoxylin after antibody staining. Slides were visualized under a light microscope.Results and discussion
Synthesis and characterization of FFANPs
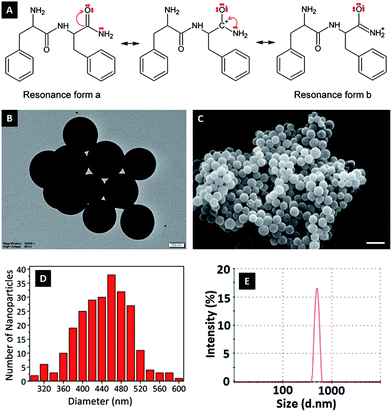
In this study, FFA was crosslinked with GA molecules to form peptide nanoparticles. The amide carbonyl group of diphenylalanine has strong electron attractive forces because of the double bond between carbon and the electronegative oxygen atom and the attraction of the nonbonded electrons (NBEs) of nearby nitrogen, inducing a conjugate system where these electrons act as delocalized electrons. In this case, it is more convenient to address the molecule as two or more resonance forms, instead of one (Fig. 1A). Delocalization phenomena indicate electron density is diffused in a broad area, where these electrons are in constant movement, ensuring the molecule has high resonance stability. The electron attractive force of this conjugated system hinders the interaction of nitrogen atoms with electrophiles. In addition, the electron delocalization that is formed limits the electrophilic nature of the carbonyl groups at amides, causing the amide group to have the weakest reactivity among the functional groups.25GA is an aggressive carbonyl compound and is known as an amine reactive homobifunctional crosslinker. Its aldehyde groups at both end form bonds with amine groups of proteins via Schiff base (–C![[double bond, length as m-dash]](https://www.rsc.org/images/entities/char_e001.gif) N–) formation. Oligomeric GA molecules formed by the aldol reaction form Schiff base bonds with the reactive amine ends of FFA molecules, resulting in FFA–(GA)2–FFA and FFA–(GA)3–FFA dimers. Therefore, the resultant FFA dimers have amide functional groups at both ends. As mentioned in the literature crosslinked dimers self-assemble to form peptide nanoparticles via nucleation-controlled growth.21,26
N–) formation. Oligomeric GA molecules formed by the aldol reaction form Schiff base bonds with the reactive amine ends of FFA molecules, resulting in FFA–(GA)2–FFA and FFA–(GA)3–FFA dimers. Therefore, the resultant FFA dimers have amide functional groups at both ends. As mentioned in the literature crosslinked dimers self-assemble to form peptide nanoparticles via nucleation-controlled growth.21,26
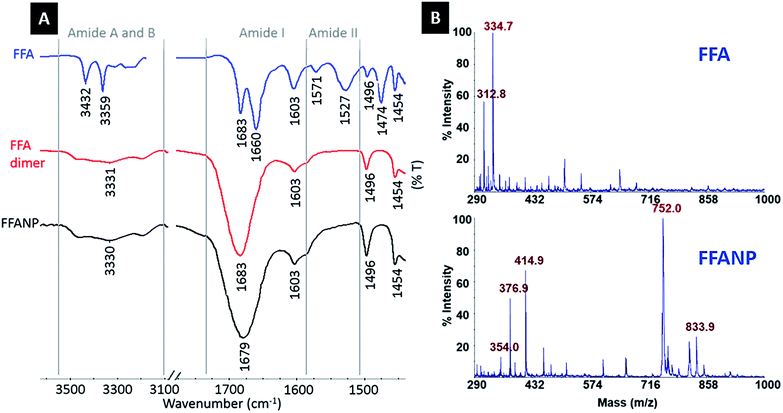 | ||
| Fig. 2 (A) FTIR spectra of FFA dipeptide, FFA dimers, and FFANPs. (B) MALDI-MS spectra of FFA dipeptide, FFA dimers. | ||
Amide I (C![[double bond, length as m-dash]](https://www.rsc.org/images/entities/char_e001.gif) O stretching) and amide II (N–H bending) bands are commonly used to interpret changes in protein structure and conformation. As mentioned previously, the C
O stretching) and amide II (N–H bending) bands are commonly used to interpret changes in protein structure and conformation. As mentioned previously, the C![[double bond, length as m-dash]](https://www.rsc.org/images/entities/char_e001.gif) O stretching vibrations of FFA structures seen at 1683 cm−1 and 1660 cm−1 form the amide I band, together with –NH2 bending vibration at 1603 cm−1. Vibrations representing –NH bending at 1571 cm−1 and 1527 cm−1 form the typical amide II band.
O stretching vibrations of FFA structures seen at 1683 cm−1 and 1660 cm−1 form the amide I band, together with –NH2 bending vibration at 1603 cm−1. Vibrations representing –NH bending at 1571 cm−1 and 1527 cm−1 form the typical amide II band.
Absorption at 1660 cm−1 on the amide I band and 1527 cm−1 and 1571 cm−1 on the amide II band of the FFA dipeptide (blue spectrum) indicate β-turn secondary structures, whereas the absorption peak at 1683 cm−1 on the amide I band is correlated with antiparallel β-sheet formation.29–32 The absorption at 1660 cm−1 is higher than the absorption at 1683 cm−1, indicating the dominance of the β-turn configuration in the FFA dipeptide. After crosslinking with GA, absorption disappears at 1527, 1571, and 1660 cm−1 and increases at the 1683 cm−1 peak in FFA–(GA)n–FFA (red spectrum) and FFANP (black spectrum) spectra, proving adaptation of an antiparallel β-sheet arrangement.21,32–34 This shows that the FFA dipeptide has a structural transition through crosslinking with GA, during nanoparticle formation.
The H-bond is one of the possible forces that may be effective in the self-assembly of the FF dipeptide to a nanostructure.35–37 There is a strong correlation between C![[double bond, length as m-dash]](https://www.rsc.org/images/entities/char_e001.gif) O stretching frequency and its H-bonding capacity and C
O stretching frequency and its H-bonding capacity and C![[double bond, length as m-dash]](https://www.rsc.org/images/entities/char_e001.gif) O stretching frequency is a sensitive infrared vibrational spectral marker.38 H-bond formation is correlated with a 3–30 cm−1 red shifting and a broadening and increasing of frequency intensity.28,38–40 The amide I regions of FFA–(GA)n–FFA and FFANPs are shown in Fig. 2A. Red shift on C
O stretching frequency is a sensitive infrared vibrational spectral marker.38 H-bond formation is correlated with a 3–30 cm−1 red shifting and a broadening and increasing of frequency intensity.28,38–40 The amide I regions of FFA–(GA)n–FFA and FFANPs are shown in Fig. 2A. Red shift on C![[double bond, length as m-dash]](https://www.rsc.org/images/entities/char_e001.gif) O absorbance at 1683 cm−1 to 1679 cm−1, together with broadening of frequency and increase in intensity indicates hydrogen bonding of C
O absorbance at 1683 cm−1 to 1679 cm−1, together with broadening of frequency and increase in intensity indicates hydrogen bonding of C![[double bond, length as m-dash]](https://www.rsc.org/images/entities/char_e001.gif) O. Amide A and B bands, demonstrating NH stretching frequency levels, are also important for the interpretation of the H-bonding ability of peptides. It is well established that the non-hydrogen bonded N–H is due to higher energy bands, while the lower energy bands correspond to intramolecularly hydrogen bonded N–H.37,41 Large absorption peaks seen at amide A and B regions of FFA dimers and FFANP and low-frequency shoulders indicates the presence of hydrogen bonding of the N–H group.35,42
O. Amide A and B bands, demonstrating NH stretching frequency levels, are also important for the interpretation of the H-bonding ability of peptides. It is well established that the non-hydrogen bonded N–H is due to higher energy bands, while the lower energy bands correspond to intramolecularly hydrogen bonded N–H.37,41 Large absorption peaks seen at amide A and B regions of FFA dimers and FFANP and low-frequency shoulders indicates the presence of hydrogen bonding of the N–H group.35,42
Urea (CO(NH2)2), as a strong H-bonding donor, is commonly used as a hydrogen bonding inhibitor and protein denaturing agent.43,44 FFANPs were incubated with urea to determine the driving force for the self-assembly mechanism. FFANPs were denatured after incubation in urea, implicating hydrogen bonds in the formation of nanoparticles (Fig. S1†).
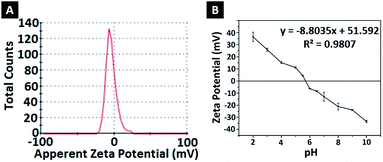
To determine the effect of pH change on the surface charges, zeta potentials of nanoparticles were measured in solutions with different pH (Fig. 3B). At low pH, nanoparticles gained a positive charge due to protonation of oxygen atoms at amide groups. Basic medium caused deprotonation of NH2 in amide groups, causing a negative surface charge.
Synthesis and characterization of FFANP as a gene carrier
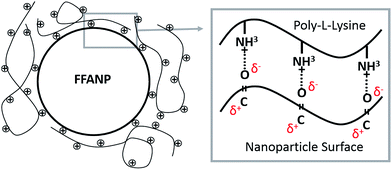
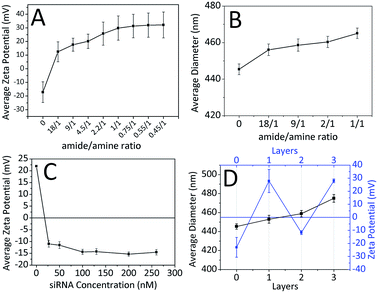
The attempts for adsorption of siRNA molecules directly onto surface of the FFANPs failed due to the lack of positively charged groups on the surface of the nanoparticles (data not shown). FFANPs were further enhanced with polycationic PLL molecules by the LbL PD technique in order to load siRNA.43,46,47 FFANPs were improved with PLL to cationize.48 The highly electronegative oxygen atoms in the FFANPs have a lone pair of electrons. Therefore, these oxygen atoms have a strong tendency to combine or associate with H+ through cation–dipole interactions.49–51 The main driving force in the assembly of the PLL layer on the FFANP surface is probably the cation–dipole interaction between the positively charged PLL chain and the electronegative amide oxygen atoms of FFANPs (Fig. 4). Gene carriers were then created by electrostatic interactions between FFANP–PLL and siRNA molecules.Charge deposition on the surface of nanoparticles in LbL PD applications can be verified with zeta potential measurements.52 In the LbL PD technique, polyelectrolyte adsorption continues until surface neutralization and nanoparticle charge is reversed when there is sufficient polyelectrolyte nearby.53 FFANPs–PLL formed at different Ad/An ratios were tested to determine their zeta-potentials (Fig. 5A). Nanoparticle surface charge was neutralized quickly at 18/1 ratio, and the surface charge increased linearly with increasing concentrations of PLL. This indicates that PLL is accumulating on the nanoparticle surface. Thickness of the adsorbed layer depends on the selected substrate and chemical structure of the polymer, but it mainly relies on the polymer saturation of the surface.23 At a Ad/An ratio of 1/1, the surface became saturated; as excess PLL concentrations did not change the zeta potentials. We conclude that PLL molecules cannot be attached to the surface of the nanoparticles due to electrostatic and steric hindrances.
It is known that the LbL PD technique increases nanoparticle diameter until polymer saturation occurs.54 Fig. 5B shows the mean diameters of nanoparticles calculated from SEM images using ImageJ software. The first increase in mean diameter (11 nm) occurred at 18/1 ratio. Mean nanoparticle diameter continued to increase with increasing PLL concentration up to a 20 nm when the surface was saturated.
FFANPs were interacted with the polyanionic siRNA layer following coating with the polycationic PLL layer. Fig. 5C shows the difference in zeta potentials of the nanoparticles with increasing siRNA concentration. We conclude that siRNA molecules caused a charge reversal at the surface of the nanoparticles due to interaction with the amine groups of PLL. Zeta potential appeared to increase until surface saturation occurred at 100 nM siRNA concentration.
Quantification of siRNA loading in nanoparticles was evaluated by fluorescence staining. The effects of different siRNA concentrations on loading kinetics were given in Table 1. The results are compatible with results of zeta potential and particle size analysis. According to the table, at the concentrations of 27 nM and 50 nM, the siRNA rapidly binds to the surface of the nanoparticle with 89.25% and 48.57% entrapment efficiency, respectively. As the surface of the nanoparticle reached saturation, the adsorption of siRNA slowed down and efficiency decreased. When these results are taken in consideration, nanoparticles interacted with 50 nM siRNA, which are showing the most optimum surface properties, size and loading kinetics, were used in subsequent experiments.
| Added siRNA (nM) | Added siRNA (μg mL−1) | Loaded siRNAa (μg mL−1) | % EE | % LC |
|---|---|---|---|---|
| a Data are presented as mean ± S.D (n = 3). | ||||
| 27 | 0.08 | 0.07 ± 0.00 | 89.2 | 0.007 |
| 50 | 0.15 | 0.07 ± 0.00 | 48.6 | 0.007 |
| 100 | 0.31 | 0.07 ± 0.02 | 23.8 | 0.007 |
| 130 | 0.41 | 0.13 ± 0.03 | 30.9 | 0.012 |
| 200 | 0.62 | 0.16 ± 0.02 | 25.2 | 0.015 |
| 260 | 0.83 | 0.21 ± 0.02 | 25.8 | 0.021 |
To protect siRNA from nuclease activity and to facilitate their cellular uptake, FFANP–PLL/siRNAs were coated with an additional layer of PLL. The zeta potential values during LbL PD showed the characteristic zigzag shape (Fig. 5D). This demonstrates that oppositely charged molecules successfully accumulate on the nanoparticle surface.
Release studies of siRNA from gene carriers
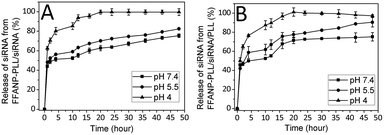
The amount of released siRNA at different pHs were determined as well. The percentages of total siRNA released over time from nanoparticles were presented in Fig. 6. Accordingly, the siRNA amount released from degraded layers of FFANP–PLL/siRNA (Fig. 6A) and FFANP–PLL/siRNA/PLL (Fig. 6B) increased with the decreased pH. While 70, 52, and 48% of siRNA was released from FFANP–PLL/siRNA within the 4 hours at pH 4, 5.5, and 7.4, respectively; 76, 58, and 49% of siRNA was released from FFANP–PLL/siRNA/PLL. At 20th hour, siRNA release continued from both nanoparticles at pH 7.4 and 5.5, while siRNA was released completely at pH 4. There is no considerable difference between the siRNA release profiles of two nanoparticle formulations. These release profiles of siRNA showed that the release of siRNA from both nanoparticles was slow, sustained, and pH-dependent, which was contributed to prolonging the efficacy of siRNA and rapidly releasing of siRNA by pH-change at target position.In vitro degradation of FFANP and FFANP–PLL
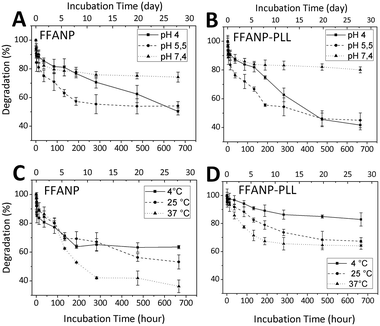
Degradation studies of nanoparticles were performed between pH 4 and 7.4 and between temperatures of 4 and 37 °C. The results are given in Fig. 7. Degradation rates were elevated at decreasing pH for both FFANP (Fig. 7A) and FFANP–PLL (Fig. 7B). PLL modification increased the stability of FFANPs at physiological pH, but their degradation increased dramatically with decreasing pH. This is because, at low pH, the NH2 groups in the PLL side chains become ionized and the resulting electrostatic repulsion forces cause conformational changes in the PLL molecules.55 These results demonstrate the nanoparticles' ability of endosomal escape from cellular vesicles, which have a pH of 5–6.56,57 In addition, the degradation rate of both FFANP (Fig. 7C) and FFANP–PLL (Fig. 7D) increased with increasing temperature. The modification with PLL remarkably improved FFANP stability with temperature change.To evaluate the enzymatic effect of peptidase on the FFANP and FFANP–PLL were incubated with trypsin. Trypsin degraded the nanoparticles as expected seen on SEM images (Fig. S2†).
Toxicity analysis of gene carriers
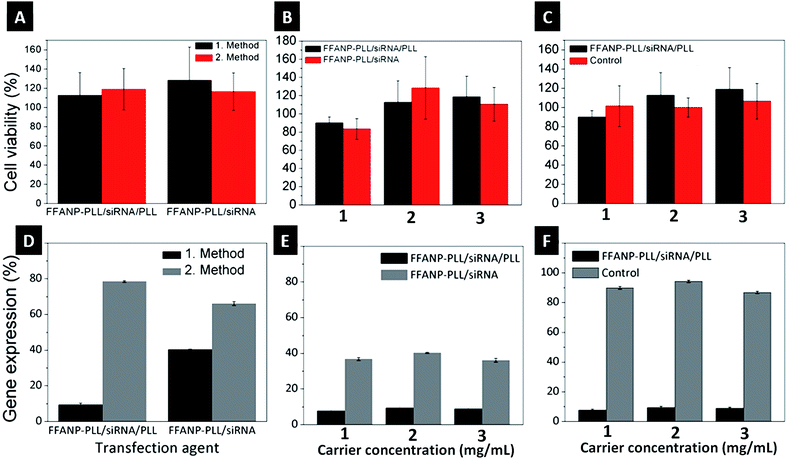
Biocompatibility of both FFANP and FFANP–PLL were assessed with XTT experiments on the BT-474 cell line. None of the nanoparticles showed cytotoxicity (Fig. S3†). Toxicity of siRNA-loaded gene carriers was also tested on BT-474 cells. Results showed that the gene carriers are biocompatible and non-toxic for human cells (Fig. 8A–C).Gene expression analysis
Different gene carrier formulations were tested for their ability to silence the HER2 gene in the breast cancer cell line, BT-474. The studies were planned in several steps to cover all parameters affecting gene expression. Initially, different gene silencing transfection methods were investigated. In the first method, a concentrated transfection medium (TM) was prepared by dispersing the two gene carrier formulations (FFANP–PLL/siRNA and FFANP–PLL/siRNA/PLL) in serum-free medium. In the second method, gene carriers were dispersed in serum-containing medium. Cells were then bombarded with these concentrated TMs. As seen in Fig. 8D, the first method was more effective than the second method. The result is thought to be caused by both the bombardment of cells with a higher concentration of gene carriers and less aggregation of the gene carriers in serum-free medium.In further experiments, two different gene carrier formulations were evaluated for their gene silencing ability (Fig. 8E). FFANP–PLL/siRNA/PLL gene carriers had more impact on gene silencing compared with FFANP–PLL/siRNA in all concentrations, concurring with previous work showing that a higher positive charge leads to better gene silencing.57–59 This is mainly owing to the easier cellular uptake of gene carriers through the negatively charged cellular membrane. In addition, a positive charge facilitates their release into the cytoplasm via endosomal escape, allowing them to function. The second layer of PLL on the siRNAs may also protect it from enzymatic activity.
Different concentration of gene carrier contain 50![[thin space (1/6-em)]](https://www.rsc.org/images/entities/char_2009.gif) :
:![[thin space (1/6-em)]](https://www.rsc.org/images/entities/char_2009.gif) 1 (nM siRNA
1 (nM siRNA![[thin space (1/6-em)]](https://www.rsc.org/images/entities/char_2009.gif) :
:![[thin space (1/6-em)]](https://www.rsc.org/images/entities/char_2009.gif) mg particles) siRNA were tested to define the optimal effective carrier concentration (Fig. 8F). For this purpose, 1, 2, and 3 mg mL−1 of gene carriers were interacted with cells so that the final siRNA concentration was 50, 100, and 150 nM, respectively. mRNA expression decreased significantly in the cells incubated with 1 mg mL−1 gene carriers, whereas 2 and 3 mg mL−1 did not appear to be as effective. Each concentration was tested with naked siRNA controls at the same concentration. It is well known that an excess amount of siRNA causes off-target effects, leading to silencing of random genes other than HER2.60 These results show that the FFANP–PLL/siRNA/PLL is effective even at concentrations as low as 1 mg mL−1 to be used as gene carrier in gene silencing experiments.
mg particles) siRNA were tested to define the optimal effective carrier concentration (Fig. 8F). For this purpose, 1, 2, and 3 mg mL−1 of gene carriers were interacted with cells so that the final siRNA concentration was 50, 100, and 150 nM, respectively. mRNA expression decreased significantly in the cells incubated with 1 mg mL−1 gene carriers, whereas 2 and 3 mg mL−1 did not appear to be as effective. Each concentration was tested with naked siRNA controls at the same concentration. It is well known that an excess amount of siRNA causes off-target effects, leading to silencing of random genes other than HER2.60 These results show that the FFANP–PLL/siRNA/PLL is effective even at concentrations as low as 1 mg mL−1 to be used as gene carrier in gene silencing experiments.
Immunocytochemistry of transfection agents
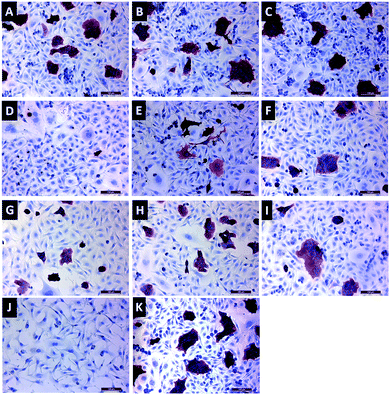
Immunocytochemistry staining was performed with a HER2 antibody to visualize relative protein expression after 72 h incubation with HER2-specific siRNA-loaded gene carriers (Fig. 9). Red staining in cells represents HER2 protein expression. As seen in Fig. 9D, 1 mg mL−1 FFANP–PLL/siRNA/PLL gene carriers, which contain 50 nM siRNA, showed the lowest HER2 expression level. These results are consistent with our gene expression data.Conclusions
In conclusion, we have successfully established a novel monodispersed, self-assembled, biocompatible, and biodegradable diphenylalanine-based nanoparticle for use as a gene carrier. It is a well-known fact that the main problem of self-assembled nanostructures is their instability. Here, we used GA crosslinked FFA nanocarriers for siRNA-mediated gene silencing. This work is novel because, to the best of our knowledge, it is the first study using the highly efficient and recently preferred LbL PD technique to functionalize FFANPs. In this technique, nanoparticles were cationized with PLL coating. By this modification, the amino groups of PLL are found to be crucial to accomplish siRNA loading. It is thought that by increasing the number of PLL and siRNA layers, the potential of nanocarriers for the delivery of large quantities of silencing agents can be improved. The potent in vitro efficacy of these gene carriers indicates that these nanoparticles have the potential to be a robust and useful treatment tool in vivo.Future work will concentrate on using these self-assembled and LbL-modified systems for developing hybrid agents for co-delivery of different siRNAs for cancer therapy. These nanocarriers may possess an efficient synergetic anticancer effect by employing RNA interference-mediated silencing in addition to the anticancer drug-mediated treatment.
Conflicts of interest
The authors declare no conflict of interest.Acknowledgements
The authors gratefully acknowledged the supports from Rotalab Scientific Instruments Ltd. Co.References
- H. Ma, J. Fei, Y. Cui, J. Zhao, A. Wang and J. Li, Chem. Commun., 2013, 49, 9956–9958 RSC.
- K. Kim, Y. S. Lee and R. W. Carthew, RNA, 2007, 13, 22–29 CrossRef CAS PubMed.
- Y. Dorsett and T. Tuschl, Nat. Rev. Drug Discovery, 2004, 3, 318–329 CrossRef CAS PubMed.
- M. E. Davis, J. E. Zuckerman, C. H. Choi, D. Seligson, A. Tolcher, C. A. Alabi, Y. Yen, J. D. Heidel and A. Ribas, Nature, 2010, 464, 1067–1070 CrossRef CAS PubMed.
- T. Tanaka, A. Legat, E. Adam, J. Steuve, J. S. Gatot, M. Vandenbranden, L. Ulianov, C. Lonez, J. M. Ruysschaert, E. Muraille, M. Tuynder, M. Goldman and A. Jacquet, Eur. J. Immunol., 2008, 38, 1351–1357 CrossRef CAS PubMed.
- M. Ouali, J. M. Ruysschaert, C. Lonez and M. Vandenbranden, Mol. Membr. Biol., 2007, 24, 225–232 CrossRef CAS PubMed.
- R. Koynova, Y. S. Tarahovsky, L. Wang and R. C. MacDonald, Biochim. Biophys. Acta, Biomembr., 2007, 1768, 375–386 CrossRef CAS PubMed.
- V. V. Kumar, C. Pichon, M. Refregiers, B. Guerin, P. Midoux and A. Chaudhuri, Gene Ther., 2003, 10, 1206–1215 CrossRef CAS PubMed.
- E. Çelik, C. Bayram, R. Akçapınar, M. Türk and E. B. Denkbaş, J. Bioact. Compat. Polym., 2016, 31, 498–512 CrossRef.
- S. Vauthey, S. Santoso, H. Gong, N. Watson and S. Zhang, Proc. Natl. Acad. Sci. U. S. A., 2002, 99, 5355–5360 CrossRef CAS PubMed.
- B. B. Pala, T. Vural, F. Kuralay, T. Çırak, G. Bolat, S. Abacı and E. B. Denkbaş, Appl. Surf. Sci., 2014, 303, 37–45 CrossRef CAS.
- C. Guo, Y. Luo, R. Zhou and G. Wei, ACS Nano, 2012, 6, 3907–3918 CrossRef CAS PubMed.
- S. Maity, S. Nir and M. Reches, J. Mater. Chem. B, 2014, 2, 2583–2591 RSC.
- X. Yan, P. Zhu, J. Fei and J. Li, Adv. Mater., 2010, 22, 1283–1287 CrossRef CAS PubMed.
- R. Huang, S. Wu, A. Li and Z. Li, J. Mater. Chem. A, 2014, 2, 1672–1676 CAS.
- Q. Li, H. Ma, Y. Jia, J. Li and B. Zhu, Chem. Commun., 2015, 51, 7219–7221 RSC.
- X. Yan, Q. He, K. Wang, L. Duan, Y. Cui and J. Li, Angew. Chem., Int. Ed., 2007, 46, 2431–2434 CrossRef CAS PubMed.
- X. Yan, Y. Cui, Q. He, K. Wang, J. Li, W. Mu, B. Wang and Z. C. Ou-Yang, Chemistry, 2008, 14, 5974–5980 CrossRef CAS PubMed.
- H. Ma, J. Fei, Q. Li and J. Li, Small, 2015, 11, 1787–1791 CrossRef CAS PubMed.
- C. Huang, X. Chen, Y. Lu, H. Yang and W. Yang, Biosens. Bioelectron., 2015, 63, 478–482 CrossRef CAS PubMed.
- H. Zhang, J. Fei, X. Yan, A. Wang and J. Li, Adv. Funct. Mater., 2015, 25, 1193–1204 CrossRef CAS.
- H. H. Kohler, Thermodynamics of Adsorption from Solution, in Coagulation and Flocculation, CRC Press, 2nd edn, 2005, pp. 1–41 Search PubMed.
- M. Castelnovo and J.-F. Joanny, Langmuir, 2000, 16, 7524–7532 CrossRef CAS.
- N. Dim, M. Perepelyuk, O. Gomes, C. Thangavel, Y. Liu, R. Den, A. Lakshmikuttyamma and S. A. Shoyele, J. Nanobiotechnol., 2015, 13, 61 CrossRef PubMed.
- Amides and related functional groups, www.auburn.edu/%7Ederuija/pda1_amides.pdf, accessed January 2017.
- I. Migneault, C. Dartiguenave, M. J. Bertrand and K. C. Waldron, BioTechniques, 2004, 37, 790–802 CAS.
- J. Kong and S. Yu, Acta Biochim. Biophys. Sin., 2007, 39, 549–559 CrossRef CAS PubMed.
- A. Barth, Biochim. Biophys. Acta, Bioenerg., 2007, 1767, 1073–1101 CrossRef CAS PubMed.
- P. I. Haris and F. Severcan, J. Mol. Catal. B: Enzym., 1999, 7, 207–221 CrossRef CAS.
- O. Bozkurt, S. Haman Bayari, M. Severcan, C. Krafft, J. Popp and F. Severcan, Biomed. Optic Express, 2012, 17, 0760231–0760238 CrossRef PubMed.
- K. Elfrink, J. Ollesch, J. Stöhr, D. Willbold, D. Riesner and K. Gerwert, Proc. Natl. Acad. Sci. U. S. A., 2008, 105, 10815–10819 CrossRef CAS PubMed.
- E. Goormaghtigh, J. M. Ruysschaert and V. Raussens, Biophys. J., 2006, 90, 2946–2957 CrossRef CAS PubMed.
- A. Adochitei and G. Drochioiu, Rev. Roum. Chim., 2011, 56, 783–791 CAS.
- P. Zhu, X. Yan, Y. Su, Y. Yang and J. Li, Chemistry, 2010, 16, 3176–3183 CrossRef CAS PubMed.
- B. Dinesh, M. A. Squillaci, C. Menard-Moyon, P. Samori and A. Bianco, Nanoscale, 2015, 7, 15873–15879 RSC.
- G. Kaur, L. A. Abramovich, E. Gazit and S. Verma, RSC Adv., 2014, 4, 64457–64465 RSC.
- G. P. Dado and S. H. Gellman, J. Am. Chem. Soc., 1994, 116, 1054–1062 CrossRef CAS.
- B. Nie, J. Stutzman and A. Xie, Biophys. J., 2005, 88, 2833–2847 CrossRef CAS PubMed.
- A. Barth and C. Zscherp, Q. Rev. Biophys., 2002, 35, 369–430 CrossRef CAS PubMed.
- L. J. Bellamy, in The Infrared Spectra of Complex Molecules: Volume Two Advances in Infrared Group Frequencies, Springer, Netherlands, Dordrecht, 1980, Associated XH Frequencies, the Hydrogen Bond, pp. 240–292 Search PubMed.
- B. Dinesh, V. Vinaya, S. Raghothama and P. Balaram, Eur. J. Org. Chem., 2013, 2013, 3590–3596 CrossRef CAS.
- K. Tonan and S.-i. Ikawa, J. Am. Chem. Soc., 1996, 118, 6960–6965 CrossRef CAS.
- Y. Ogawa, Y. Arikawa, T. Kida and M. Akashi, Langmuir, 2008, 24, 8606–8609 CrossRef CAS PubMed.
- W. K. Lim, J. Rosgen and S. W. Englander, Proc. Natl. Acad. Sci. U. S. A., 2009, 106, 2595–2600 CrossRef CAS PubMed.
- S. Woelki and H. H. Kohler, Surface Charge and Surface Potentia, in Coagulation and Flocculation, CRC Press, 2nd edn, 2005, pp. 43–70 Search PubMed.
- K. Qiao, H. Liu and N. Hu, Electrochim. Acta, 2008, 53, 4654–4662 CrossRef CAS.
- N. V. Churaev, V. D. Sobolev, T. B. Ermakova and I. P. Sergeeva, Colloid J., 2004, 66, 378–380 CrossRef CAS.
- Y.-K. Oh and T. G. Park, Adv. Drug Delivery Rev., 2009, 61, 850–862 CrossRef CAS PubMed.
- M. S. Bakshi, S. Sachar, T. Yoshimura and K. Esumi, J. Colloid Interface Sci., 2004, 278, 224–233 CrossRef CAS PubMed.
- G. von Helden, T. Wyttenbach and M. T. Bowers, Science, 1995, 267, 1483–1485 CrossRef CAS PubMed.
- Y. Deng, J. B. Dixon and G. N. White, Colloid Polym. Sci., 2006, 284, 347–356 CAS.
- M. Zaucha, Z. Adamczyk and J. Barbasz, J. Colloid Interface Sci., 2011, 360, 195–203 CrossRef CAS PubMed.
- J. Hierrezuelo, A. Sadeghpour, I. Szilagyi, A. Vaccaro and M. Borkovec, Langmuir, 2010, 26, 15109–15111 CrossRef CAS PubMed.
- A. Elbakry, A. Zaky, R. Liebl, R. Rachel, A. Goepferich and M. Breunig, Nano Lett., 2009, 9, 2059–2064 CrossRef CAS PubMed.
- A. Mirtič and J. Grdadolnik, Biophys. Chem., 2013, 175, 47–53 CrossRef PubMed.
- M. Dominska and D. M. Dykxhoorn, J. Cell Sci., 2010, 123, 1183–1189 CrossRef CAS PubMed.
- S. Akhtar and I. F. Benter, J. Clin. Invest., 2007, 117, 3623–3632 CrossRef CAS PubMed.
- J. Zabner, A. J. Fasbender, T. Moninger, K. A. Poellinger and M. J. Welsh, J. Biol. Chem., 1995, 270, 18997–19007 CrossRef CAS PubMed.
- I. Koltover, T. Salditt, J. O. Radler and C. R. Safinya, Science, 1998, 281, 78–81 CrossRef CAS PubMed.
- S. P. Persengiev, X. Zhu and M. R. Green, RNA, 2004, 10, 12–18 CrossRef CAS PubMed.
Footnotes |
| † Electronic supplementary information (ESI) available. See DOI: 10.1039/c7ra08460a |
| ‡ These authors contributed equally. |
| This journal is © The Royal Society of Chemistry 2017 |

