 Open Access Article
Creative Commons Attribution 3.0 Unported Licence
Surface modification and magnetic alignment of hexagonal boron nitride nanosheets for highly thermally conductive composites†
Feng Yuana,
Weicheng Jiao *a,
Fan Yanga,
Wenbo Liub,
Zhonghai Xua and
Rongguo Wang*a
aScience and Technology on Advanced Composites in Special Environments Laboratory, Harbin Institute of Technology, Harbin 150086, China. E-mail: xiaojiao458@163.com; wrg@hit.edu.cn
bSchool of Materials Science and Engineering, Harbin Institute of Technology, Harbin 150001, China
First published on 7th September 2017
Abstract
With the current development of microelectronic technology, thermally conductive and electrically insulating encapsulation materials are in urgent demand. Hexagonal boron nitride nanosheets (BNNSs) possess a highly anisotropic thermal property. Therefore, the thermal conductivity of the BNNSs-based composites can be dramatically increased through the orientation of fillers. However, it is still difficult to well align BNNSs at high loadings due to the intensive aggregation. Herein, highly ordered thermoplastic polyurethane elastomer (TPU)/BNNSs composites are successfully fabricated by the combination of filler modification and magnetic alignment. The effective covalent modification with 2,4-tolylene diisocyanate (TDI) greatly increases the dispersibility of fillers, thus making it easy to well orient BNNSs at high loadings. The highly aligned fillers result in much higher in-plane thermal conductivity than the composites filled with disordered or less-ordered unmodified BNNSs. The thermal conductivity is as high as 5.15 W m−1 K−1 at 30 wt% loading. Moreover, the composite simultaneously exhibits low dielectric constant, low dielectric dissipation factor and excellent thermomechanical properties. These results reveal the promising application of such highly-ordered composites in advanced electronic packing.
1. Introduction
With the continued trend toward faster, higher integration and miniaturization of modern electronics, considerable heat is accumulated. Thermal management has thus emerged as a critical problem to the performance and reliability of electronic devices. Polymer composites filled with highly thermally conductive fillers have been demonstrated to be effective thermal management materials. Many inorganic fillers, such as AlN,1–3 Al2O3,4,5 SiC,6,7 and SiO2,8 etc., are widely used as thermally conductive fillers. With the development of carbon nanomaterials, carbon nanotubes,9–12 and graphene13–16 have also been widely employed to fabricate heat conductive composites owing to their super-high thermal conductivity. However, the high electrical conductivity of such carbon nanomaterials severely limits their applications in certain areas where electrical insulation is concerned. Being structurally analogous to graphene, hexagonal boron nitride nanosheets (BNNSs) have drawn far attention in the microelectronic industry due to their uniquely thermally conductive but electrically insulating properties.17 Moreover, BNNSs show a higher thermal conductivity and a lower density in comparison with the above ceramic fillers.18 Therefore, BNNSs perform as a preferential selection for fabricating highly thermally conductive but insulating composites.BNNSs have been widely applied in composites for improving thermal conductivity. However, the improvement in thermal conductivity is usually limited in previous reports.19,20 Besides the intrinsic properties of filler, the performances of composite are also closely associated with filler dispersion,21 alignment,22 and interfacial property.3,23 BNNSs occurs as typical anisotropic nanosheets, which show a super high in-plane thermal conductivity of 2000 W m−1 K−1, whereas a very low through-plane thermal conductivity of 100 W m−1 K−1.17,24 Therefore, it is widely accepted that the orientation of BNNSs along the heat flux can significantly increase the thermal conductivity of the composite. Recently, several approaches, such as electrostatic flocking,25 doctor blading,18,26 stretching,27 chemical vapor deposition,11 freeze-casting,28 tape-casting,29 and magnetic field,24,30–34 have been developed to construct aligned microstructures in composites. Among these fillers array strategies, magnetic alignment is an attractive method duo to easy operation, low cost, and the possibility of aligning filler at arbitrary directions.32,34 However, it is still a challenging issue to well align fillers at high filler loadings due to the severe aggregation and high viscosity.26,30
In addition to the orientation of the anisotropic fillers, the homogeneous dispersion as well as the strong interfacial interaction between BNNSs and polymer matrices are both critical for sufficiently taking advantage of the super high in-plane thermal conductivity of BNNSs. Many efforts have been devoted to surface modification of BNNSs to increase the dispersion and interfacial compatibility of BNNSs within polymer matrices.21,35–37 However, the improvement of thermal conductivity is still limited due to the inadequate surface modification and deteriorated intrinsic thermal conductivity of BNNSs during modification.
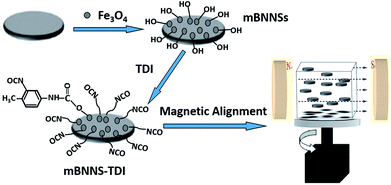
Elastomers have been considered to be materials of choice in electronic packaging systems, owing to excellent properties, including high elasticity, abrasion resistance and easy processibility. In this paper, based on the combination of filler modification and magnetic orientation, highly-ordered thermoplastic polyurethane elastomer (TPU)/BNNSs composites with high thermal conductivity are successfully prepared. The whole preparation process is schematically illustrated in Fig. 1. Firstly, the BNNSs with magnetic response (mBNNSs) are prepared through the introduction of magnetic Fe3O4 nanoparticles on their surfaces. By utilizing the hydroxyl groups (–OH) on the Fe3O4 surfaces, mBNNSs are further covalently modified with 2,4-tolylene diisocyanate (TDI) molecules. Finally, due to the homogeneous dispersibility of fillers, the highly ordered BNNS-TDI/TPU composite can be obtained by applying a rotating magnetic field during resin curing. By virtue of high orientation degree of fillers and the strong interfacial interaction, the mBNNS-TDI/TPU composites possess the simultaneous properties of high thermal conductivity, low dielectric constant, low dielectric dissipation factor, as well as excellent thermomechanical performances, which are envisaged to be particularly valuable for advanced electronic packaging.
2. Experimental
2.1 Materials
4,4′-Phenyl methane diisocyanate (MDI), 1,4-butanediol (BDO), ferrous chloride tetrahydrate (FeCl2·4H2O), sodium hydroxide (NaOH), hydrogen peroxide (H2O2), 2,4-tolylene diisocyanate (TDI), organotin catalyst (DBTDL) and all organic solvents were purchased from J&K Chemicals. Poly(butylenes adipate) glycol (PBA) was kindly supplied by Qingdao Xinyutian Chemical Co., Ltd, China. Deionized water was used throughout all experiments, and all reagents were used directly, without any purification.2.2 Preparation of magnetically responsive BNNSs (mBNNSs)
The mBNNSs were prepared through an in situ generation method, in which Fe3O4 nanoparticles were nucleated on the surface of BNNSs by oxidizing the aqueous Fe(OH)2 suspension at room temperature. Firstly, 2 g BNNSs (prepared by the method reported in our previous literature,38 500 nm to 2 μm in diameter, about 2 nm in thickness, Fig. S1†) were dispersed into 100 ml deionized water through bath sonication for 30 h at 25 °C. 1 g FeCl2·4H2O was then added into the above solution under rapid mechanical stirring. At this stage, the positive Fe ions are attracted onto the BNNSs surface. Subsequently, 120 ml NaOH aqueous solution (0.1 mol l−1) was slowly added to form an dark-green Fe(OH)2 colloidal solution. Finally, this colloid was oxidized into magnetic Fe3O4 nanoparticles by H2O2 at room temperature. As a result, the white BNNSs change into black particles (Fig. S2†). After vigorous bath-sonication for 2 h, the obtained black product was subjected to vacuum-assisted filtration using a 0.45 μm pore size membrane to remove free Fe3O4 nanoparticles. The final product was re-dispersed in water through sonication and collected by magnetic separation, followed by vacuum drying.2.3 Surface modification of mBNNSs
1 g mBNNSs was dispersed into 200 ml dry toluene by ultrasonication for 30 min at room temperature. Then, 100 mg TDI and three drops of organotin catalysts were added. The mixture was stirred for 8 h at 80 °C under a steady nitrogen flow. After the reaction, the modified mBNNSs particles, named as mBNNS-TDI, were centrifuged, washed by acetone and vacuum dried at 60 °C for 8 h.2.4 Fabrication of highly ordered composites with mBNNS-TDI
MDI, PBA and BDO were used to synthesize hydroxyl-terminated TPU resin and the highly ordered mBNNS-TDI/TPU composites were fabricated through magnetic orientation strategy, as the following process: firstly, mBNNS-TDI with various weights were dispersed into appropriate amount of N,N-dimethylformamide (DMF) and sonicated for 2 h. At the same time, PBA were vacuum dehydrated for 2 h at 100–120 °C. After cooling to 70–80 °C, the mBNNS-TDI suspension was slowly dropped into the cooled PBA liquid within 2 h under rapid stirring. Then, the required quantity of MDI was added to trigger prepolymerization under N2 protection, until the –NCO % content approached the predetermined value. Finally, BDO was introduced to start the expending chain process (the molar ratio of PBA![[thin space (1/6-em)]](https://www.rsc.org/images/entities/char_2009.gif) :
:![[thin space (1/6-em)]](https://www.rsc.org/images/entities/char_2009.gif) MDI
MDI![[thin space (1/6-em)]](https://www.rsc.org/images/entities/char_2009.gif) :
:![[thin space (1/6-em)]](https://www.rsc.org/images/entities/char_2009.gif) BDO was set at 1
BDO was set at 1![[thin space (1/6-em)]](https://www.rsc.org/images/entities/char_2009.gif) :
:![[thin space (1/6-em)]](https://www.rsc.org/images/entities/char_2009.gif) 1.98
1.98![[thin space (1/6-em)]](https://www.rsc.org/images/entities/char_2009.gif) :
:![[thin space (1/6-em)]](https://www.rsc.org/images/entities/char_2009.gif) 1). The mixture was further stirred vigorously for 30 min. After that, the solution was poured into a Teflon mold and then placed into a horizontal magnetic field for 5 h at room temperature. The sample was further dried at 60 °C for 12 h without a magnetic field and followed by curing at 120 °C for 24 h.
1). The mixture was further stirred vigorously for 30 min. After that, the solution was poured into a Teflon mold and then placed into a horizontal magnetic field for 5 h at room temperature. The sample was further dried at 60 °C for 12 h without a magnetic field and followed by curing at 120 °C for 24 h.
2.5 Characterization
Powder X-ray diffraction (XRD) detection was carried on a PANalytical diffractometer using Cu Kα radiation. Raman study was taken on a confocal Raman spectroscopic system (Renishaw, InVia) with a 532 nm excitation laser. Fourier transform infrared (FT-IR) spectra was obtained using an AVATAR 360 Fourier transform infrared spectrometer, with the range of 500–4000 cm−1. Thermal gravimetric analysis (TGA) was conducted on a thermoanalyzer (SDT Q600 V20.9 Build 20, TA Instruments) with a heating rate of 10 °C min−1 under a nitrogen atmosphere. Transmission electron microscope (TEM) characterization was performed on a FEI Tecnai G2 F20 transition electron microscope. The TEM specimen was prepared by evenly dispersing Fe3O4 nanoparticles or mBNNSs into a mixed solvent of deionized water and ethanol through sonication, and then dropping a small volume of the dispersion on a carbon coated copper grid. Scanning electron microscopy (SEM) observation was conducted on a FEI Helios Nanolab 600i scanning electron microscope. Differential scanning calorimetry analyses (DSC) were obtained by using a 200 F3 instrument (NETZSCH, Germany) at a heating rate of 10 °C min−1 under a nitrogen atmosphere. The magnetic properties of Fe3O4 nanoparticles, mBNNSs and mBNNS-TDI were studied through using a vibrating scanning magnetometer (VSM, Lake Shore VSM 7307). The in-plane thermal conductivities of the samples were tested on a Hot Disk thermal analyzer (Hot Disk AB, Uppsala, Sweden). At least three separate tests were carried on each sample, and the average value was reported. The dielectric properties of the blank TPU resin and corresponding composites were detected by using a Novocontrol Concept 40 broadband dielectric spectroscopy at room temperature. Before measurements, gold nanoparticles were deposited on both surfaces of the circular specimens. The thermal–mechanical properties of TPU resin and various composites were investigated using a dynamic mechanical analyzer (DMA, Q800, TA Instruments) at the stretch mode with at a heating rate of 3 °C min−1.3. Results and discussion
3.1 Characterization of mBNNSs
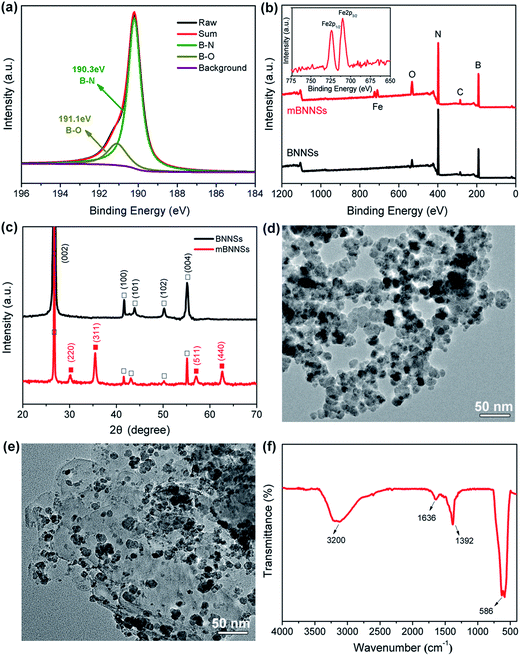
During powerful sonication of BNNSs, a large number of defects, including dislocations, topological defects and vacancies, can be formed on the surface.39 To reduce the energy at defect positions, the highly reactive defects will capture –OH groups in aqueous solution.40 As revealed by XPS analysis (Fig. 2a), apart from the typical B–N peak (190.3 eV), a small peak attributed to the B–O bond also appears at 191.1 eV. This result is in good agreement with the result reported by Sun et al.41 and implies the successful introduction of a small number –OH groups on BNNSs surface. As a result, it is rational to speculate that the positive Fe ions would be attracted onto the BNNSs surface through the electrostatic attraction between Fe2+ and –OH, thus forming the initial Fe3O4 “seeds”.41 Fig. 2b shows the XPS spectra of BNNSs and mBNNSs. It is noticed that a signal assigned to Fe (2p1/2, 2p3/2) appears and an increase in the intensity of the O1s peak in the spectrum of mBNNSs, indicating the successful formation of Fe3O4 on the BNNSs surface. It is worth noting that the peaks of Fe2p1/2 (724.3 eV) and Fe2p3/2 (710.6 eV) are both shifted to lower binding energies in comparison with the reported values(724.8 eV and 711.2 eV).42 which is consistent with the result reported by Yao et al. who carried out XPS detection on BNNS-Ag hybrid43 and reveals the interaction between Fe3O4 nanoparticles and BNNSs. The successful synthesis of Fe4O3 nanoparticles on the BNNSs surface is further verified by the XRD analyses of BNNSs and mBNNSs (Fig. 2c). Clearly, compared with BNNSs, the XRD spectrum of mBNNSs exhibits four new peaks, which appear at 2θ = 30.21°, 35.51°, 57.43° and 62.91°, respectively. In accordance with the reference date (JCPDS card no. 19-0629), these feature peaks are attributed to the (220), (311), (511) and (440) planes of Fe3O4, respectively. Also it could be seen that no impurity peaks are detected, revealing the high purity of the as-obtained mBNNSs. The TEM characterization reveals that the as-prepared Fe3O4 is nanosphere-like particles with an average particle size of about 23 nm. Furthermore, due to the size effect and surface adsorption of nanoparticles, the Fe3O4 nanoparticles are severely agglomerated together (Fig. 2d). Fig. 2e clearly confirms that the successful formation of a hybrid filler, in which the surface of BNNSs is covered with spherical Fe3O4 nanoparticles, a result that is consistent with the analyses of XPS and XRD. In addition, as revealed by TEM image, after strong ultrasonic dispersion (200 W, 2 h) of mBNNSs during the preparation of TEM specimen, Fe3O4 nanoparticles are detected only on the BNNSs surface, without any free nanoparticles. This result implies strong interaction between Fe3O4 nanoparticles and BNNSs.It should also be noted that, due to the size effect, there is a large amount of –OH groups on the surfaces of Fe3O4 nanoparticles in aqueous solution, as confirmed by FTIR analysis (Fig. 2f). The absorption peak resulting from Fe–O stretching vibration is observed at 586 cm−1. In addition, a broadened peak assigned to –OH stretching vibration, and the one corresponding to the bending vibration of –OH are also observed at ∼3200 cm−1 and at 1392 cm−1, respectively. An small peak at 1635 cm−1 is the result of O–H+ bending vibration for hydrogen bond. All these results reveal the presence of –OH functional groups on Fe3O4 surface, which make it possible to covalently modify mBNNSs, as discussed below.
3.2 Characterization of mBNNS-TDI
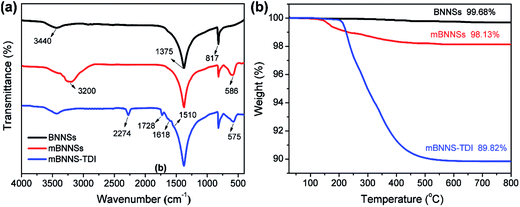
As is well known, the thermal transport performance of composites is closely associated with the dispersibility and interfacial compatibility of filler within resin matrices. However, the low chemical activity of the BNNSs usually results in a poor interfacial interaction between BNNSs and polymer matrices. Therefore, surface modification is necessary to enhance the adhesion of BNNSs to resin matrix. However, the reliable and effective approaches for BNNSs surface functionalization are still lacking because of their chemical inertia. It is thus highly attractive to introduce active groups onto BNNSs surface for increasing chemical activity. The above characterizations of Fe3O4 nanoparticles demonstrate that the synthesis of Fe3O4 nanoparticles on BNNSs surface can introduce a large number of –OH groups on their surfaces. This makes it possible to covalently functionalize mBNNSs. Isocyanates are highly chemically active and can react with many compounds, such as amines, alcohols, carboxylic acids, and so on. They are considered to be ideal functional reagents for the surface modification of inorganic nanoparticles. Herein, the low viscosity 2,4-diisocyanate (TDI) was employed to covalently modify the surface of mBNNSs. TDI molecular contains two isocyanate groups (–NCO), in which one can react with the –OH groups on the surface of the mBNNSs, another one makes mBNNSs highly chemically active.44–46In order to confirm the successful covalent modification of mBNNSs by TDI molecules, FTIR analyses for the BNNSs, mBNNSs and mBNNS-TDI were performed, as shown in Fig. 3a. The pure BNNSs exhibit two strong absorption peaks at 817 and 1375 cm−1, which result from the B–N–B out-of-plane bending mode and B–N in-plane stretching vibration, respectively. The unimpressive peak around 3440 cm−1 is the result of a trace amount of surface moisture.47 For mBNNSs, as expected, in addition to the absorption peaks assigned to BNNSs, the absorption peak attributed to Fe–O bond stretching mode (∼586 cm−1) and a broadened peak corresponding to the –OH groups (∼3200 cm−1) are also observed. In the case of mBNNS-TDI, the peak assigned to the –OH groups disappears, while some additional peaks clearly appear, including the stretching vibrations of –NCO (2274 cm−1), –NHCOO– (1728 cm−1) and phenyl ring (1618 and 1510 cm−1). The existence of these new peaks confirm that TDI molecules are successfully grafted onto the surface of mBNNSs. Moreover, because of the effect of strong covalent bonds between Fe3O4 nanoparticles and TDI molecules on the Fe–O lattice, the Fe–O bond stretching peak shifts from 586 cm−1 to 575 cm−1.
TGA study was further performed to comparatively characterize the BNNSs, mBNNSs and mBNNS-TDI. As depicted in Fig. 3b, the unmodified BNNSs possess high thermal stability, with only 0.32% water evaporation until 800 °C. After magnetic modification, the samples begin to lose weight around 160 °C. This weight loss is attributed to the removal of –OH groups on the surface of Fe3O4 nanoparticles. Regarding of mBNNS-TDI, however, there is a significant weight loss between 220 °C and 500 °C. This weight loss is due to the thermal degradation of TPU molecular chains grafted onto the surface of mBNNSs, in good agreement with FTIR analysis. In combination with the weight loss data of mBNNSs, the weight grafting degree of TDI on mBNNSs surface is calculated to be 8.31 wt%. It should be pointed out that the hexagonal structure of BNNSs is well preserved after modification, as the Raman spectra of mBNNSs and mBNNS-TDI both show the E2g phonon mode at 1365.4 cm−1, which is identical to that of the pure BNNSs (Fig. S3a†). In addition, a small peak appears at ∼680 cm−1, further indicating the presence of Fe3O4 nanoparticles.48 Moreover, the intrinsic crystalline properties of BNNSs and Fe3O4 are also well retained after modification, as revealed by XRD results (Fig. S3b†), in which mBNNS-TDI shows essentially the same diffraction peaks as the mBNNSs.
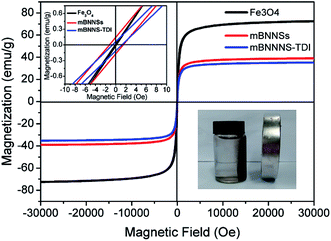
To obtain quantitative information about the magnetic properties of mBNNS-TDI, the room-temperature magnetization characteristics of mBNNS-TDI along with mBNNS and Fe3O4 nanoparticles were investigated by VSM. As shown in Fig. 4, the pure Fe3O4 nanoparticles exhibit superparamagnetic behavior with a saturation magnetization of 72.46 emu g−1. The mBNNSs are also superparamagnets with negligible remanence (0.14 emu g−1) and coercivity (1.2 Oe). Such magnetic properties are agreement with the fact that most of the Fe3O4 nanoparticles anchored on BNNSs surface possess diameters less than 25 nm and are typical single domain magnets.49 However, the magnetization of mBNNSs decreases to 38.99 emu g−1 because of the existence of non-magnetic BNNSs. For mBNNS-TDI, they show the same superparamagnetic behavior with a slightly reduced magnetization of 35.25 emu g−1. The magnetic response of mBNNS-TDI can be easily and quickly visualized by placing the mBNNS-TDI water solution close to a small magnet. As shown in the illustration (right below) in Fig. 4, all mBNNS-TDI particles are attracted to the magnetic source, illustrating their good magnetism. As discussed above, the effective magnetic modification and TDI covalent functionalization of BNNSs were successfully achieved through covering their surfaces with Fe3O4 nanoparticles followed by treating with TDI. The as-obtained mBNNS-TDI is the promising filler to be used as building block for the preparation of thermoconductive composites with a perfect alignment of mBNNS-TDI.
3.3 Orientation of mBNNS-TDI in TPU matrix
During the preparation of composites with magnetic oriented fillers, the external magnetic field plays a crucial role in engineering the alignment of filler in polymer matrix. In this work, a method reported by Jiao et al.33 was adopted to theoretically predict the minimum magnetic field (Hm) required to align mBNNS-TDI in TPU matrix. Briefly, according to the elliptical shell model, there are magnetic torque (Tm), gravitational torque (Tg), and viscous torque (Tv) acting on the mBNNS-TDI during the orientation process, where Tm, Tg and Tv can be calculated according to the eqn (S1)–(S3),† respectively.When the probability of mBNNS-TDI having the orientation angle (θ) in the range from 0° to 5° reaches up 90%, it is believed that the orientation structure is achieved. The probability (P) of mBNNS-TDI within this range (0–5°) can be predicted through Boltzmann statistics, as following:
 | (1) |
 | (2) |
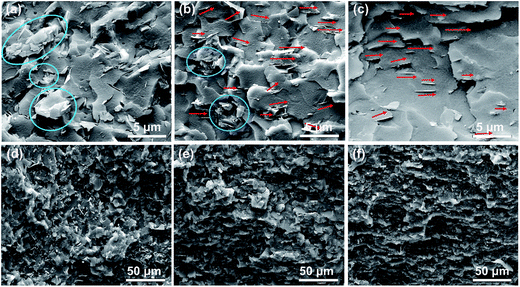
The mBNNS-TDI/TPU composite with an in-plane-aligned structure (ImBNNS-TDI/TPU) was fabricated by applying a low magnetic field during resin curing. For comparative purposes, in-plane-aligned mBNNSs/TPU composite (ImBNNSs/TPU) and randomly aligned mBNNSs/TPU composites(RmBNNSs/TPU) were also prepared. SEM characterization was performed on the fractured surfaces of various composites, and the representative results are shown in Fig. 5. For RmBNNSs/TPU, many mBNNSs platelets and aggregates are randomly dispersed in TPU matrix (Fig. 5a). The aggregation is so strong that the magnetic field cannot lead to a well oriented structure, as revealed by the cross-section SEM image of ImBNNSs/TPU composite, in which some aggregations and unaligned mBNNSs are clearly observed (Fig. 5b). In the case of ImBNNS-TDI/TPU, mBNNS-TDI is uniformly dispersed in TPU matrix and well orientated along the direction of the magnetic field (Fig. 5c), implying the importance of surface modification. The –NCO groups from TDI grafted onto the mBNNSs surface can react with the terminal –OH groups of TPU, thereby increasing the dispersibility and interfacial affinity of mBNNS-TDI within the TPU matrix, which in turn greatly promote the orientation of mBNNS-TDI. Such homogeneous dispersion and strong interfacial interaction are also confirmed by the “disappearance” of most mBNNS-TDI in composite. The orientation features of fillers can be more clearly visualized from low magnification SEM images, as shown in Fig. 5d–f. In sharp contrast to the disordered feature of RmBNNSs-TDI/TPU (Fig. 5d), ImBNNSs-TDI/TPU presents a ordered architecture (Fig. 5f). However, for HmBNNSs/TPU composites, the ordered features become less noticeable due to many unaligned fillers (Fig. 5e).
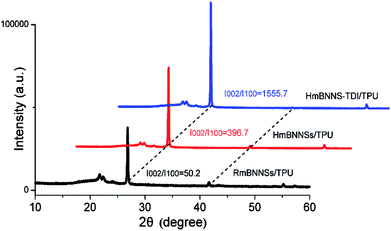
The XRD detection of composites can provide further support for the magnetic orientation of fillers in matrix. As reported in previous works,26,50 the (002) and (100) plane peaks, which are centered at 26.7° and 41.6°, correspond to the horizontally and vertically aligned BNNSs, respectively. Therefore, the intensity (I) ratio between (002) and (100) peaks can represent the horizontal orientation degree (δ) of fillers. Fig. 6 gives the XRD patterns of three different composites with 10 wt% loading. Clearly, there is a great difference in δ values among these three composites. The magnetic field only promotes the orientation of mBNNSs a little due to the severe aggregation of mBNNSs. After the TDI covalent modification, the horizontal orientation degree of mBNNS-TDI dramatically increases. The same tendency of the orientation degree variation for the composites containing 5, 20 and 30 wt% fillers are depicted in Fig. S4.† These results further reveal that TDI covalent modification significantly enhances the orientation of mBNNS-TDI in TPU resin under magnetic field. The XRD results are in consistent with the SEM observation, and can also be employed to explain the difference in the thermal transport performances for the three composites, as discussed below.
3.4 Properties of ImBNNS-TDI/TPU composites
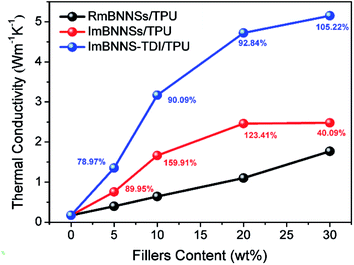
The in-plane thermal conductivities of different composites with various loadings were measured. As shown in Fig. 7, all composites show the same tendency, i.e., the thermal conductivity increases with the increase of filler loading. This tendency can be ascribed to the increasing contribution of heat transport through fillers at higher loadings. At the same loading, however, the thermal conductivity is greatly different among these three composites. The differences can be explained by the different arrangement of fillers in various cases. BNNSs exhibit a highly anisotropic thermal property: the in-plane thermal conductivity is almost 20 times higher than the through-plane thermal conductivity. Therefore, the ImBNNS-TDI/TPU composite with the well aligned structure exhibits the highest effectiveness in increasing the thermal conductivity. For polymer composites, the relationship between the thermal conductivity and filler loading can be fitted the mode proposed by Agari et al. as follows:51log![[thin space (1/6-em)]](https://www.rsc.org/images/entities/char_2009.gif) λc = (1 − V)log(Cmλm) + VCf λc = (1 − V)log(Cmλm) + VCf![[thin space (1/6-em)]](https://www.rsc.org/images/entities/char_2009.gif) log log![[thin space (1/6-em)]](https://www.rsc.org/images/entities/char_2009.gif) λf λf |
It is also noted that the difference in the thermal conductivity between RmBNNS/TPU and ImBNNSs/TPU is greatly diminished at 30 wt% loading. The thermal enhancement (defined as the thermal conductivity improvement percentage with that of RmBNNSs/TPU as a reference) initially increases with the increasing filler content, being as high as 159.91% at 10 wt%, whereas drops quickly to 40.09% at 30 wt% loading. The reduction of thermal enhancement at high filler content can be explained according to the orientation degree given by XRD detection (Fig. 6 and S4†). The orientation degree of ImBNNSs/TPU with 30 wt% loading only increases from 46.1 of RmBNNSs/TPU to 96.8. The corresponding orientation degree enhancement is much lower than those obtained at low loading. With an increase in the loading of fillers, the aggregation increase correspondingly, thus severely hindering the magnetic orientation of mBNNSs in TPU matrix. The relatively disordered arrangement of mBNNSs results in the decrease of the heat transfer efficiency parallel to the in-plane direction, thus a lower increase in the thermal conductivity at high loadings. However, in the case of ImBNNS-TDI/TPU composites, owing to uniform dispersion of fillers, it is possible to obtain a high orientation degree at high loading (δ is 1015.3 at 30 wt%). Therefore, with the thermal conductivity of ImBNNSs/TPU as a reference, the thermal enhancement of ImBNNS-TDI/TPU composites increases with the increasing filler loading. At 30 wt% loading, the thermal conductivity of the ImBNNS-TDI/TPU composite is dramatically increased to 5.15 W m−1 K−1, displaying 105.22% and 190.97% increases with respect to the ImBNNSs/TPU and RmBNNSs/TPU composites, respectively.
Besides in-plane thermal conductivity, the through-plane thermal conductivities of as-prepared composites were also measured (Fig. S5†). For RmBNNSs/TPU composites, the through-plane thermal conductivity is slightly lower than the in-plane thermal conductivity. For instance, at 30 wt% loading, the in-plane thermal conductivity is 1.771 W m−1 K−1, whereas the through-plane thermal conductivity is only 1.635 W m−1 K−1. This is mainly attributed the large aspect ratio of mBNNSs, which facilitates the mBNNSs to arrange along the horizontal direction spontaneously,18 as revealed by XRD characterization. After magnetic orientation, the through-plane thermal conductivity is further reduced in comparison with that of RmBNNSs/TPU composite. Moreover, the difference in the through-plane thermal conductivity between RmBNNS/TPU and ImBNNSs/TPU is gradually diminished with the increasing filler loadings, which can be explained by the fact that the horizontal orientation degree of fillers is gradually reduced with the increase of mBNNSs loadings. Due to more horizontally arranged fillers, the ImBNNS-TDI/TPU composite exhibits the minimum efficiency in increasing the through-plane thermal conductivity. With 30 wt% loading, the through-plane thermal conductivity of the ImBNNS-TDI/TPU composite is merely reaches 1.283 W m−1 K−1, corresponding to 17.33% and 21.35% reductions compared to the ImBNNSs/TPU and RmBNNSs/TPU composites, respectively.
The effects of filler orientation and modification on the dielectric properties of composites were investigated, as presented in Fig. 8. For RmBNNSs/TPU composites, the addition of mBNNSs has no negative impact on the dielectric constant and dielectric loss tangent. This should be attributed to the high electrical insulation of mBNNSs. After magnetic alignment, the ImBNNSs/TPU composite exhibits slightly lower dielectric constant and dielectric dissipation factor compared with those of RmBNNSs/TPU composite, and their values at 1 kHz drop from 6.01 to 5.61 and 0.038 to 0.035, respectively. As revealed by DSC analysis (Fig. S6†), the ImBNNSs/TPU composite possess a higher Tg value than that of RmBNNSs/TPU composite. This indicates that the orientation of mBNNSs are more effective to inhibit the movement of the TPU molecular chains in comparison with randomly dispersed mBNNSs in TPU. As a result, the bulk polarization in TPU resin and the mobility of the charge carrier are restricted, which result in a decrease in dielectric constant and dielectric dissipation factor. For ImBNNS-TDI/TPU composite, benefiting from the higher degree of orientation, homogeneous dispersion and strong interfacial interaction, the immobility of TPU molecular chain is further enhanced, as confirmed by the DSC result, in which the Tg of ImBNNS-TDI/TPU is increased from −31.11 °C of ImBNNSs/TPU to −27.25 °C. Consequently, a significantly reduction in dielectric constant (4.69 at 1 kHz) and dielectric dissipation factor (0.029 at 1 kHz) is achieved in ImBNNS-TDI/TPU composite. Furthermore, with the increasing mBNNS-TDI loading, the more highly immobile interfaces will be formed, therefore, the dielectric constant and dielectric dissipation factor even decrease with the increase of BNNS-TDI content, as shown in Fig. S7.†
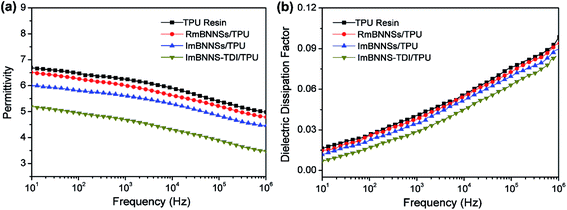 | ||
| Fig. 8 Frequency dependence of dielectric constant (a) and dielectric dissipation factor (b) of blank TPU resin and different composites with 10 wt% fillers. | ||
Table 1 summarizes previously reported thermal conductivity and dielectric property for polymer composites with various fillers. The thermal conductivity enhancement (ΔK) is defined as ΔK = Kc/Km, where Kc and Km are the thermal conductivity of the composite and resin matrix, respectively. The variation of dielectric constant (Δλ) is defined as Δλ = λc/λm, where λc and λm are the dielectric constants of the composite and resin matrix. The variation of dielectric dissipation factor (Δtan![[thin space (1/6-em)]](https://www.rsc.org/images/entities/char_2009.gif) δ) is defined as Δtan
δ) is defined as Δtan![[thin space (1/6-em)]](https://www.rsc.org/images/entities/char_2009.gif) δ = tan
δ = tan![[thin space (1/6-em)]](https://www.rsc.org/images/entities/char_2009.gif) δc/tan
δc/tan![[thin space (1/6-em)]](https://www.rsc.org/images/entities/char_2009.gif) δm, where tan
δm, where tan![[thin space (1/6-em)]](https://www.rsc.org/images/entities/char_2009.gif) δc and tan
δc and tan![[thin space (1/6-em)]](https://www.rsc.org/images/entities/char_2009.gif) δm are the dielectric dissipation factor of the composite and resin matrix, respectively. Obviously, the thermal conductivity enhancement of our ImBNNS-TDI/TPU composites is extremely high. In addition, the observed decrease of λc and tan
δm are the dielectric dissipation factor of the composite and resin matrix, respectively. Obviously, the thermal conductivity enhancement of our ImBNNS-TDI/TPU composites is extremely high. In addition, the observed decrease of λc and tan![[thin space (1/6-em)]](https://www.rsc.org/images/entities/char_2009.gif) δc in ImBNNS-TDI/TPU composites is attractive, as the incorporation of inorganic particles into insulating polymers usually results in high λc and tan
δc in ImBNNS-TDI/TPU composites is attractive, as the incorporation of inorganic particles into insulating polymers usually results in high λc and tan![[thin space (1/6-em)]](https://www.rsc.org/images/entities/char_2009.gif) δc, such as SiC, Al2O3, and AlN, etc. The simultaneous properties of high Kc, low λc and low tan
δc, such as SiC, Al2O3, and AlN, etc. The simultaneous properties of high Kc, low λc and low tan![[thin space (1/6-em)]](https://www.rsc.org/images/entities/char_2009.gif) δc pave the way for promising application in electronic packaging.
δc pave the way for promising application in electronic packaging.
| Filler | Matrix | ΔK (%) | Δλ (%) | Δtan![[thin space (1/6-em)]](https://www.rsc.org/images/entities/char_2009.gif) β (%) β (%) |
Loading | Reference |
|---|---|---|---|---|---|---|
| SiC | Epoxy | 198 | 187 | 147 | 13.8 vol% | 52 |
| Al2O3 | Epoxy | 138 | 137 | 140 | 20 wt% | 53 |
| Si3N4 | Epoxy | 545 | 151 | 533 | 30 vol% | 54 |
| AlN | Epoxy | 187 | 120 | 265 | 27.4 wt% | 55 |
| BNNT | Epoxy | 1360 | 87 | 18 | 30 wt% | 56 |
| h-BN | Cyanate ester | 204 | 109 | 85 | 15 vol% | 21 |
| h-BN | Epoxy | 190 | 122 | 255 | 30 wt% | 57 |
| Aggregated BN | Epoxy | 1910 | — | — | 42.8 vol% | 58 |
| h-BN | Bismaleimide | 276 | — | — | 20 wt% | 59 |
| h-BN + graphene | Polyimide | 1623 | — | — | 50 wt% | 60 |
| BNNSs | Epoxy | 416 | — | — | 30 wt% | 19 |
| Aligned h-BN | Epoxy | 567 | — | — | 20 wt% | 30 |
| Aligned BNNSs | Natural rubber | 1486 | — | — | 30 vol% | 22 |
| Aligned mBNNS-TDI | TPU | 3012 | 61 | 45 | 30 wt% | This work |
The thermomechanical properties of the composites were also investigated through DMA analysis (Fig. 9). As expected, all composites exhibit a higher dynamic storage modulus (E′) than that of the pure TPU resin due to the inherent hardness and high storage modulus of BNNSs. The ImBNNS-TDI/TPU composite show the maximum increase over the whole temperature range. In glassy region, the E′ value is up to 5823 MPa, 2.2-fold higher than that of the TPU resin (1829 MPa). However, the RmBNNSs/TPU composite exhibit the minimum efficiency in increasing the E′. The sequence of the enhancement in E′ of the three composites is well agreement with that of thermal conductivity, which can be explained by the orientation degree and interfacial strength. Fig. 9b presents the variation of loss tangent (tan![[thin space (1/6-em)]](https://www.rsc.org/images/entities/char_2009.gif) δ) with temperature. Obviously, the Tg, defined as the temperature corresponding to the peak of tan
δ) with temperature. Obviously, the Tg, defined as the temperature corresponding to the peak of tan![[thin space (1/6-em)]](https://www.rsc.org/images/entities/char_2009.gif) δ curve, is well consistent with the values obtained from DSC curves, with the order of the blank TPU resin < RmBNNSs/TPU < ImBNNSs/TPU < ImBNNS-TDI/TPU, further confirming a strong interfacial interaction in ImBNNS-TDI/TPU.
δ curve, is well consistent with the values obtained from DSC curves, with the order of the blank TPU resin < RmBNNSs/TPU < ImBNNSs/TPU < ImBNNS-TDI/TPU, further confirming a strong interfacial interaction in ImBNNS-TDI/TPU.
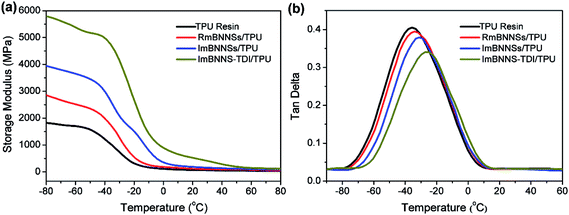 | ||
| Fig. 9 (a) Storage modulus and (b) tan delta of the blank TPU resin and different composites with 10 wt% fillers. | ||
4. Conclusions
In this study, we investigated the thermal conductivity of BNNSs-based composites as a function of filler alignment. The BNNSs surfaces were firstly modified with strong paramagnetic Fe3O4 nanoparticles to make them magnetically responsive. Then, TDI molecules were covalently grafted onto the mBNNSs surfaces to increase the dispersibility and interfacial affinity of mBNNS-TDI within TPU matrix. Finally, the highly-ordered mBNNS-TDI/TPU composites were easily fabricated through a low magnetic field. Owing to the effective surface modification, it is possible to obtain a high orientation degree at high loadings. With the highest filler loading, the in-plane thermal conductivity of ImBNNS-TDI/TPU composite reaches up to 5.15 W m−1 K−1, whereas the ImBNNSs/TPU composite show a relatively low thermal conductivity of 2.48 W m−1 K−1 due to a low orientation degree of fillers at high loading. Furthermore, the ImBNNS-TDI/TPU composites have low dielectric constant, low dielectric dissipation factor and outstanding thermomechanical properties. This work opens a new avenue for the fabrication of high-thermal-performance BNNSs-based elastomer composites, which have great potential in advanced electronic packaging techniques.Conflicts of interest
The authors declare no competing financial interest.Acknowledgements
The works were financially supported by National Natural Science Foundation of China (No. 51402067), and the Foundation for Innovative Research Groups of the National Natural Science Foundation of China (Grant No. 11421091). We are grateful for the constructive comments and valuable advices from all the reviewers for further improvement of our work.References
- Y. Zhou, H. Wang, L. Wang, K. Yu, Z. Lin, L. He and Y. Bai, Mater. Sci. Eng., B, 2012, 177, 892–896 CrossRef CAS.
- X. Huang, T. Iizuka, P. Jiang, Y. Ohki and T. Tanaka, J. Phys. Chem. C, 2012, 116, 13629–13639 CAS.
- Z. Shi, M. Radwan, S. Kirihara, Y. Miyamoto and Z. Jin, Appl. Phys. Lett., 2009, 95, 224104 CrossRef.
- Y. Zhou, H. Wang, F. Xiang, H. Zhang, K. Yu and L. Chen, Appl. Phys. Lett., 2011, 98, 182906 CrossRef PubMed.
- Y. Yao, X. Zeng, K. Guo, R. Sun and J.-b. Xu, Composites, Part A, 2015, 69, 49–55 CrossRef CAS.
- J.-P. Cao, X. Zhao, J. Zhao, J.-W. Zha, G.-H. Hu and Z.-M. Dang, ACS Appl. Mater. Interfaces, 2013, 5, 6915–6924 CAS.
- Y. Li, X. Huang, Z. Hu, P. Jiang, S. Li and T. Tanaka, ACS Appl. Mater. Interfaces, 2011, 3, 4396–4403 CAS.
- L. Ren, K. Pashayi, H. R. Fard, S. P. Kotha, T. Borca-Tasciuc and R. Ozisik, Composites, Part B, 2014, 58, 228–234 CrossRef CAS.
- H. Chen, M. Chen, J. Di, G. Xu, H. Li and Q. Li, J. Phys. Chem. C, 2012, 116, 3903–3909 CAS.
- Z. Han and A. Fina, Prog. Polym. Sci., 2011, 36, 914–944 CrossRef CAS.
- M. Wang, H. Chen, W. Lin, Z. Li, Q. Li, M. Chen, F. Meng, Y. Xing, Y. Yao, C.-p. Wong and Q. Li, ACS Appl. Mater. Interfaces, 2014, 6, 539–544 CAS.
- W. Cui, F. Du, J. Zhao, W. Zhang, Y. Yang, X. Xie and Y.-W. Mai, Carbon, 2011, 49, 495–500 CrossRef CAS.
- X. Huang, C. Zhi and P. Jiang, J. Phys. Chem. C, 2012, 116, 23812–23820 Search PubMed.
- S. Araby, L. Zhang, H.-C. Kuan, J.-B. Dai, P. Majewski and J. Ma, Polymer, 2013, 54, 3663–3670 CrossRef CAS.
- K. M. F. Shahil and A. A. Balandin, Nano Lett., 2012, 12, 861–867 CrossRef CAS PubMed.
- C.-C. Teng, C.-C. M. Ma, C.-H. Lu, S.-Y. Yang, S.-H. Lee, M.-C. Hsiao, M.-Y. Yen, K.-C. Chiou and T.-M. Lee, Carbon, 2011, 49, 5107–5116 CrossRef CAS.
- D. Golberg, Y. Bando, Y. Huang, T. Terao, M. Mitome, C. Tang and C. Zhi, ACS Nano, 2010, 4, 2979–2993 CrossRef CAS PubMed.
- H. Shen, J. Guo, H. Wang, N. Zhao and J. Xu, ACS Appl. Mater. Interfaces, 2015, 7, 5701–5708 CAS.
- Z. Lin, A. McNamara, Y. Liu, K.-s. Moon and C.-P. Wong, Compos. Sci. Technol., 2014, 90, 123–128 CrossRef CAS.
- X. Wang, A. Pakdel, J. Zhang, Q. Weng, T. Zhai, C. Zhi, D. Golberg and Y. Bando, Nanoscale Res. Lett., 2012, 7, 662 CrossRef PubMed.
- H. Wu and M. R. Kessler, ACS Appl. Mater. Interfaces, 2015, 7, 5915–5926 CAS.
- Z. Kuang, Y. Chen, Y. Lu, L. Liu, S. Hu, S. Wen, Y. Mao and L. Zhang, Small, 2015, 11, 1655–1659 CrossRef CAS PubMed.
- S. Yangyang, Z. Zhuqing and C. P. Wong, IEEE Trans. Compon. Packag. Technol., 2006, 29, 190–197 CrossRef.
- T. Kawai and T. Kimura, Polymer, 2000, 41, 155–159 CrossRef CAS.
- K. Uetani, S. Ata, S. Tomonoh, T. Yamada, M. Yumura and K. Hata, Adv. Mater., 2014, 26, 5857–5862 CrossRef CAS PubMed.
- B.-H. Xie, X. Huang and G.-J. Zhang, Compos. Sci. Technol., 2013, 85, 98–103 CrossRef CAS.
- W.-L. Song, P. Wang, L. Cao, A. Anderson, M. J. Meziani, A. J. Farr and Y.-P. Sun, Angew. Chem., Int. Ed., 2012, 51, 6498–6501 CrossRef CAS PubMed.
- E. Munch, M. E. Launey, D. H. Alsem, E. Saiz, A. P. Tomsia and R. O. Ritchie, Science, 2008, 322, 1516–1520 CrossRef CAS PubMed.
- R. Libanori, F. H. L. Münch, D. M. Montenegro and A. R. Studart, Compos. Sci. Technol., 2012, 72, 435–445 CrossRef CAS.
- Z. Lin, Y. Liu, S. Raghavan, K.-s. Moon, S. K. Sitaraman and C.-p. Wong, ACS Appl. Mater. Interfaces, 2013, 5, 7633–7640 CAS.
- C. Yuan, B. Duan, L. Li, B. Xie, M. Huang and X. Luo, ACS Appl. Mater. Interfaces, 2015, 7, 13000–13006 CAS.
- K. Kim, M. Kim, J. Kim and J. Kim, Ceram. Int., 2015, 41, 12280–12287 CrossRef CAS.
- W. Jiao, M. Shioya, R. Wang, F. Yang, L. Hao, Y. Niu, W. Liu, L. Zheng, F. Yuan, L. Wan and X. He, Compos. Sci. Technol., 2014, 99, 124–130 CrossRef CAS.
- R. M. Erb, R. Libanori, N. Rothfuchs and A. R. Studart, Science, 2012, 335, 199–204 CrossRef CAS PubMed.
- H. Xingyi, W. Shen, Z. Ming, Y. Ke, J. Pingkai, B. Yoshio, G. Dmitri and Z. Chunyi, Nanotechnology, 2015, 26, 015705 CrossRef PubMed.
- J. Yu, X. Huang, C. Wu, X. Wu, G. Wang and P. Jiang, Polymer, 2012, 53, 471–480 CrossRef CAS.
- D. S. Muratov, D. V. Kuznetsov, I. A. Il’inykh, I. N. Burmistrov and I. N. Mazov, Compos. Sci. Technol., 2015, 111, 40–43 CrossRef CAS.
- F. Yuan, W. Jiao, F. Yang, W. Liu, J. Liu, Z. Xu and R. Wang, J. Mater. Chem. C, 2017, 5, 6359–6368 RSC.
- Z. Cui, A. J. Oyer, A. J. Glover, H. C. Schniepp and D. H. Adamson, Small, 2014, 10, 2352–2355 CrossRef CAS PubMed.
- H. Zhu, Y. Li, Z. Fang, J. Xu, F. Cao, J. Wan, C. Preston, B. Yang and L. Hu, ACS Nano, 2014, 8, 3606–3613 CrossRef CAS PubMed.
- J. Sun, Y. Yao, X. Zeng, G. Pan, J. Hu, Y. Huang, R. Sun, J.-B. Xu and C.-P. Wong, Adv. Mater. Interfaces, 2017, 1700563 CrossRef.
- A. Prakash, S. Chandra and D. Bahadur, Carbon, 2012, 50, 4209–4219 CrossRef CAS.
- Y. Yao, X. Zeng, R. Sun, J.-B. Xu and C.-P. Wong, ACS Appl. Mater. Interfaces, 2016, 8, 15645–15653 CAS.
- Q. Liu, J. R. de Wijn, K. de Groot and C. A. van Blitterswijk, Biomaterials, 1998, 19, 1067–1072 CrossRef CAS PubMed.
- H.-W. Di, Y.-L. Luo, F. Xu, Y.-S. Chen and Y.-F. Nan, J. Nanosci. Nanotechnol., 2010, 10, 8210–8216 CrossRef CAS PubMed.
- M. T. Huang and H. Ishida, Surf. Interface Anal., 2005, 37, 621–627 CrossRef CAS.
- J. Hou, G. Li, N. Yang, L. Qin, M. E. Grami, Q. Zhang, N. Wang and X. Qu, RSC Adv., 2014, 4, 44282–44290 RSC.
- M. Sousa, F. A. Tourinho and J. Rubim, Use of Raman micro-spectroscopy in the characterization of MIIFe2O4 (M = Fe, Zn) electric double layer ferrofluids, 2000 Search PubMed.
- Y. Huang, J. Lin, Y. Bando, C. Tang, C. Zhi, Y. Shi, E. Takayama-Muromachi and D. Golberg, J. Mater. Chem., 2010, 20, 1007–1011 RSC.
- H. J. Ahn, Y. J. Eoh, S. D. Park and E. S. Kim, Thermochim. Acta, 2014, 590, 138–144 CrossRef CAS.
- Y. Agari, A. Ueda, M. Tanaka and S. Nagai, J. Appl. Polym. Sci., 1990, 40, 929–941 CrossRef CAS.
- T. Zhou, X. Wang, X. Liu and D. Xiong, Carbon, 2010, 48, 1171–1176 CrossRef CAS.
- J. Yu, R. Huo, C. Wu, X. Wu, G. Wang and P. Jiang, Macromol. Res., 2012, 20, 816–826 CrossRef CAS.
- M. Terrones, J. M. Romo-Herrera, E. Cruz-Silva, F. López-Urías, E. Muñoz-Sandoval, J. J. Velázquez-Salazar, H. Terrones, Y. Bando and D. Golberg, Mater. Today, 2007, 10, 30–38 CrossRef CAS.
- W. Peng, X. Huang, J. Yu, P. Jiang and W. Liu, Composites, Part A, 2010, 41, 1201–1209 CrossRef.
- X. Huang, C. Zhi, P. Jiang, D. Golberg, Y. Bando and T. Tanaka, Adv. Funct. Mater., 2013, 23, 1824–1831 CrossRef CAS.
- J. Gu, Q. Zhang, J. Dang and C. Xie, Polym. Adv. Technol., 2012, 23, 1025–1028 CrossRef CAS.
- K. Kim, M. Kim and J. Kim, Compos. Sci. Technol., 2014, 103, 72–77 CrossRef CAS.
- W. Jin, L. Yuan, G. Liang and A. Gu, ACS Appl. Mater. Interfaces, 2014, 6, 14931–14944 CAS.
- M.-H. Tsai, I. H. Tseng, J.-C. Chiang and J.-J. Li, ACS Appl. Mater. Interfaces, 2014, 6, 8639–8645 CAS.
Footnote |
| † Electronic supplementary information (ESI) available. See DOI: 10.1039/c7ra08516h |
| This journal is © The Royal Society of Chemistry 2017 |

