 Open Access Article
Authentication of Panax ginseng from different regions†
Juxin Yin ab,
Liwu Wanga,
Yi Huanga,
Ying Mub and
Shaowu Lv*a
aCollege of Life Science, Key Laboratory for Molecular Enzymology, Engineering of the Ministry of Education, Jilin University, Changchun 130000, Jilin, China. E-mail: lvsw@jlu.edu.cn
bResearch Center for Analytical Instrumentation, Institute of Cyber-Systems and Control, State Key Laboratory of Industrial Control Technology, Zhejiang University, Hangzhou 310000, China
First published on 8th December 2017
Abstract
Background: Panax ginseng is a type of traditional medicine. Fresh ginseng is one of the most important ingredients used in the medical industry. Fresh ginseng from different regions has different quality and significantly different prices; consequently, widespread adulteration occurs in the commercial market. However, little scientific guidance for determining the origin of fresh ginseng from different regions is available. We proposed a new strategy for identifying fresh ginseng from different regions. Methods: we investigated the content of ginsenoside, and the activity and gene expression of seven key enzymes involved in ginsenoside biosynthesis. HPLC was used to determine the content of ginsenosides. Gene expression was studied using qRT-PCR. HPLC, GC-MS, LC-MS, enzyme-linked immunosorbent assayand colorimetry were used to measure the activities of key enzymes. Results: the gene expression of the key enzymes 3-hydroxy-3-methylglutaryl CoA reductase (HMGR) and dammarenediol synthase (DS) was consistent with the saponin content of fresh ginseng from different regions. The correlation of gene expressions of HMGR and DS, and the content of the ginsenoside Re with total ginsenoside content, was significant. Conclusion: HMGR and DS gene expression and the content of the ginsenoside Re are important for the authentication of ginseng from different regions. Our research provides an important reference for further studies on the regulatory mechanism of the biosynthetic pathway of ginsenosides.
1. Introduction
The roots of Asian ginseng (Panax ginseng Meyer), which are used as an important herbal medicine, have existed for thousands of years in China, Japan, and Korea.1 The roots have crucial medicinal value, and their effectiveness reaches legendary proportions in traditional culture.2,3 Modern medicine has proved that the most important active ingredients are ginsenosides, which have significant effects on humans, including anti-cancer,4,5 immunomodulatory, and anti-diabetic6,7 effects. The ginsenosides could be classified into two groups (dammarane type and oleanane type) based on the structure of aglycones. The dammarane ginsenoside, which is the most common type of ginsenoside, consists of protopanaxadiol- and protopanaxatriol-type saponins.2 The ginsenoside biosynthesis pathway of dammarane-type ginsenosides has been reported previously.8–10 As shown in Fig. 1, the biosynthesis of ginsenoside is mainly completed in three reaction steps. In the first step, isopentenyl diphosphate (IPP) and its isomer, dimethylallyl diphosphate (DMAPP), are generated by several reactions, and the key enzyme is 3-hydroxy-3-methylglutaryl CoA reductase (HMGR). In the second stage, farnesyl diphosphate (FPP) is produced by the catalytic activity of farnesyl diphosphate synthase (FPS). FPP generates squalene by the activity of squalene synthase (SS).9 Thereafter, 2,3-oxidosqualene, which is essential for the synthesis of protopanaxadiol, is formed by squalene epoxidase (SE) from squalene. The second-stage reactions mentioned above could provide the carbon of the isoprenoid pathway for triterpene biosynthesis. The metabolite 2,3-oxidosqualene could be converted to protopanaxadiol in a reaction that is dependent on dammarenediol synthase (DS). Cytochrome P450 (CYP450), which is involved in modifications of the ring and side chain in terpene biochemistry, could convert protopanaxadiol to protopanaxatriol. Finally, different amounts monosaccharides are added to the triterpene aglycones by glycosyltransferase (GT), and the procedure leads to the generation of different ginsenosides.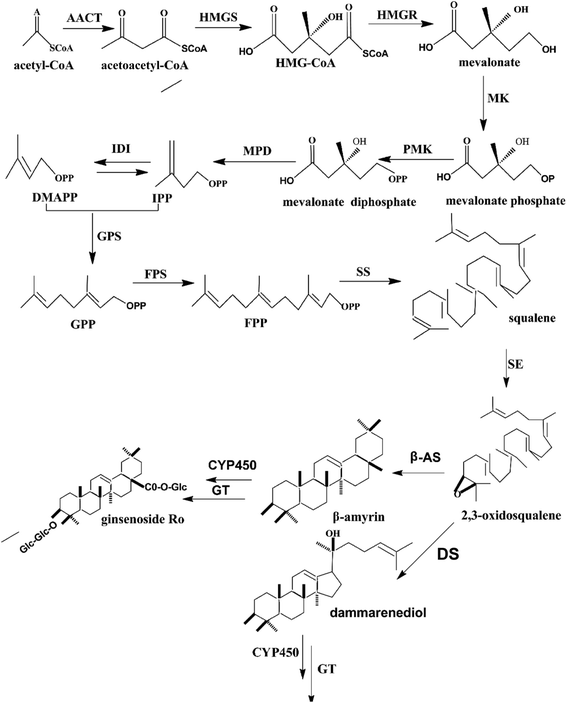 | ||
| Fig. 1 Biosynthesis pathway of the ginsenoside, dammarane. Key enzymes (HMGR, FPS, SS, SE, DS, CYP450, and GT) involved in the synthesis process are displayed. | ||
In recent years, hairy roots induced by Agrobacterium rhizogene infection are receiving increasing attention because they are fast growing, easy to extract, and contain a stable gene. Although such hairy roots are used in many research fields, including genomics and metabolomics,11,12 they are not suitable for research on fresh ginseng, such as those grown in gardens, on which the economy of the northeastern region of China depends. The roots of fresh ginseng have a much higher market value than dried roots, and the highest content of malonyl ginsenosides, amino acids, and polysaccharides are present in fresh ginseng.13,14 As an important traditional and folk medicine in China, Japan, and Korea,5 the medical effect of cultivated ginseng might be better than that of wild ginseng.15 Fresh ginseng from different regions differ significantly in quality, and therefore in prices, leading to widespread adulteration in the commercial market. However, studies until date have not provided scientific guidance for the distinguishing fresh ginseng from different regions. For a long time, the recognition of a certain type of ginseng relied on empirical personal experience, such as the completeness of the external shape and the amount of roots. Owing to the lack of effective methods of identifying ginseng from different regions, customers often pay more for ginseng that is not of the desired quality, resulting in loss of faith towards its medicinal properties. Therefore, a more reliable means of quality determination is required to recognize the origin of ginseng and restore the confidence of the customers.16 Meanwhile, the development of modified atmospheres packing (MAP) makes the research on cultivated ginseng possible by increasing the duration of storage.14,17–20
In the present study, we used fresh ginseng collected during the month of harvest from various regions and measured the content of total and individual ginsenosides, in addition to the transcription level and activities of seven key enzymes. Further, we proposed a strategy that combines the content of total ginsenoside, single ginsenoside types, gene expression, and activity of key enzyme to find a marker that has significant correlation with the total ginsenoside content in fresh ginseng. The results could be used to evaluate the quality of fresh ginseng and for the authentication of its region of origin.
2. Materials and methods
2.1 Samples
Fresh ginseng growing for five years was sampled (60 per year) from different regions [Ji An (JA), Jing Yu (JY), Fu Song (FS), Wang Qing (WQ)] of Jilin province, China in October 2015 and 2016. The fresh ginseng was stored using the MAP method.172.2 Total saponin content
One gram of the roots was homogenized with a cryogenic grinding machine (Jingxin Industrial Development Co., Ltd., Shanghai, China) and placed in a centrifuge tube; thereafter, 10 mL of 70% ethanol was added, followed by shaking at a speed of 100 rpm overnight.The sample was treated three times with ultrasonic waves (40 kHz). The solution extracted was allowed to evaporate during rotation until no liquid residue remained. Distilled water (10 mL) and ether (10 mL) were added into the separator funnel, the process was repeated three times, and aqueous layer was obtained. The aqueous layer was extracted three times by water-saturated butanol (10 mL). Distilled water (10 mL) was added thrice to remove polysaccharides and obtain the organic layer. The solution was subjected to rotatory evaporation until no liquid residue remained. Chromatographically pure methanol solution (10 mL) was added and the resultant solutions were stored in brown bottles to avoid photooxidation.
2.3 Analysis of ginsenosides by HPLC
The samples were dissolved in methanol and filtrated through a 0.45 μm filter for HPLC analysis. HPLC was performed on an HPLC-20A system (Shimadzu, Japan), equipped with an auto sampler and an UV detector using a C18 column (250 mm × 50 mm, 4.6 μm; Agilent, USA). The mobile phase was solvent A (100% acetonitrile) and solvent B (100% water) and the following gradient program was used: 0–32 min, 18% A (isocratic); 32–50 min, 18–25% A; 50–70 min, 25–30% A; 70–100 min, 30–35% A; 100–120 min, 35–70% A. The sample injection volume was 10 μL and the temperature was 25 °C. The flow rate was 1.0 mL min−1 and UV absorption was measured at 203 nm. Quantitative analysis was performed using the standard curve method and external standards of authentic ginsenoside.2.4 Quantification of transcript levels
In order to investigate the correlation of gene expression with total ginsenoside content, we measured the transcription level of the key enzymes in fresh ginseng from different regions using RT-PCR. One-hundred milligrams of roots were mashed with a cryogenic grinding machine. Total RNA was extracted from the ginseng with the MiniBEST universal RNA extraction Kit (Takara, Japan) which included the DNase I digestion step. Thereafter, total RNA was reverse transcribed with the PrintScript RT reagent Kit containing gDNA Eraser (Takara, Japan). Quantitative real-time polymerase chain reaction (qRT-PCR) was performed using 1 μg cDNA in a 20 μL reaction volume using SYBR Premix Ex Taq™ (Takara, Japan). The thermal cycler conditions recommended by the manufacturer were used: 10 min at 95 °C, followed by 40 cycles at 95 °C for 3 s and 60 °C for 34 s. The fluorescent product was detected during the final step of each cycle. Amplification, detection, and data analysis were carried out on an ABI 7500 real-time rotary analyzer (ABI, USA). The primers used are listed in ESI S1.† To determine the relative fold-differences in template abundance for each sample, the Ct values for each of the gene-specific primers were normalized to the Ct value for GAPDH (5′-GGTGTAACCTAAGATTCCCTTGAGT-3′ and 5′-ACTGTCAGGTTGGCGAAGAAG-3′) and calculated relative to a calibrator using the formula 2−ΔΔCt.2.5 Enzyme activity assay
![[thin space (1/6-em)]](https://www.rsc.org/images/entities/char_2009.gif) :
:![[thin space (1/6-em)]](https://www.rsc.org/images/entities/char_2009.gif) water (85
water (85![[thin space (1/6-em)]](https://www.rsc.org/images/entities/char_2009.gif) :
:![[thin space (1/6-em)]](https://www.rsc.org/images/entities/char_2009.gif) 15, v/v), the flow rate was 1.0 mL min−1, the column temperature was 30 °C, and the detection wavelength was 203 nm. The MS operating conditions were as follows: all spectra were obtained in the positive mode of the electrospray ionization source (ESI), Decluster Potential (DP) voltage was 70 V, and a Collision Potential (EP) voltage was 30 V. The amount of product (dammarenediol) was calculated by comparing with the peak area ratio of the standard (1 mg L−1).
15, v/v), the flow rate was 1.0 mL min−1, the column temperature was 30 °C, and the detection wavelength was 203 nm. The MS operating conditions were as follows: all spectra were obtained in the positive mode of the electrospray ionization source (ESI), Decluster Potential (DP) voltage was 70 V, and a Collision Potential (EP) voltage was 30 V. The amount of product (dammarenediol) was calculated by comparing with the peak area ratio of the standard (1 mg L−1).![[thin space (1/6-em)]](https://www.rsc.org/images/entities/char_2009.gif) 000g for 10 min, n-butanol phase was collected, and the n-butanol was evaporated under reduced pressure at 5 °C and dissolved in 0.05 mL of HPLC grade methanol. The amount of enzyme required to produce 1 μmol Rg3 in 1 min at 37 °C was defined as 1 unit of enzyme activity. Quantitative detection of Rg3 production was performed by detecting the standard curve of different concentrations of Rg3.
000g for 10 min, n-butanol phase was collected, and the n-butanol was evaporated under reduced pressure at 5 °C and dissolved in 0.05 mL of HPLC grade methanol. The amount of enzyme required to produce 1 μmol Rg3 in 1 min at 37 °C was defined as 1 unit of enzyme activity. Quantitative detection of Rg3 production was performed by detecting the standard curve of different concentrations of Rg3.2.6 Statistical analysis
The correlation analysis was conducted using SPSS software (IBM, USA). The confidence coefficients among the groups of data were compared using the paired t-test at the P < 0.05 level. The results of correlation analyses were visualized using R.25 The results were tested by Tukey's multiple comparison test (total saponin content).3. Results and discussion
3.1 Correlation of total ginsenoside content with that of single ginsenosides
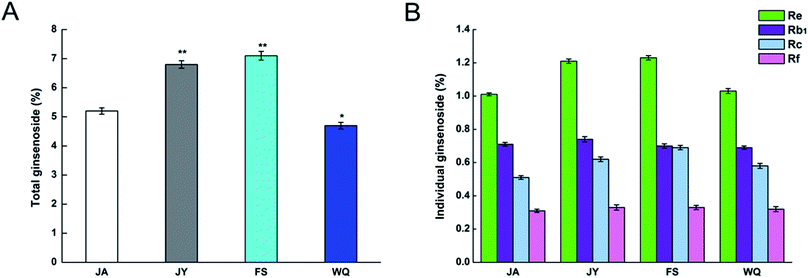
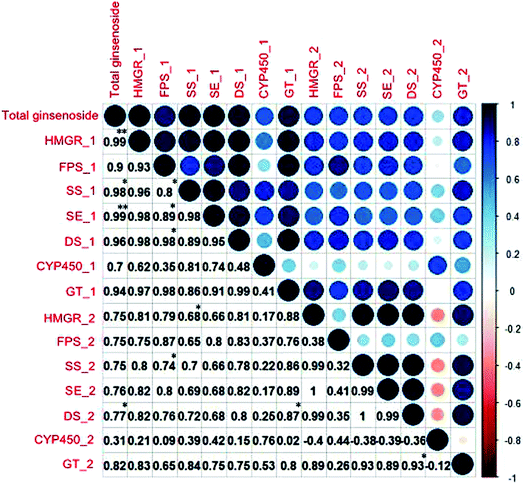
We purchased the different fresh ginseng in October. The individual ginsenosides were identified by HPLC in Fig. 2. The content of total ginsenoside and individual ginsenoside (Fig. 3), measured by the vanillin–perchloric acid colorimetric method and the HPLC, revealed that the total saponin of JY, FS, and WQ had significant difference as compared with that of JA. FS had the highest content, approximately 2% more than that of WQ. The content of ginsenoside determined the quality of ginseng. In addition, the quality of ginseng from the four regions differed significantly. The content of ginsenosides Re and Rc differed significantly among regions. However, Re and Rc content was consistent with the trend of total saponin content, indicating that the Re and Rc content might have significance in the discrimination of ginseng from different regions. The content of single ginsenosides (Re, Rc, Rf) and total ginsenoside content were strongly correlated (Fig. 4). Nevertheless, only the Re content in fresh ginseng differed significantly among regions. These results indicate that the Re content may be useful in distinguishing ginseng from different regions.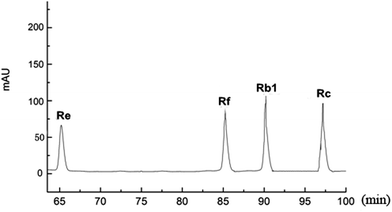 | ||
| Fig. 2 The retention time of different ginsenosides. (The mixture of standards of individual dammarane. Ginsenosides in the root were analyzed by HPLC and were separated at different time points.) | ||
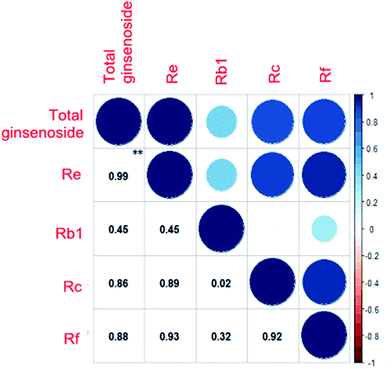 | ||
| Fig. 4 Correlation of the content of total ginsenoside and single ginsenosides. Deeper colors and larger circles indicate stronger correlation, **P < 0.01. | ||
Several studies on different species of ginseng were based on single-nucleotide polymorphisms (SNP), such as American ginseng and Oriental ginseng.26–30 However, the SNPs were developed from single cultivars and had not been screened across ginseng from different regions for authentication. Different growth conditions affect saponin content.31,32 In the present study, we proposed that a marker having statistical correlation with the total saponin content might be related to the quality of ginseng, and it might be suitable for the identification of ginseng from different regions. The percentage of the ginsenoside Re differed among regions. This ginsenoside is well-known as an anti-inflammatory and anti-diabetic substance.33 Chan et al.34 reported that the ratio of Rg1![[thin space (1/6-em)]](https://www.rsc.org/images/entities/char_2009.gif) :
:![[thin space (1/6-em)]](https://www.rsc.org/images/entities/char_2009.gif) Re varied across two species of ginseng. In these species, the content of Re was the highest among the ginsenosides.35 Therefore, in ginseng from different regions, the Re content will determine the content of total ginsenoside. Moreover, it has potential use as a marker for differentiating among ginseng from different regions.
Re varied across two species of ginseng. In these species, the content of Re was the highest among the ginsenosides.35 Therefore, in ginseng from different regions, the Re content will determine the content of total ginsenoside. Moreover, it has potential use as a marker for differentiating among ginseng from different regions.
3.2 Correlation of gene expression with total ginsenoside content
The expression of almost all genes was found to be significantly higher in the FS group than in ginseng from other regions (Fig. 5). The gene expression of the key enzymes HMGR, FPS, SE, and DS was consistent with the content of saponins in fresh ginseng from different regions (FS > JY > JA > WQ), which probably explained the variation in saponin content among regions and indicated that these four enzymes might have significance in differentiating among the regions of origin.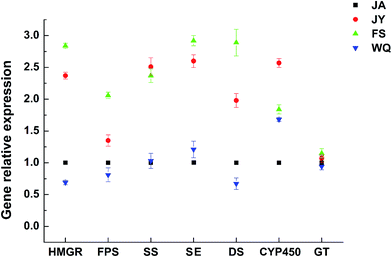 | ||
| Fig. 5 Gene expression of key enzymes in ginseng from different regions (the JA region was used as the control group, n = 8). | ||
The order of the correlation of gene expression with saponin content (Fig. 6) was HMGR (0.99) > SE (0.99) > SS (0.98) > DS (0.96) > GT (0.94) > FPS (0.9) > CYP450 (0.7). However, this correlation was significant only for HMGR and DS (P < 0.05). However, HMGR, FPS, SE, DS content was consistent with that of saponin, and the correlation analysis revealed that only the gene expression of HMGR and DS significantly discriminated among ginseng from different regions.
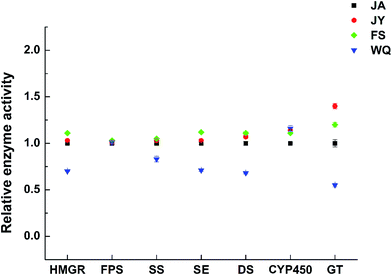 | ||
| Fig. 6 Changes in enzyme activity in fresh ginseng from different regions (the JA region was used as the control group, n = 60). | ||
The activities of almost all key enzymes were higher in the FS group than in ginseng from the other regions (Fig. 7). The activities of almost all enzymes were the highest in FS ginseng, which is consistent with the transcription level and the content of ginsenoside. Further, the activities of four key enzymes (HMGR, SS, SE, and DS) were consistent with the order of saponin content in ginseng from different regions, which might indicate that the four enzymes will have significance in authenticating ginseng from different regions. However, the correlation was not significant.
HMGR is a key rate-limiting enzyme in the mevalonic acid pathway. Its overexpression has been used to increase the carbon flux through the mevalonic acid pathway and increase the production of many terpenoids, including triterpenoids and diterpenoids.36–38 Meanwhile the reduction of its expression could reduce the content of ginsenosides. Moreover, HMGR plays an important role in the accumulation of ginsenosides over years.39 The expression of HMGR could determine the content of saponins. Different regions have different contents of total ginsenosides; differences in the expression of HMGR might underlie this difference and thus be of significance for identifying ginseng from different regions.
DS is a key enzyme in the biosynthesis of different ginsenosides among the ginseng cultivars.40 It could synthesize dammarenediol, which is the main precursor of several ginsenosides, and have many pharmacological effects. DS is the key enzyme that determines the production rate of the dammarane-type ginsenoside precursor dammarenediol-II, and its overexpression could enhance the content of ginsenosides.41,42 Several studies have reported that the DS gene could be used to discriminate among different kinds of ginseng.41,43
The aim of this present study was to elucidate the effects of environmental conditions on ginsenoside synthase activity, gene expression, and ginsenoside content in ginseng from different regions of Jilin Province, and to study the correlation between saponin synthase activity, gene expression, and ginsenoside content in different regions. We randomly collected 60 ginseng samples in different areas of ginseng cultivation. Although climate, soil, planting altitude, planting habit, and other factors could affect saponin synthase activity, gene expression, and ginsenoside content, the effects of these factors can be attributed to the effect of regional elements.44,45 We have investigated fresh ginseng from four regions of Jilin province. A new strategy for the discrimination of fresh ginseng from different regions using the ginsenoside Re and gene expression profiles of HMGR and DS was demonstrated. In order to verify whether the measured indicators are universal, ginseng sampled from more areas should be investigated.
Author contribution statement
Juxin Yin, Ying Mu, Shaowu Lv designed the experiments; Juxin Yin, Liwu Wang, and Shaowu Lv performed the experiments; Juxin Yin and Yi Huang analyzed the data; Juxin Yin and Liwu Wang wrote the paper; and all the authors reviewed the manuscript.Conflicts of interest
The authors have no competing financial interests to declare.Acknowledgements
This research was supported by grants from the National Key Scientific Instrument and Equipment Development Project of China (No. 2013YQ470781) and the Open Research Project of the State Key Laboratory of Industrial Control Technology, Zhejiang University, China (No. ICT170297).References
- A. S. Attele, J. A. Wu and C. S. Yuan, Biochem. Pharmacol., 1999, 58, 1685–1693 CrossRef CAS PubMed.
- Y. J. Kim, J. N. Jeon, M. G. Jang, J. Y. Oh, W. S. Kwon, S. K. Jung and D. C. Yang, J. Ginseng Res., 2014, 38, 66–72 CrossRef CAS PubMed.
- L. Chow, M. Johnson, A. Wells and A. Dasgupta, J. Clin. Lab. Anal., 2003, 17, 22–27 CrossRef CAS PubMed.
- H. Kaneko and K. Nakanishi, J. Pharmacol. Sci., 2004, 95, 158–162 CrossRef CAS.
- Q. H. Zhang, C. F. Wu, L. Duan and J. Y. Yang, Food Chem. Toxicol., 2008, 46, 293–302 CrossRef CAS PubMed.
- K. T. Choi, Acta Pharmacol. Sin., 2008, 29, 1109–1118 CrossRef CAS PubMed.
- J. T. Xie, S. R. Mehendale, X. M. Li, R. Quigg, X. Y. Wang, C. Z. Wang, J. A. Wu, H. H. Aung, P. A. Rue, G. I. Bell and C. S. Yuan, BBA, Mol. Basis Dis., 2005, 1740, 319–325 CrossRef CAS PubMed.
- S. J. Zhao, L. Wang, L. Liu, Y. L. Liang, Y. Sun and J. J. Wu, Plant Cell Rep., 2014, 33, 393–400 CrossRef CAS PubMed.
- R. Xu, G. C. Fazio and S. P. T. Matsuda, Phytochemistry, 2004, 65, 261–291 CrossRef CAS PubMed.
- Z. Y. Luo, Q. H. Lu, S. P. Liu, X. H. Chen, J. Q. Luo, L. J. Tan and W. X. Hu, Acta Biochim. Biophys. Sin., 2003, 35, 554–560 CAS.
- S. Guillon, J. Tremouillaux-Guiller, P. K. Pati, M. Rideau and P. Gantet, Trends Biotechnol., 2006, 24, 403–409 CrossRef CAS PubMed.
- B. Zhivotovsky, D. Burgess and S. Orrenius, Cell. Mol. Life Sci., 1996, 52, 968–978 CrossRef CAS PubMed.
- J. Y. Wan, Y. Fan, Q. T. Yu, Y. Z. Ge, C. P. Yan, R. N. Alolga, P. Li, Z. H. Ma and L. W. Qi, J. Pharm. Biomed. Anal., 2015, 107, 89–97 CrossRef CAS PubMed.
- T. Z. Jin, M. Y. Huang, B. A. Niemira and L. Y. Cheng, Int. J. Food Sci. Technol., 2016, 51, 2132–2139 CrossRef CAS.
- J. M. He, Y. Z. Zhang, J. P. Luo, W. J. Zhang and Q. Mu, Nat. Prod. Commun., 2016, 11, 739–740 Search PubMed.
- Y. W. Ying, W. Jin, B. W. Yu, S. W. Lv, X. F. Wu, H. X. Yu, J. Shan, D. Zhu, Q. H. Jin and Y. Mu, Anal. Methods, 2016, 8, 5079–5086 RSC.
- W. Z. Hu, A. L. Jiang and H. P. Qi, J. Food Sci. Technol., 2014, 51, 3862–3869 CrossRef CAS PubMed.
- W. Z. Hu, S. Tanaka, T. Uchino, D. Hamanaka and Y. Hori, J. Fac. Agric., Kyushu Univ., 2004, 49, 139–147 Search PubMed.
- W. Z. Hu, P. Xu and T. Uchino, J. Sci. Food Agric., 2005, 85, 2475–2481 CrossRef CAS.
- D. Macura, A. M. McCannel and M. Z. C. Li, Food Res. Int., 2001, 34, 123–125 CrossRef.
- J. K. Dozier and M. D. Distefano, Anal. Biochem., 2012, 421, 158–163 CrossRef CAS PubMed.
- D. Jiang, Q. Rong, Y. Chen, Q. Yuan, Y. Shen, J. Guo, Y. Yang, L. Zha, H. Wu, L. Huang and C. Liu, Int. J. Biol. Macromol., 2017, 95, 658–666 CrossRef CAS PubMed.
- W. Hu, N. Liu, Y. H. Tian and L. X. Zhang, BioMed Res. Int., 2013, 285740–285746 Search PubMed.
- M. Dietrich, S. Eiben, C. Asta, T. A. Do, J. Pleiss and V. B. Urlacher, Appl. Microbiol. Biotechnol., 2008, 79, 931–940 CrossRef CAS PubMed.
- R. C. Team, 2014, ISBN 3-900051-07-0, http://www.R-project.org.
- H. K. Kwon, C. H. Ahn and Y. E. Choi, J. Med. Plants Res., 2009, 3, 957–U4001 CAS.
- X. M. Cui, C. K. Lo, K. L. Yip, T. T. X. Dong and K. W. K. Tsim, Planta Med., 2003, 69, 584–586 CrossRef CAS PubMed.
- S. L. Chen, H. Yao, J. P. Han, C. Liu, J. Y. Song, L. C. Shi, Y. J. Zhu, X. Y. Ma, T. Gao, X. H. Pang, K. Luo, Y. Li, X. W. Li, X. C. Jia, Y. L. Lin and C. Leon, PLoS One, 2010, 5, e8613 Search PubMed.
- D. U. Yang, M. K. Kim, P. Mohanan, R. Mathiyalagan, K. H. Seo, W. S. Kwon and D. C. Yang, J. Ginseng Res., 2017, 41, 31–35 CrossRef PubMed.
- H. T. Wang, G. S. Li, W. S. Kwon and D. C. Yang, Int. J. Mol. Sci., 2016, 17, 884–895 CrossRef PubMed.
- H. Wang, J. Wang and G. Li, GMR, Genet. Mol. Res., 2016, 15, 15028801 Search PubMed.
- J. Jung, K. H. Kim, K. Yang, K. H. Bang and T. J. Yang, J. Ginseng Res., 2014, 38, 123–129 CrossRef CAS PubMed.
- A. S. Attele, Y. P. Zhou, J. T. Xie, J. A. Wu, L. Zhang, L. Dey, W. Pugh, P. A. Rue, K. S. Polonsky and C. S. Yuan, Diabetes, 2002, 51, 1851–1858 CrossRef CAS PubMed.
- T. W. D. Chan, P. P. H. But, S. W. Cheng, I. M. Y. Kwok, F. W. Lau and H. X. Xu, Anal. Chem., 2000, 72, 1281–1287 CrossRef CAS PubMed.
- W. Shi, Y. T. Wang, J. Li, H. Q. Zhang and L. Ding, Food Chem., 2007, 102, 664–668 CrossRef CAS.
- J. H. Chun, P. B. Adhikari, S. B. Park, J. Y. Han and Y. E. Choi, Plant Cell Rep., 2015, 34, 1551–1560 CrossRef CAS PubMed.
- Y. K. Kim, J. K. Kim, Y. B. Kim, S. Lee, S. U. Kim and S. U. Park, J. Agric. Food Chem., 2013, 61, 1928–1934 CrossRef CAS PubMed.
- Q. Wu, C. Sun and S. L. Chen, Plant Omics, 2012, 5, 414–420 CAS.
- Y. J. Kim, O. R. Lee, J. Y. Oh, M. G. Jang and D. C. Yang, Plant Physiol., 2014, 165, 373–387 CrossRef CAS PubMed.
- S. Dutta and M. Mallick, Rev. Palaeobot. Palynol., 2017, 237, 96–99 CrossRef.
- Y. S. Lee, H. S. Park, D. K. Lee, M. Jayakodi, N. H. Kim, H. J. Koo, S. C. Lee, Y. J. Kim, S. W. Kwon and T. J. Yang, Front Plant Sci., 2017, 8, 1048–1054 CrossRef PubMed.
- L. Wang, S. J. Zhao, H. J. Cao and Y. Sun, Funct. Integr. Genomics, 2014, 14, 545–557 CrossRef CAS PubMed.
- C. S. Cheng, W. R. Wu, B. M. Huang, L. Liu, P. Luo and H. Zhou, Phytochem. Lett., 2016, 17, 194–200 CrossRef CAS.
- J. M. Follett, J. T. Proctor, E. F. Walton, H. L. Boldingh, C. McNamara and J. A. Douglas, J. Ginseng Res., 2004, 28, 165–172 CrossRef CAS.
- M.-J. Lee, J.-S. Choi, S.-W. Cha, K.-S. Lee, Z.-W. Lee, G.-S. Hwang, S. H. Lee, A. H. M. Kamal, Y.-A. Jung and N.-S. Seung, Process Biochem., 2011, 46, 258–264 CrossRef CAS.
Footnote |
| † Electronic supplementary information (ESI) available. See DOI: 10.1039/c7ra09537f |
| This journal is © The Royal Society of Chemistry 2017 |

