 Open Access Article
Creative Commons Attribution 3.0 Unported Licence
Insights into energy-efficient and eco-friendly sealing of anodic aluminum oxide film holes with alkaline earth metal salts†
Hongyang Weia,
Dongchu Chen*a,
Huawen Hu *a,
Menglei Changa,
Xiufang Yea and
Meifeng Wangb
aSchool of Material Science and Energy Engineering, Foshan University, Foshan 528000, Guangdong, China. E-mail: cdcever@163.com; huawenhu@126.com
bSchool of Material Science and Engineering, Nanchang Hangkong University, Nanchang 330063, China
First published on 8th December 2017
Abstract
In this study, the impact of various sealing conditions on the quality of the sealed anodic aluminum oxide (AAO) film is systematically investigated, which leads us to gain insights into sealing the AAO film. To this end, magnesium acetate and calcium acetate are employed as the main compositions of the sealant. It is demonstrated that the temperature exerts the greatest influence on the quality of the sealed film based on the weight loss and antistaining adsorption evaluations among the other examined conditions, followed by pH, mixed salts, surfactants, and complexants. For the optimized sample, the minima of the staining level and weight-loss ratio can reach 0 and 13.4 mg dm−2, respectively, meeting the requirement of the ISO standard. This work also realizes an energy-efficient sealing of the AAO film at intermediate temperatures (75–85 °C). The potentiodynamic scanning and electrochemical impedance spectroscopy measurements reveal that the AAO film sealed by the alkaline earth metal salt possesses a superior corrosion resistance as compared to the one sealed by the conventional nickel salt. Additionally, the potential can be stable in a faster way at higher temperatures over the range of 70–85 °C, as demonstrated in the E–t curve. On the other hand, the potential stabilization is more readily achieved at higher pH values within the range of 5–7, whereas it cannot be realized at pH values above 7. We also note that the appropriate addition of surfactant, complexant and pH buffer can assist in stabilizing the potential. In the absence of any surfactants and complexants, the potential stabilization cannot be reached. Furthermore, the present study discusses the mechanism underlying the effective sealing, thereby paving the way for the future exploration of the energy-efficient and eco-friendly sealing technologies for many practical AAO-based applications.
Introduction
As one of the largest categories of metallic materials, aluminum and its alloys have been used extensively in the scientific and engineering communities.1 This can be attributed to their light weight, high specific strength, and superior physicochemical properties.1c,e–g Generally, before practical applications of the aluminum and its alloys, it is of technical importance and significance to form an oxidation film (with a certain thickness) on their surface for the purpose of protection from external physical and chemical corrosions, especially the anodic aluminum oxidation (AAO) film, as the focus of wide concern and generated by electrochemistry.1g,h,2 However, the formed AAO film possesses a large quantity of micropores3 that facilitate the corrosion media to diffuse through it and then to contact with aluminum substrate, causing the corrosion of aluminum alloys. Moreover, microporous oxidation film is ready to be contaminated due to a micropore adsorption effect.4 As a consequence, it is highly desirable to appropriately seal the micropores of the oxidation film.5 Many hole sealing methods have thus been explored, primarily including boiling water (steam), nickel salts, and polymer resins-based sealing.6 However, some obvious defects of these sealing methods seriously limit their widespread applications, such as (i) high energy consumption and low sealing quality as for the steam-based sealing, (ii) strong toxicity of nickel salts which pose serious threats to the environment and humans regarding the nickel slat-based sealing, and (iii) a strong barrier for diffusion of the larger polymer molecules into the interior of the oxidation film, in addition to the unwanted change of the surface properties of the oxidation film after the polymer resin-based sealing, thus debasing the sealing effect.1a,6a,bIn these regards, there is a pressing need to develop an energy-efficient, eco-friendly, and highly corrosion-resistant sealing method. Actually, many attempts have been made to fill the micropores of the AAO film using different kinds of rare earth compositions by immersing the rare earth metal salts into the anodic oxidation solution,7 but such a direct immersion is not able to incorporate the rare earth metal compositions into the interior of the AAO film pores.7b Alternatively, hole sealing of the AAO film is also realized by chemical treatment and electrochemical deposition processing of the porous structure.8 Nevertheless, only a mediocre sealing quality and hence a moderate corrosion resistance can be usually obtained, indicating that further efforts are required to improve the sealing quality relative to that achieved by many conventional sealing methods.
The hole sealing of AAO films based on alkaline earth metal salts lies in using alkaline metal salts or alkaline earth metal salts as the main compositions of the sealant. Such a sealing method is environmentally friendly and cost-efficient. A number of studies have been reported on the hole sealing of AAO films based on alkaline earth metal salts,1c,d,6b but the sealing mechanism has not been explored by far, with the focus primarily on obtaining high-quality sealed AAO films. Therefore, in this study, magnesium acetate and calcium acetate are adopted as the main composition of the sealant for sealing the holes of the AAO film. The sealing condition is systematically investigated, so as to unravel the mechanism underlying the effective sealing of the AAO film. The sealing quality is evaluated on the basis of the antistaining adsorption and weight loss tests. Not only does this study find the best conditions for high-quality sealing of the AAO film, but it also puts forward the mechanism underlying the effective sealing.
Results and discussion
Optimization of the sealing formulation based on nickel-free alkaline earth metal salts
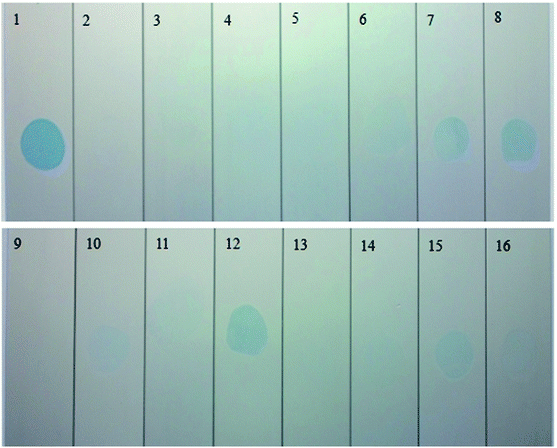
Fig. 1a shows the antistaining effect of the prepared samples 1–16. Before the staining treatment with the blue colorant (with the international color no. 69#), the sample surface was cleaned and dried. Then, the samples were immersed into the colorant for 1 min, followed by thoroughly scrubbing for 20 s with a cotton fabric that had been dipped in a suspension of magnesium oxide. Upon extensively washing and drying, the stained samples were finally obtained, as presented in the following Fig. 1. The antistaining adsorption test is one of the methods for evaluating the sealing quality of the AAO film. From Fig. 1, it can be noted that the samples 1, 8 and 12 exhibit an apparent remnant color after scrubbing the stained region, revealing a strong adsorption power of the AAO film and hence an ineffective antistaining adsorption ability. In contrast, after scrubbing the stained surface, the samples 6, 7, 10, 11, 14, 15 and 16 show a shallow remnant color, indicative of good antistaining adsorption ability. Impressively, the samples 2, 3, 4, 5, 9 and 13 display the best antistaining adsorption effect, as judged by the almost indistinguishable colored region after scrubbing the stained surface. The antistaining adsorption effect of the stained samples is evaluated according to the ISO2143:2010 standard, with comparison histograms presented in Fig. 2a. From Fig. 2a, staining level 0 can be noticed for the samples 2, 3, 4, 5, 9 and 13, while level 1 can be assigned to the samples 6, 7, 10, 11, 14, 15 and 16. The samples 8 and 12 reach level 2 of staining. The lowest level 3 is found for the sample 1. The lower the staining level, the stronger the antistaining adsorption ability. This indicates that the staining level 0 or 1 is corresponding to strong antistaining adsorption ability of the sealed samples that thereby possessing a superior sealing quality.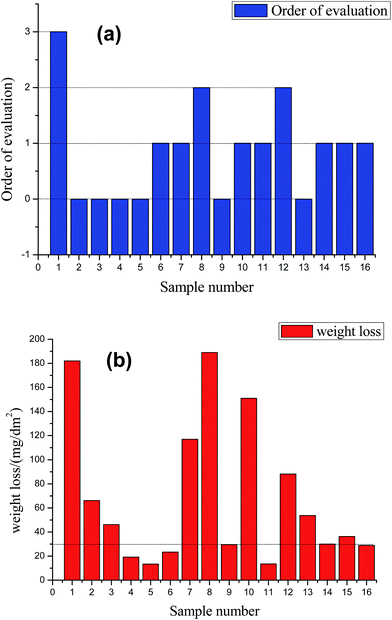 | ||
| Fig. 2 Evaluation of the sealing quality for various samples based on the antistaining adsorption (a) and weight loss test (b). | ||
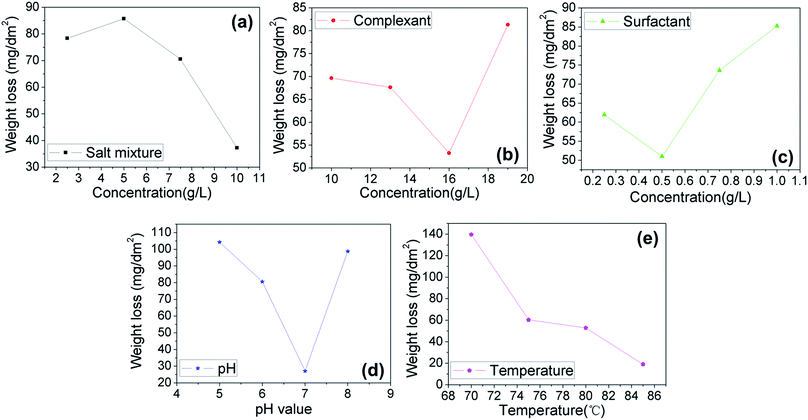
Apart from the antistaining adsorption evaluation, this study also adopted the weight loss test to further evaluate the sealing quality of the samples 1–16, with the results given in Fig. 2b. According to the ISO3210:19835 standard, the samples with the weight loss of below 30 mg dm−2 are qualified. It can be noted that the samples 4, 5, 6, 9, 11, and 16 exhibit a weight loss smaller than 30 mg dm−2, revealing a qualified sealing. The remaining samples have an excessive weight loss, implying a poor anticorrosion performance and a low sealing quality. For the samples 4, 5, 6, 9, 11, and 16, the weight loss values are estimated as 19.2, 13.4, 23.4, 29.4, 13.5 and 28.9 mg dm−2, respectively. The smaller the weight loss value, the higher the sealing quality. The samples 4, 5, 6, 9, 11 and 16 also possess the satisfactory staining level of 0 or 1 (Fig. 2a), thus indicating that weight loss test results are in great consistence with that of the antistaining adsorption test. In this study, the influence of various hole sealing conditions is also systematically investigated through the weight lost test, including the concentrations of the salt mixture, complexant and surfactant, and pH and temperature, as shown in Fig. 3. The variance analysis of the weight loss index is also done (see Table 2).
| Sample code | Conc. of the salt mixture (g L−1) | Conc. of the complexing agent (g L−1) | Conc. of the surfactant (g L−1) | pH | T (°C) |
|---|---|---|---|---|---|
| 1 | 2.5 | 10 | 0.25 | 5.0 | 70 |
| 2 | 2.5 | 13 | 0.5 | 6.0 | 75 |
| 3 | 2.5 | 16 | 0.75 | 7.0 | 80 |
| 4 | 2.5 | 19 | 1 | 8.0 | 85 |
| 5 | 5 | 10 | 0.5 | 7.0 | 85 |
| 6 | 5 | 13 | 0.25 | 8.0 | 80 |
| 7 | 5 | 16 | 1 | 5.0 | 75 |
| 8 | 5 | 19 | 0.75 | 6.0 | 70 |
| 9 | 7.5 | 10 | 0.75 | 8.0 | 75 |
| 10 | 7.5 | 13 | 1 | 7.0 | 70 |
| 11 | 7.5 | 16 | 0.25 | 6.0 | 85 |
| 12 | 7.5 | 19 | 0.5 | 5.0 | 80 |
| 13 | 10 | 10 | 1 | 6.0 | 80 |
| 14 | 10 | 13 | 0.75 | 5.0 | 85 |
| 15 | 10 | 16 | 0.5 | 8.0 | 70 |
| 16 | 10 | 19 | 0.25 | 7.0 | 75 |
| Factor | Square of deviance | Degree of freedom | F ratio | F0.05 critical value | F0.10 critical value |
|---|---|---|---|---|---|
| Mixed salt | 5497.085 | 3 | 0.176 | 9.280 | 5.390 |
| Complexing agent | 1588.895 | 3 | 0.051 | 9.280 | 5.390 |
| Surfactant | 2620.265 | 3 | 0.084 | 9.280 | 5.390 |
| pH | 12![[thin space (1/6-em)]](https://www.rsc.org/images/entities/char_2009.gif) 859.470 859.470 |
3 | 0.412 | 9.280 | 5.390 |
| Temperature | 31![[thin space (1/6-em)]](https://www.rsc.org/images/entities/char_2009.gif) 238.265 238.265 |
3 | 1.000 | 9.280 | 5.390 |
| Error | 53![[thin space (1/6-em)]](https://www.rsc.org/images/entities/char_2009.gif) 803.98 803.98 |
15 | — | — | — |
From Fig. 3, it can be noted that the weight loss is initially increased and then decreased with raising the contents of the mixed salts; the lowest weight loss value is found at the 10 g L−1 content. The weight loss value is lowered first and becomes increased with the increase of the complexant content; the minimum value of the weight loss can be noted at 16 g L−1. For the impact of the surfactant, the weight loss mean value is initially lowered and consequently raised as the content of the surfactant increases, with the lowest weight loss value at 0.5 g L−1. Concerning pH influence, the weight loss value is decreased first and become raised as the pH rises, with the smallest weight loss value found at pH 7. The temperature linearly affects the weight loss values; the higher the temperature, the smaller the weight loss value. The minimum value of the weight loss is achieved at 85 °C. The optimized formulation and technological conditions are given as follows: 10 g L−1 mixed salts (Ca(CH3COO)2·H2O, C4H6O4Mg·4H2O), 16 g L−1 complexant (C6H15NO3), 0.5 g L−1 surfactant (C24H32O7S2Na2), 2 g L−1 pH buffer (CH3COONH4), and at pH 7 and 85 °C. The variance analysis, as shown Table 2, reveals that the order of significance of experimental conditions on the basis of weight loss test of the sealed samples is given as follows: temperature > pH > conc. of mixed salts > conc. of surfactant > conc. of complexant.
Electrochemical analysis
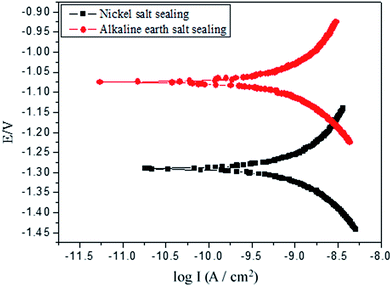
Potentiodynamic scanning and electrochemical impedance spectroscopy (EIS) measurements were performed on the sealed samples for carrying out the electrochemical analysis. The sealing of the AAO-based samples was conducted in the optimized liquids of the nickel-free alkaline earth metal salt and conventional nickel salt (as a control).| Hole sealing mode | Electrochemical parameters | |||
|---|---|---|---|---|
| Ecorr (V) | Icorr (A cm−2) | Bc (mV) | Ba (mV) | |
| Sealed by nickel salt | −1.2098 | 2.6171 × 10⁻⁹ | 369.94 | 567.33 |
| Sealed by alkaline earth salt | −1.0720 | 1.9788 × 10⁻⁹ | 345.76 | 507.65 |
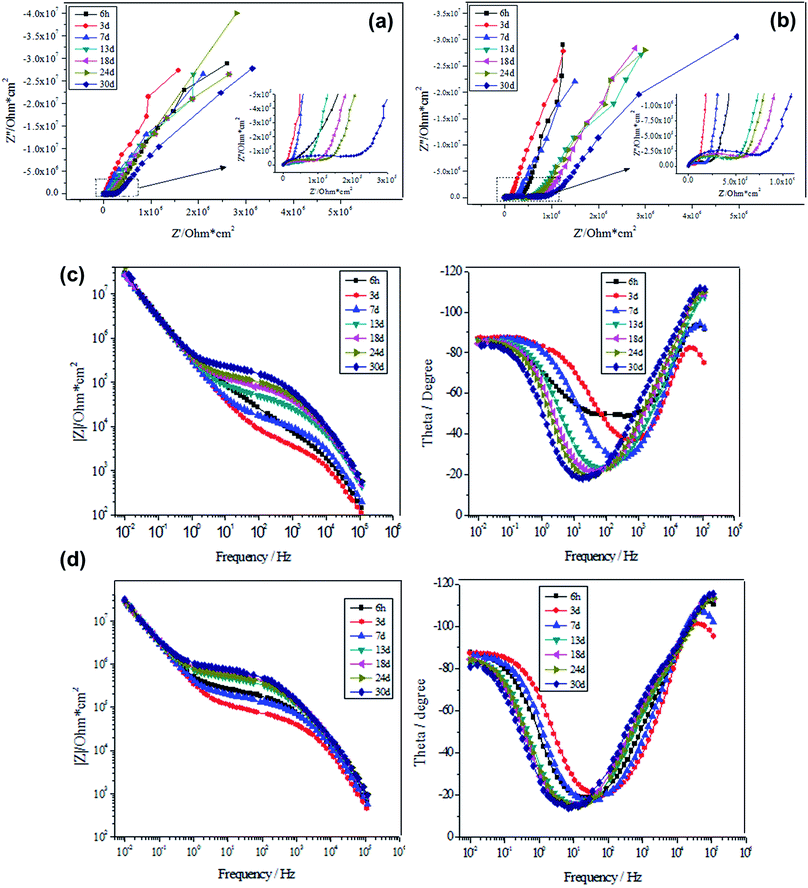
From Fig. 5(a and b), it is clear that the EIS spectra of the sealed samples are primarily composed of high-frequency and low-frequency capacitive loops. The part in the intermediate to high frequency range can reflect the main properties of the porous layer the AAO film, while the part at low frequencies can be a reflection of the main properties of the barrier layer. Based on the equivalent circuit shown in Fig. S2 of the ESI,† the Nyquist plots presented in Fig. 5(a and b) are fitted, where R1, CPE1, R2, CPE2 and CPE3 are the electric resistance of the electrolyte, capacitance and resistance of the pore wall of the porous layer, resistance of the barrier layer, and capacitance of the pore wall of the porous layer, respectively. Note that the resistance of the barrier layer was not considered in the present EIS test, which is due to the extreme big value of the fitted resistance, which can reach as high as 1021 and hence suggests the insulating state of the barrier layer. As a result, the CPE2 and CPE3 play the main role in circuit connection. From Fig. 5a, it can be noted that the capacitive loops at high frequencies are gradually expanded over time, while those at low frequencies are almost unchanged. Such a tendency can be more clearly noticed through the frequency-|Z| patterns shown in Fig. 5c. These results reveal that the porous layer of the AAO film reacts with the NaCl solution, but there is no reaction at the barrier layer. On the other hand, the capacitive loops are expanded as well at high frequencies over time as for the samples sealed by alkaline earth metal salt, together with the almost unchanged capacitive loops at low frequencies. The frequency-|Z| patterns given in Fig. 5d further clarify such a tendency. These results are a good indication of the reaction between the porous layer of the AAO film and the NaCl solution. Nevertheless, corrosion does not take place because the part at low frequencies is basically unchanged; the barrier layer does not contact with the NaCl solution. To conclude, within the socking time, the NaCl solution only interacts with the sealed porous layer, but does not etch off it, thus suggesting that it actually does not contact with the barrier layer.
Tables 4 and 5 present the electrochemical parameters related to the equivalent circuit. CPE-T and CPE-P represent capacitance and similarity level (a dimensionless constant) against CPE. It can be found that CPE1-T and CPE3-T are varied to a small extent, while the values of the CPE1-P and CPE3-P increase constantly, indicating the growing divergence from the “pure capacitance”. The resistance R2 of the porous layer is a critical index to reflect the sealing quality of the porous layer. Generally, the higher the resistance of the inner pores of the porous layer, the lower the conductivity of the porous layer; this is corresponding to the better sealing effect. The resistance of the porous layer is lowered with socking time (Table 4). Importantly, in each time period, the measured resistance R2 as for alkaline earth metal salt-sealed sample is higher than that for nickel salt-sealed one, indicating the superior corrosion resistance of the former; this is in good agreement with the potentiodynamic scanning result.
| Soaking time | Samples sealed by alkaline earth salt | Samples sealed by nickel salt | ||||
|---|---|---|---|---|---|---|
| R2/(Ω·cm2) | CPE1-T/(F) | CPE1-P | R2/(Ω·cm2) | CPE1-T/(F) | CPE1-P | |
| 6 h | 824![[thin space (1/6-em)]](https://www.rsc.org/images/entities/char_2009.gif) 830 830 |
6.44 × 10⁻⁸ | 0.38743 | 275![[thin space (1/6-em)]](https://www.rsc.org/images/entities/char_2009.gif) 000 000 |
1.73 × 10⁻⁶ | 0.29500 |
| 3 d | 633![[thin space (1/6-em)]](https://www.rsc.org/images/entities/char_2009.gif) 780 780 |
5.74 × 10⁻⁷ | 0.39763 | 275![[thin space (1/6-em)]](https://www.rsc.org/images/entities/char_2009.gif) 000 000 |
2.29 × 10⁻⁶ | 0.28541 |
| 7 d | 590![[thin space (1/6-em)]](https://www.rsc.org/images/entities/char_2009.gif) 520 520 |
1.38 × 10⁻⁷ | 0.49829 | 252![[thin space (1/6-em)]](https://www.rsc.org/images/entities/char_2009.gif) 000 000 |
2.53 × 10⁻⁶ | 0.31872 |
| 13 d | 535![[thin space (1/6-em)]](https://www.rsc.org/images/entities/char_2009.gif) 900 900 |
2.19 × 10⁻⁸ | 0.66393 | 160![[thin space (1/6-em)]](https://www.rsc.org/images/entities/char_2009.gif) 000 000 |
4.53 × 10⁻⁷ | 0.47940 |
| 18 d | 289![[thin space (1/6-em)]](https://www.rsc.org/images/entities/char_2009.gif) 000 000 |
1.60 × 10⁻⁸ | 0.68831 | 130![[thin space (1/6-em)]](https://www.rsc.org/images/entities/char_2009.gif) 000 000 |
2.08 × 10⁻⁷ | 0.52639 |
| 24 d | 221![[thin space (1/6-em)]](https://www.rsc.org/images/entities/char_2009.gif) 550 550 |
1.52 × 10⁻⁸ | 0.69906 | 84![[thin space (1/6-em)]](https://www.rsc.org/images/entities/char_2009.gif) 417 417 |
1.30 × 10⁻⁷ | 0.55648 |
| 30 d | 190![[thin space (1/6-em)]](https://www.rsc.org/images/entities/char_2009.gif) 730 730 |
1.08 × 10⁻⁸ | 0.72716 | 46![[thin space (1/6-em)]](https://www.rsc.org/images/entities/char_2009.gif) 253 253 |
5.92 × 10⁻⁷ | 0.61983 |
| Soaking time | Samples sealed by alkaline earth salt | Samples sealed by nickel salt | ||||||
|---|---|---|---|---|---|---|---|---|
| CPE2-T/(F−1) | CPE2-P | CPE3-T/(F) | CPE3-P | CPE2-T/(F) | CPE2-P | CPE3-T/(F) | CPE3-P | |
| 6 h | 5.80 × 10⁻⁷ | 0.93794 | 1.59 × 10⁻¹¹ | 1.160 | 5.91 × 10⁻⁷ | 0.95700 | 1.05 × 10⁻¹¹ | 1.132 |
| 3 d | 5.25 × 10⁻⁷ | 0.96737 | 9.83 × 10⁻¹¹ | 1.251 | 5.49 × 10⁻⁷ | 0.97500 | 1.44 × 10⁻¹¹ | 1.163 |
| 7 d | 5.13 × 10⁻⁷ | 0.95009 | 3.28 × 10⁻¹¹ | 1.312 | 5.55 × 10⁻⁷ | 0.96701 | 3.90 × 10⁻¹¹ | 1.207 |
| 13 d | 4.68 × 10⁻⁷ | 0.91545 | 7.36 × 10⁻¹² | 1.388 | 5.36 × 10⁻⁷ | 0.94882 | 4.97 × 10⁻¹¹ | 1.300 |
| 18 d | 4.58 × 10⁻⁷ | 0.91438 | 6.59 × 10⁻¹² | 1.394 | 5.29 × 10⁻⁷ | 0.94400 | 3.41 × 10⁻¹¹ | 1.321 |
| 24 d | 4.68 × 10⁻⁷ | 0.91549 | 5.47 × 10⁻¹² | 1.400 | 5.16 × 10⁻⁷ | 0.96600 | 3.02 × 10⁻¹¹ | 1.316 |
| 30 d | 4.43 × 10⁻⁷ | 0.90303 | 4.13 × 10⁻¹² | 1.424 | 5.03 × 10⁻⁷ | 0.95300 | 1.90 × 10⁻¹¹ | 1.352 |
Microscopic morphology analysis
Fig. 6a–c shows the surface morphologies of the unsealed AAO sample, and the samples sealed by the nickel salt and alkaline earth metal salt, respectively. Fig. 6d presents the local cross-section morphology of the alkaline earth metal salt-sealed sample. For the unsealed sample (Fig. 6a and the selectively magnified image as the inset), the honeycomb-like porous structure can be observed. The rounded and complete pores, with the size of 10–20 nm, are uniformly distributed over the AAO film surface, without discernible broken or connected holes. A large quantity of micropores still exists on the surface of the sample as sealed by the nickel salt (Fig. 6b), with a portion of pores on the surface of AAO film, which is in the sealing state. This is particularly unambiguous from the inset of Fig. 6b. Such a hole sealing can be a result of interactions between the nickel salt and Al2O3 or of the deposition and accumulation of the hydroxides into the micropores of the AAO film, leading to the filling of the local pore channels. Impressively, it can be noted in Fig. 6c that more micropores on the AAO film are in the sealing state as for the sample sealed by the alkaline metal salt as compared to that sealed by nickel salt shown in Fig. 6b. It is especially clear from the inset of Fig. 6c that much less honeycomb-like pores can be observed. This is most likely due to the generation of hydroxide deposits in the micropores of the AAO film. Upon interactions with complexant and surfactant, hydroxides are formed from Ca2+ and Mg2+ ions in the sealing solution of the alkaline earth metal salt. The red arrows shown in Fig. 6d indicate the nanoparticles with the size of approximately 10 nm for achieving the hole sealing. Some nanoparticles are deposited in the interior of the pore channels, with some other still not involved in the filling of the pore channels of the AAO film.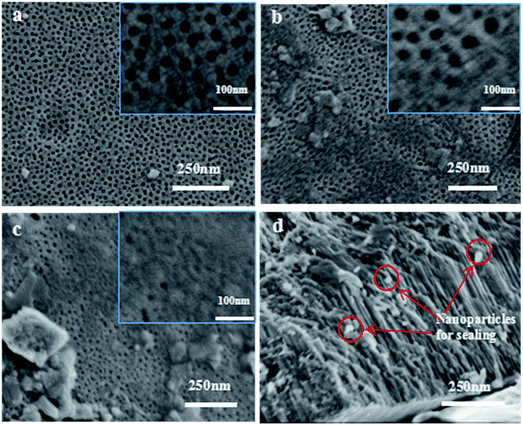 | ||
| Fig. 6 SEM images of the samples before and after hole sealing ((a) unsealed sample; (b) sealed by nickel salt; (c, d) sealed by alkaline earth metal salt). | ||
Phase composition analysis
The Al substrate composition can be confirmed by sharp characteristic XRD diffraction bands at approximately 38 and 65° (Fig. S3 in the ESI†). After anodic oxidation processing, a new weak and broad band emerges in the region between 20 and 30°, which can be well corresponding to the amorphous AAO film although the sharp Al-related band shelters the weak amorphous band of the Al2O3 film.9 We then further turn to FTIR and EDX spectra to confirm the elemental existence and chemical composition of the deposits in the pore channels of the AAO film, as presented in Fig. 7a and b, respectively. FTIR spectra clearly show the absorptions indexed to the AAO film,10 and to the sealing compositions, Ca(OH)2 and Mg(OH)2.11 EDX spectra of the sealed film further prove the existence of the elements of Ca and Mg, in consistence with the FTIR spectra.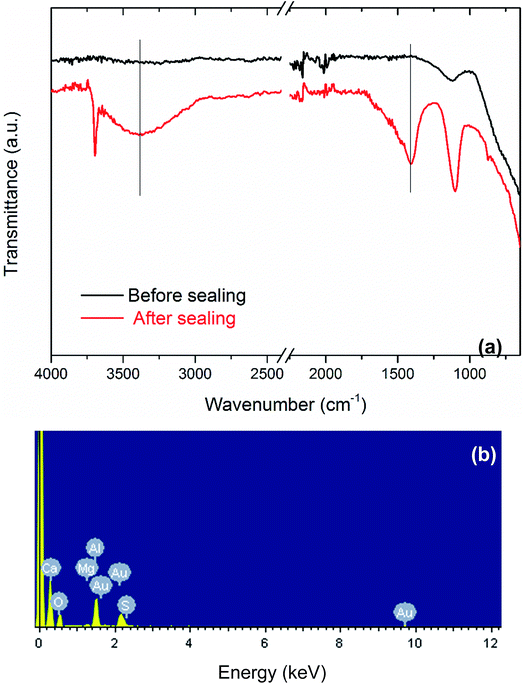 | ||
| Fig. 7 (a) FTIR spectra of the AAO samples before and after sealing by alkaline earth metal salt. (b) EDX spectrum of the sample sealed by alkaline earth metal salt. | ||
Impact of various conditions on the potential–time (E–t) curve for investigation of the hole sealing mechanism
The variation tendency of the potential–time (E–t) curves was employed to evaluate the hole sealing process rate. The gradual decrease of the potential on the E–t curves can be an indication of an approximate steady sealing process. This study monitors and compares the speed for reaching a steady state through the E–t curves under the condition of various sealing temperatures and pH, as well as the solution compositions including surfactant, complexant and pH buffer. Consequently, the completion of the hole sealing process can be estimated. Meanwhile, the sealing speed can also be evaluated, facilitating a study of the kinetics of the sealing process. Within the measure time, some of the E–t curves do not reach steady, but the speed for reaching steady can be determined on the basis of the potential variation rate.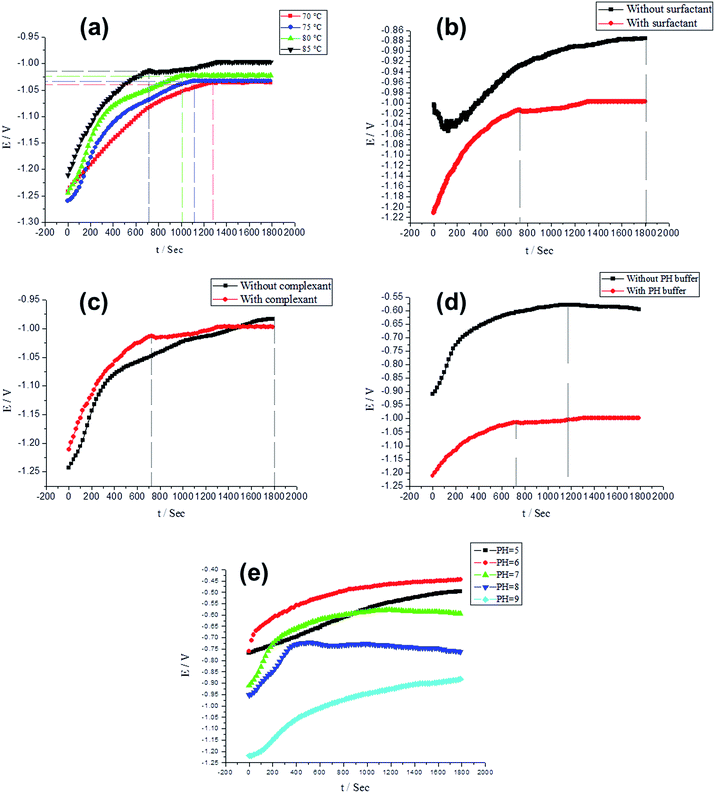 | ||
| Fig. 8 Investigation of various sealing conditions on E–t curves, including sealing temperature (a), surfactant (b), complexant (c), buffer solution (d) and pH (e) conditions. | ||
As shown in Fig. 8a, the potentials of the sealing processes at 70, 75, 80 and 85 °C come to a steady state near 1300, 1120, 1000, and 720 s. The higher the sealing temperature, the shorter the time to reach a stable potential during the sealing process. This can be due to the temperature-induced enhancement of the transfer and diffusion of various ions including Ca2+, Mg2+, and CH3COO−, etc. This reveals that increasing the temperature can drive more ions and compound molecules into the pores of the AAO film. On the other hand, the water ionization is an endothermic process, which indicates that the higher temperature facilitates the ionization of H2O and hence generates more H+. The combination of a quantity of H+ ions with the atom N of the N(CH2CH2OH)3 molecules, which possesses the un-bonded electron pairs, leaving rich OH− ions in the interior of the pores. In addition, the hydrolysis of the CH3COO− is also endothermic, suggesting that the higher temperatures facilitate the CH3COO− hydrolysis and hence increase the concentration of OH− ions. Therefore, the higher the temperature, the higher the concentration of OH− ions, along with the higher probability of the combination with Ca2+ and Mg2+ ions to form deposits. The higher rate of sealing the AAO film can hence be obtained. It can also be found that the potential for the hole sealing comes to a stabilization state in the first place at higher temperatures (Fig. 8a).
The potential of the sample sealed in the presence of the surfactant fluctuates greatly over the time period of 0–600 s, followed by a stabilization state at 1800 s (but still with a rising tendency). In contrast, the potential of the sample sealed in the presence of the surfactant becomes stable around 720 s. This indicates that the addition of the surfactant can enable the sealing process to be more quickly stabilized, facilitating the sealing of the AAO film. The surfactant C24H32O7S2Na2 possesses the excellent resistance to hard water and can form chelate compounds with Ca2+ and Mg2+, reducing the probability of forming the deposits as a result of the reaction between Ca2+ and Mg2+ metal ions and OH− ions in the solution. This can thereby soften the water. On the other hand, there are two negative charges on the C24H32O7S2Na2 molecules, which improve its solubility in the electrolyte solutions. Such a strong dispersion power of C24H32O7S2Na2 molecules can render Ca2+ and Mg2+ ions dispersive, reducing their aggregations on the surface of the AAO film and hence avoiding the generation of the deposits on the AAO surface resulting from the Ca2+ and Mg2+ ions. The AAO surface can thus be refrained from dusting. By contrast, the OH− ions, as accumulated in the solution without the surfactant, progressively react with Ca2+ and Mg2+ ions. The deposits can be formed both in the bulk solution and on the surface of the AAO film in the fashion of accumulation. It can also be noted in Fig. 8b that it is rather difficult for stabilizing the potential.
For the sealing solution with the surfactant C24H32O7S2Na2, a stable E–t curve can be obtained in a faster way, along with an effective sealing of the AAO film. The vast majority of such surfactant molecules, with the molecular weight of 542, dissociates in the bulk solution and on the external surface of the AAO film. Only a trace amount of the surfactant molecules can enter the 10–20 nm-sized micropores of the AAO film. Assuming the spherical model of the surfactant C24H32O7S2Na2 molecules, the diameter of the spheres can be calculated according to eqn (1):
 | (1) |
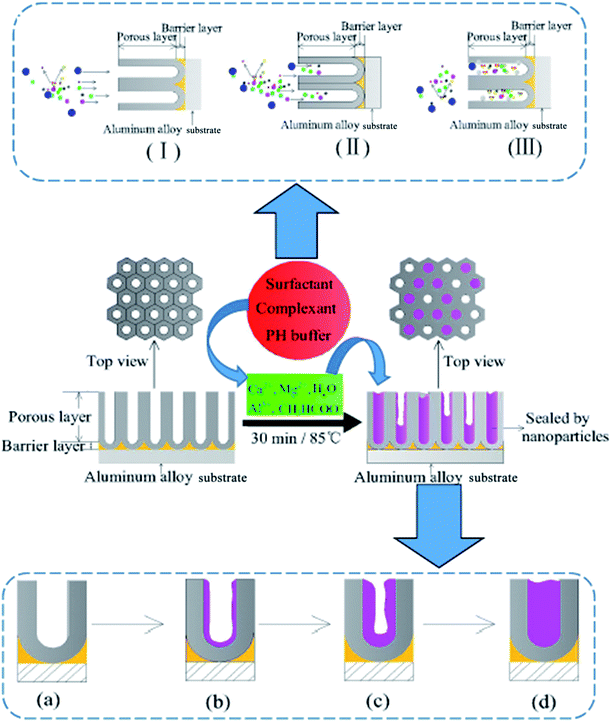
Based on the calculation, the diameter of the spherical model of the C24H32O7S2Na2 molecules can reach approximately 11.40 Å. In the bulk solution, the molecular diameters of H2O, N(CH2CH2OH)3, CH3COO−, OH−, and NH4+, Ca2+, and Mg2+ are estimated as 3.85, 7.49, 5.66, 2.37, 1.43, 1.00 and 0.89 Å, respectively. Actually, a long-chain model can be assigned to the C24H32O7S2Na2 molecules, and their molecular diameter is thus greater than 11.40 Å, especially considering their hydration state in the aqueous solution. Consequently, the highest number of the C24H32O7S2Na2 molecules, capable of simultaneously entering the micropores of the AAO film, can be estimated to be as high as 6–13, provided that the velocity of migration of the molecules into the AAO film is the same as that of the ions in the solution. The completely homogenous dispersion of C24H32O7S2Na2 molecules (0.5 g L−1) indicates that migration of each 10 nm into the 20 nm-sized pores of the AAO film corresponds to the number of the C24H32O7S2Na2 molecules of 3.4 or less (most of them forms chelate compounds with Ca2+ and Mg2+). When the AAO film is just immersed into the solution, the molecules in the bulk solution diffuses into the micropores of the AAO film. Due to a higher molecular weight of C24H32O7S2Na2, the diffusion is slow, revealing that the other smaller molecules can initially diffuse into the pores. The concentration of the C24H32O7S2Na2 molecules strikes a balance between inside and outside of the pores of the AAO film, resulting in the cease of the diffusion. After chelated with C24H32O7S2Na2 molecules in a trace amount, the Ca2+ and Mg2+ cannot affect their combination with OH− ions. The process of diffusing the surfactant molecules and various ions and molecules is illustrated by steps (I), (II) and (III) (see Scheme 1), where the C24H32O7S2Na2 molecules are corresponding to the blue spheres, and the remaining molecules and ions are also indicated by using other colored spheres. The diffusion starts in the step (I); small molecules and ions arrives at the pores of the AAO film in the step (II); the solute concentration reaches a balanced state between inside and outside of the pores of the AAO film, and then the diffusion stops in the step (III).
Discussion of the mechanism underlying the alkaline earth metal salt-based hole sealing
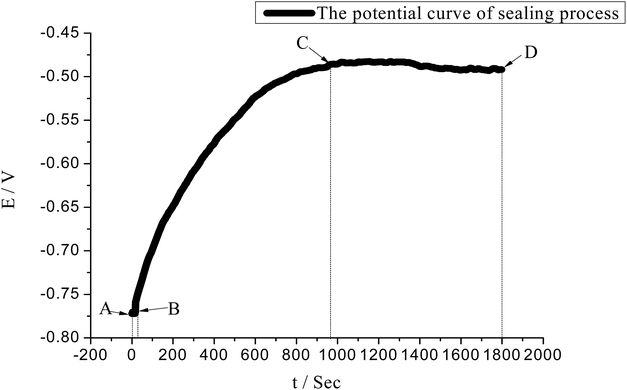
For hole sealing with the alkaline earth metal salt, the potential variation of the surface of the AAO film (with a 12 μm thickness) and sealing mechanism were explored, with the resultant E–t curve and schematic illustration of the sealing process presented in Fig. 9 and Scheme 1, respectively.It can be noted that the A–B region of the E–t curve is indexed to the migration of the ions into the AAO film in the bulk solution. Over such a region, no deposits appear in the pores of the AAO film. The status of the pores of the AAO film is displayed in Scheme 1a. Owing to the conditions without involving external stirring, there exists no forced convection, revealing that such a process is controlled by the diffusion-related mass transfer. The concentration difference (or concentration gradient) between the inside and outside of the AAO film can be regarded as the impetus for the mass transfer. According to the diffusion kinetics, the existence of the convection at a certain strength is a requirement for realizing the stable diffusion. Consequently, the ion diffusion in such a process can be regarded as the unstable diffusion process. Assuming that the ion concentration is designated as c, the relationship between the distance (from outside to inside of the pores of the AAO film) and diffuse time satisfy the Fick's second law as described by using eqn (2).
 | (2) |
Over the B–C region, the E–t curve rises constantly, corresponding to the period of accumulating the nano-deposits in the micropores of the AAO film. In the presence of a trace amount of C24H32O7S2Na2, it is insufficient for chelating the Ca2+ and Mg2+ at a high concentration, facilitating the interactions between these alkaline metal ions and OH− at a certain concentration and hence forming deposit particles that can fill the film pores. The reactions involved in the sealing process are proposed as eqn (3)–(12).
 | (3) |
 | (4) |
| CH3COO− + H2O = CH3COOH + OH− | (5) |
| (CH2CH2OH)3N + H2O = H(CH2CH2OH)3N+ + OH− | (6) |
| 3(CH2CH2OH)3N + Al3+ = Al(CH2CH2O)3N + 3H+ | (7) |
| 6CH3COO− + Al3+ = Al(CH3COO)63− | (8) |
| 2Al(OH)3 + Al(CH3COO)63− = Al3(OH)3(CH3COO)6 + 3OH− | (9) |
| NH4+ + OH− = NH3·H2O | (10) |
| Ca2+ + 2OH− = Ca(OH)2↓ | (11) |
| Mg2+ + 2OH− = Mg(OH)2↓ | (12) |
In such a process, the chelating reactions as illustrated in eqn (3) and (4) mainly occurs in the bulk solution, which is the reasons for observing the phenomenon that the turbid solution cannot be seen when a certain concentration of OH− ions exists in the bulk solution. The eqn (5) and (6) can basically elucidate the increase of the OH− concentration. When the concentration of the OH− ions in the pores of the AAO film arrives at a certain point, the deposits can be formed from the reactions between the OH− ions and Ca2+ and Mg2+ ions. The deposits accumulate on the inner wall of the pores of AAO film. The eqn (7) reflects the shielding effect of triethanolamine on the Al3+ ions, weakening their impact on the Ca2+ and Mg2+-based deposits. The interactions between Al3+ and CH3COO− can be displayed by eqn (8) and (9). The NH4+ ions given in eqn (8) stems from the pH buffer and has a buffering function to the rise of the concentration of OH− ions in the both the bulk solution and pores of the AAO films. This can thus mitigate the pH ascending velocity, but cannot inhibit the pH increase, helping to improve the quality of the deposits precipitated in the pores of the AAO film. The growth of the deposits in the pores of the AAO films is illustrated in Scheme 1(a–d), where the purple portion of the cross-section corresponds to the deposits. With consuming the Ca2+ and Mg2+ ions in the pores of the AAO film, a concentration difference is gradually generated between the solution concentration and bulk solution of the pores of the AAO film, facilitating the continuous diffusion of the bulk solution into the film pores. The precipitation takes place along with the diffusion, until the concentration of the C24H32O7S2Na2 molecules reach a point that can adequately chelate Ca2+ and Mg2+ ions in the film pores. At such a point, the formation of the deposits stop; in the meanwhile, the reaction also ceases. The ceasing point on the E–t curve is corresponding to the point C, together with the potential in a steady state. The C–D region of the E–t curve keeps stable, with a complete sealing sate and a basically constant electrical resistance of the AAO layer. The distribution of the deposits in the film pores in the C–D region can be partly in the state as illustrated in Scheme 1(d), while the other part being in the state as depicted in Scheme 1(c). This can be well evidenced by the SEM observation as shown in Fig. 6c. In the state illustrated in Scheme 1(d), the film pores are completely filled by the deposits, indicating that the film pores can be fully filled before the C24H32O7S2Na2 reaches a certain concentration in the film pores. For the state indexed to the film pores being not fully filled (Scheme 1(c)), the concentration of the C24H32O7S2Na2 reaches a point to sufficiently chelate Ca2+ and Mg2+ ions but not to generate the deposits. In the steady potential state, the ions in the bulk solution continues to diffuse into the film pores in an incomplete sealing state, until the solute concentration reaches a balanced status between the inside and outside of the pores (with the concentration gradient reduced to 0).
Experimental
Materials and anodic oxidation processing
The starting aluminum alloy adopted was a 6063-type plate (100 × 50 × 2 mm3). The commonly-used sulfuric acid-based anodic oxidation system was used to anodically oxidize the aluminum alloy substrate based on the following anodic oxidation conditions:Oxidation temperature: 20–25 °C;
Current density: 1.2 A dm−2;
And oxidation time: 30 min.
The thickness of the oxidation layer was controlled to be 12–15 μm. The nickel-free sealing processing was subsequently explored on the AAO film. The main steps for realizing this anodic oxidation and hole sealing are schematically illustrated in Fig. S1 of the ESI.† The compositions of the alkaline liquid used for washing the starting aluminum alloy plate were NaOH (5 g L−1), NaSiO3 (10–20 g L−1), Na3PO4 (10 g L−1), Na2CO3 (10–20 g L−1), and OP-10 (1 g L−1), while acidic washing liquid was comprised of H2SO4 (10%) and HNO3 (4%). The electrolyte used for electrochemical oxidation was a H2SO4 solution (186 g L−1). The rinsing was based on deionized (DI) water. The hole sealing treatment was conducted in a liquid bath mainly consisting of 2.5–10 g L−1 alkaline earth metal salt mixture (Ca(CH3COO)2·H2O and C4H6O4Mg·4H2O), 10–19 g L−1 triethanolamine (C6H15NO3), 0.25–1.0 g L−1 sodium dodecyl diphenyl ether disulfonate (C24H32O7S2Na2), and 2 g L−1 ammonium acetate (CH3COONH4). The solution adopted for electrochemical measurements was 3.5% NaCl.
Optimization of the experimental parameters
L16(45) orthogonal design was employed for obtaining the optimal hole sealing conditions, as shown in Table 1. Mixed alkaline earth metal salts in the hole sealing liquid was used at the ratio of the calcium salt to magnesium salt of 1![[thin space (1/6-em)]](https://www.rsc.org/images/entities/char_2009.gif) :
:![[thin space (1/6-em)]](https://www.rsc.org/images/entities/char_2009.gif) 4 (w/w). Auxiliary additives (see Table 1) were also adopted for optimization of the hole sealing, including complexant, surfactant, and pH buffer (at a constant concentration of 2 g L−1). The sealing rate and time were set to 0.5 μm min−1 and 24–30 min, respectively. The sealing processing was performed on the anodically oxidized samples 1–16.
4 (w/w). Auxiliary additives (see Table 1) were also adopted for optimization of the hole sealing, including complexant, surfactant, and pH buffer (at a constant concentration of 2 g L−1). The sealing rate and time were set to 0.5 μm min−1 and 24–30 min, respectively. The sealing processing was performed on the anodically oxidized samples 1–16.
Evaluation of the sealing quality
Antistaining adsorption and weight loss tests were employed for evaluating the sealing quality. For the antistaining adsorption test, the prepared samples 1–16 were degreased, processed with acids, and stained with a blue colorant (with the international color no. of 69). The staining effect, i.e., the antistaining adsorption ability of the sealed AAO film, was evaluated based on the ISO2143:2010 standard. The ISO3210:2010 standard was used for conducting the weight loss test and hence for further evaluating the quality of the sealed AAO-based samples.Characterizations
The EOECD-30A-type power source was adopted for anodization coloring of 6063 aluminum alloy samples. During the anodic oxidation, a conversion-type refrigerated freezer (BC/BD-143), an electric-heated thermostatic water bath, and a non-contact infrared thermometer (AR842A+) were employed for strictly controlling the temperature. The electrochemical measurements were performed on an electrochemical workstation (CS-310) based on a three-electrode system, where the saturated calomel electrode (SCE) and platinum electrode worked as the reference and counter electrodes, respectively. The scanning range of the potentiodynamic polarization curve was set as −1.0 to +0.5 V, with the scanning rate and sampling interval as 1 mV s−1 and 1 s, respectively. The range of the alternating current (AC) impedance test rate was set as 10−2–105 Hz, with the alternating current amplitude of the sinusoidal wave as 10 mV. The wide-band responses at the frequencies >10 and <10 were 470 pF and 2.2 nF, respectively. The parameters including filter and earthing mode were set to 470 nF and field, respectively. The microscopic morphologies of the prepared samples were observed on an S-480 Field emission scanning electron microscope (SEM, HITACHI). Fourier Transform Infrared Spectroscopy (FTIR) spectra were captured on an IRAffinity-1S spectrophotometer (Shimadzu).Conclusions
The following conclusions can be drawn from this systematic study.(1) Upon optimization of the hole sealing formulation based on the alkaline earth metal salt, the optimal experimental parameters are obtained: (i) the concentrations of the salt mixture, complexant, surfactant, and buffer are suggested to be 10, 16, 0.5, and 2 g L−1, respectively; (ii) pH, temperature and sealing time are suggested to be 7, 85 °C, and 24–30 min, respectively. Under given conditions, the order of the impact of various experimental conditions on the weight loss of the sealed samples is given as follows: temperature > pH > salt mixture > surfactant > complexant.
(2) The electrochemical measurement of the self-corrosion current density reveals a higher corrosion resistance of the alkaline earth metal salt-sealed sample as compared to the conventional nickel salt-sealed sample. Over all the EIS test regions, the electrical resistance of the porous layer of the alkaline earth metal salt-sealed sample is higher than that of the nickel salt-sealed sample.
(3) Through tracking the E–t curve during hole sealing, it has been noted that raising the temperature can more quickly stabilize the potential over the temperature range of 70–85 °C. The higher pH value over the pH range of 5–7 make the potential more easily stabilized, while the potential cannot be stabilized at pHs larger than 7; the addition of surfactant, complexant, or buffer can help to quickly stabilize the potential, whereas the potential cannot be stabilized if without the addition of surfactant or complexant.
(4) This study has also discussed the mechanism underlying the effective hole sealing, with schematic illustration presented in Scheme 1.
Conflicts of interest
There are no conflicts to declare.Acknowledgements
We greatly acknowledge the National Natural Science Foundation of China (No. 21671038), Special Funding Projects of the Technical Innovation of Foshan City (No. 2014AG10009, No. 2016AG100341), and Engineering Project for Innovation and for Enhancing Universities in Guangdong Province (No. 2016GCZX008).Notes and references
- (a) J. Lee, D. Kim, C.-H. Choi and W. Chung, Nano Energy, 2017, 31, 504–513 CrossRef; (b) M. C. Lafouresse, M.-L. de Bonfils-Lahovary, C. Charvillat, L. Oger, L. Laffont and C. Blanc, J. Alloys Compd., 2017, 722, 760–766 CrossRef; (c) T. Aerts, T. Dimogerontakis, I. De Graeve, J. Fransaer and H. Terryn, Surf. Coat. Technol., 2007, 201, 7310–7317 CrossRef; (d) A. Hakimizad, K. Raeissi and F. Ashrafizadeh, Surf. Coat. Technol., 2012, 206, 4628–4633 CrossRef; (e) V. Moutarlier, M. P. Gigandet, B. Normand and J. Pagetti, Corros. Sci., 2005, 47, 937–951 CrossRef; (f) C. A. Munson and G. M. Swain, Surf. Coat. Technol., 2017, 315, 150–162 CrossRef; (g) S. Mokhtari, F. Karimzadeh, M. H. Abbasi and K. Raeissi, Surf. Coat. Technol., 2017, 324, 99–105 CrossRef; (h) H. Wei, H. Hu, M. Chang, Y. Zhang, D. Chen and M. Wang, Ceram. Int., 2017, 43, 12472–12479 CrossRef; (i) Y. Zhang, H. Hu, M. Chang, H. Wei, D. Chen, M. Zhang, L. Wu and X. Li, J. Mater. Sci., 2018, 53, 2102–2114 CrossRef.
- (a) M. Raoufi and H. Schönherr, RSC Adv., 2013, 3, 13429 RSC; (b) F. Zhang, J. Evertsson, F. Bertram, L. Rullik, F. Carla, M. Långberg, E. Lundgren and J. Pan, Electrochim. Acta, 2017, 241, 299–308 CrossRef; (c) M. Saeedikhani, M. Javidi and S. Vafakhah, Trans. Nonferrous Met. Soc. China, 2017, 27, 711–721 CrossRef; (d) X. Zhu, J. Fan, Y. Zhang, H. Zhu, B. Dai, M. Yan and Y. Ren, J. Mater. Sci., 2017, 52, 12717–12723 CrossRef.
- (a) B. Jang, X.-Z. Chen, R. Siegfried, J. M. Montero Moreno, B. Özkale, K. Nielsch, B. J. Nelson and S. Pané, RSC Adv., 2015, 5, 94283–94289 RSC; (b) M. He, J. Yao, Z.-X. Low, D. Yu, Y. Feng and H. Wang, RSC Adv., 2014, 4, 7634 RSC; (c) J. Huo, H. Hu, M. Zhang, X. Hu, M. Chen, D. Chen, J. Liu, G. Xiao, Y. Wang and Z. Wen, RSC Adv., 2017, 7, 2281–2287 RSC; (d) S. M. H. Gardazi, T. A. Butt, N. Rashid, A. Pervez, Q. Mahmood, M. M. Shah and M. Bilal, Desalin. Water Treat., 2016, 57, 28981–28998 CrossRef; (e) Y. Huang, Y. Ma, H. Hu, P. Guo, L. Miao, Y. Yang and M. Zhang, RSC Adv., 2017, 7, 52091–52100 RSC.
- (a) M. Hao, S. Wu, H. Zhou, W. Ye, X. Wei, X. Wang, Z. Chen and S. Li, J. Mater. Sci., 2015, 51, 2420–2426 CrossRef; (b) R. Senbahavalli, S. Mohanapriya and V. Raj, Materials Discovery, 2016, 3, 29–37 CrossRef.
- Y. Wu, W. Zhao, W. Wang, L. Wang and Q. Xue, Sci. Rep., 2017, 7, 1344 CrossRef PubMed.
- (a) Y. Shang, Int. J. Electrochem. Sci., 2016, 5234–5244, DOI:10.20964/2016.06.85; (b) N. Hu, X. Dong, X. He, J. F. Browning and D. W. Schaefer, Corros. Sci., 2015, 97, 17–24 CrossRef; (c) S.-K. Hwang, S.-H. Jeong, O.-J. Lee and K.-H. Lee, Microelectron. Eng., 2005, 77, 2–7 CrossRef CAS; (d) M. Chang, H. Wei, D. Chen, H. Hu, Y. Zhang, X. Ye, K. Zeng and D. Li, Nano Research & Applications, 2017, 3, 1–8 Search PubMed; (e) F. Zhang, M. Yan, J. He and F. Yin, Ceram. Int., 2017, 43, 10832–10839 CrossRef CAS; (f) J. J. Roa, B. Gastón-García, E. García-Lecina and C. Müller, Ceram. Int., 2012, 38, 1627–1633 CrossRef CAS; (g) I. Mohammadi, A. Afshar and S. Ahmadi, Ceram. Int., 2016, 42, 12105–12114 CrossRef CAS; (h) M. N. Ibarra Castro, J. M. Almanza Robles, D. A. Cortés Hernandez, J. C. Escobedo Bocardo and J. Torres Torres, Ceram. Int., 2010, 36, 1205–1210 CrossRef CAS; (i) B.-D. Hahn, Y. Kim, C.-W. Ahn, J.-J. Choi, J. Ryu, J.-W. Kim, W.-H. Yoon, D.-S. Park, S.-Y. Yoon and B. Ma, Ceram. Int., 2016, 42, 18141–18147 CrossRef CAS.
- (a) C.-c. Jiang, Y.-k. Cao, G.-y. Xiao, R.-f. Zhu and Y.-p. Lu, RSC Adv., 2017, 7, 7531–7539 RSC; (b) X. Yu, C. Yan and C. Cao, Mater. Chem. Phys., 2002, 76, 228–235 CrossRef CAS.
- (a) B. Ramezanzadeh, H. Vakili and R. Amini, J. Ind. Eng. Chem., 2015, 30, 225–233 CrossRef CAS; (b) H.-Y. Su and C.-S. Lin, Corros. Sci., 2014, 83, 137–146 CrossRef CAS.
- (a) H. Hu, J. H. Xin and H. Hu, J. Mater. Chem. A, 2014, 2, 11319 RSC; (b) H. Hu, M. Chang, M. Zhang, X. Wang and D. Chen, J. Mater. Sci., 2017, 52, 8650–8664 CrossRef CAS; (c) H. Hu, M. Chang, X. Wang and D. Chen, J. Mater. Sci., 2017, 52, 9922–9930 CrossRef CAS; (d) H. Hu, J. H. Xin, H. Hu and X. Wang, Nano Res., 2015, 8, 3992–4006 CrossRef CAS; (e) H. Hu, C. C. K. Allan, J. Li, Y. Kong, X. Wang, J. H. Xin and H. Hu, Nano Res., 2014, 7, 418–433 CrossRef CAS.
- Y. Shi, B. Zhou, P. Wu, K. Wang and C. Cai, J. Electroanal. Chem., 2007, 611, 1–9 CrossRef CAS.
- (a) P. Ding and B. Qu, Mater. Lett., 2006, 60, 1233–1237 CrossRef CAS; (b) J. García-Martínez, A. Bueno-López, A. García-García and A. Linares-Solano, Fuel, 2002, 81, 305–313 CrossRef; (c) H. Hu, X. Wang, D. Miao, Y. Wang, C. Lai, Y. Guo, W. Wang, J. H. Xin and H. Hu, Chem. Commun., 2015, 51, 16699–16702 RSC.
Footnote |
| † Electronic supplementary information (ESI) available. See DOI: 10.1039/c7ra10633e |
| This journal is © The Royal Society of Chemistry 2017 |

