 Open Access Article
Meta-holograms based on evanescent waves for encryption
Xiaoyi Guo†
ab,
Xiaohu Zhang†ab,
Yinghui Guoa,
Mingbo Pua,
Xiaoliang Maa,
Xiong Lia and
Xiangang Luo *a
*a
aState Key Laboratory of Optical Technologies on Nano-Fabrication and Micro-Engineering, Institute of Optics and Electronics, Chinese Academy of Science, P.O. Box 350, Chengdu 610209, China. E-mail: lxg@ioe.ac.cn
bUniversity of Chinese Academy of Sciences, Beijing 100049, China
First published on 22nd November 2017
Abstract
Benefiting from low absorption, large viewing angle, easy fabrication and low cost, metasurfaces are widely used in holograms. Theoretical calculation indicates that the evanescent wave can carry object information with higher spatial frequency, but this capability is usually ignored in existing research. We demonstrate a composite structure, which consists of a grating, multilayer structure and metasurface, to gather the information coded in the evanescent wave region under evanescent wave illumination and successfully reconstructed the original image of 2D and 3D holograms. This scheme shows large capabilities in hologram encryption, dynamic vision, and information storage.
Introduction
Holography is a technique to reconstruct an object's 3D features by modulating the wave front of incoming light with certain structures. Traditional holography records the target object's information via the interference between the object light and a coherent reference light, while the reconstruction relies on the corresponding light illumination onto the hologram. This technique offers a promising tool to record the three-dimensional information of a real object. However, it is unable to record and reconstruct fictitious objects or structures. With the development of computer technology, the computer-generated hologram (CGH) has emerged, which makes it possible to carry out holography on any object, including fictitious objects and structures. The hologram obtained from the computer program is a type of phase or amplitude distribution; reconstructing the original image involves introducing the previously designed abrupt phase or amplitude jumps at the interface of the structure, so that the transmitted or reflected wave front is manipulated, and forms the designed image at a certain position in space. One of the common ways to manipulate the wave front is through spatial light modulators (SLMs), which are basically based on liquid crystals. Since the SLMs' pixels are usually much larger than the wavelength of visible light, the viewing angle of a hologram based on SLMs would be quite small; hence, the applications will be limited. For example, when the wavelength of the incident light is 657 nm, the viewing angle will be ∼52° with small pixels of 0.55 μm. However, for a SLM with a pixel size of 8 μm, the viewing angle will be only ∼5° at the same wavelength of incident light.1It has been proposed that novel functions can be realized with metamaterials because of their ability to efficiently and conveniently modulate the properties of electromagnetic waves. During the past years, many research studies based on metamaterials have been reported, such as negative refraction,2,3 polarization modulation,4,5 abnormal absorption, transmission and reflection.6–8 A metasurface acts as an ultra-thin metallic or dielectric wave front modulator, which can be regarded as the 2D version of metamaterials. This greatly simplifies the design and machining processes; moreover, it is much more suitable for the integration of the optical elements. Research studies based on metasurface also have been abundantly carried out, for example, multi-colour holography,9–13 metalens,14–17 perfect absorption,18 beam steering,19,20 terahertz cloaking,21 generation of optical angular momentum22 and nonlinear holography.23 The metasurface's characteristic of manipulating the wave front via an ultra-thin surface makes it more suitable for holography.24–31
Due to the metasurface's sub-wavelength scale, the evanescent wave has the ability to carry information contained in the higher spatial spectrum, which can be regarded as part of the total information of the metasurface. However, most of the existing studies based on meta-hologram did not capitalize on the ability of the evanescent wave to carry information, which is a waste of the information capacity. One way to make use of the evanescent wave is off-axis illumination.32,33 It is able to enlarge the available information capacity of the hologram with sub-wavelength structures, but not large enough to get more information from the deep evanescent wave region as the largest wave vector it is able to obtain is 2k0.
In this paper, we demonstrate a grating-multilayer-metasurface following the principle of light matter interaction in multi-layered metasurfaces.34 The structure successfully reconstructed the designed 2D image coded in the evanescent region as deep as 3k0. Moreover, the 3D hologram, adding the oblique phase, was also successfully reconstructed. Compared with off-axis illumination, our scheme is much easier to realize in the experiment because of the use of a normal incidence. Furthermore, it is theoretically possible to obtain the information hidden in the arbitrary deep evanescent region if a proper method is found to provide a higher order wave vector with sufficient intensity.
Unit cell structure
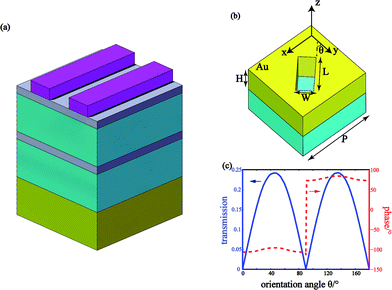
The integrated unit cell structure is shown in Fig. 1a. Silicon grating was adopted at the top of the structure followed by a silver-silicon dioxide multilayer; a golden metasurface was adopted at the bottom of the structure.As shown in Fig. 1b, we added a silicon dioxide substrate under the antenna unit cell in order to correspond with the complete unit cell structure shown in Fig. 1a. The transmission coefficients of the antenna calculated by CST MWS software are illustrated in Fig. 1c. The incident electric field is linearly polarized along the x axis, with a unit cell boundary condition in the x and y directions and an open boundary in the z direction. We can observe from Fig. 1c that the amplitude profile approximately follows a |sin![[thin space (1/6-em)]](https://www.rsc.org/images/entities/char_2009.gif) 2θ| dependence, while the phase profile remains constant when the antenna rotates except for a π phase jump at θ = 90°.
2θ| dependence, while the phase profile remains constant when the antenna rotates except for a π phase jump at θ = 90°.
The sketch map of the grating-multilayer structure is shown in Fig. 2a. The grating period is Λ = 316 nm and the width of a single bar is a = 158 nm (which indicates that the space ratio of the grating is 1![[thin space (1/6-em)]](https://www.rsc.org/images/entities/char_2009.gif) :
:![[thin space (1/6-em)]](https://www.rsc.org/images/entities/char_2009.gif) 1). The depth of the grating, h3, is set to be half the width of the single bar. The multilayer consists of two bilayer stacks. Each stack contains a silver layer and a silicon dioxide layer whose thicknesses are 10 nm and 50 nm, respectively. The function of the multilayer structure is filtrating out the undesired wave vector generated by the grating. Detailed analysis is provided in the theory and discussion section. Fig. 2b displays the transmission property of the grating-multilayer unit cell, calculated by CST MWS software. We can observe that a transmission of about 3% is obtained at the designated wavelength of 632.8 nm.
1). The depth of the grating, h3, is set to be half the width of the single bar. The multilayer consists of two bilayer stacks. Each stack contains a silver layer and a silicon dioxide layer whose thicknesses are 10 nm and 50 nm, respectively. The function of the multilayer structure is filtrating out the undesired wave vector generated by the grating. Detailed analysis is provided in the theory and discussion section. Fig. 2b displays the transmission property of the grating-multilayer unit cell, calculated by CST MWS software. We can observe that a transmission of about 3% is obtained at the designated wavelength of 632.8 nm.
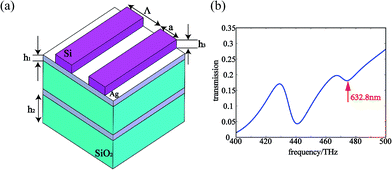 | ||
| Fig. 2 (a) The schematic diagram of the grating-multilayer unit cell. (b) The transmission curve of the grating-multilayer unit cell. | ||
To obtain the desired wave vector, we should undertake some analysis to discover the proper parameters of the structure. We know that the grating equation can be expressed as k = 2mπ/Λ + nk0![[thin space (1/6-em)]](https://www.rsc.org/images/entities/char_2009.gif) sin
sin![[thin space (1/6-em)]](https://www.rsc.org/images/entities/char_2009.gif) θ, where k0 is the wave vector of the incident light in the vacuum, m is an integer, representing the order of the generated wave vector, n is the refractive index of the incident media, θ is the incident angle and Λ is the grating period. If the light incident is normally projected onto the grating, which means θ = 0, the equation becomes k = 2mπ/Λ. Thus, the generated wave vector is independent of the wavelength of the incident light and the refractive index of the incident media and only decided by the grating period. If we set Λ = λ/2, the generated wave vector will be “even times” of the wave vector of the incident light according to the equation given above. Considering that the higher order wave vectors generated by the grating have extremely low intensity, we decided to select the ±1 order, which means ±2k0. As mentioned above, the wavelength of the incident light used in our design is 632.8 nm; thus, the grating period is set to be Λ = 316 nm.
θ, where k0 is the wave vector of the incident light in the vacuum, m is an integer, representing the order of the generated wave vector, n is the refractive index of the incident media, θ is the incident angle and Λ is the grating period. If the light incident is normally projected onto the grating, which means θ = 0, the equation becomes k = 2mπ/Λ. Thus, the generated wave vector is independent of the wavelength of the incident light and the refractive index of the incident media and only decided by the grating period. If we set Λ = λ/2, the generated wave vector will be “even times” of the wave vector of the incident light according to the equation given above. Considering that the higher order wave vectors generated by the grating have extremely low intensity, we decided to select the ±1 order, which means ±2k0. As mentioned above, the wavelength of the incident light used in our design is 632.8 nm; thus, the grating period is set to be Λ = 316 nm.
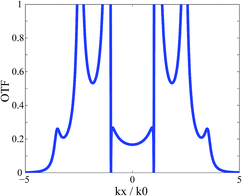
Since the grating generates a series of wave vectors, a specific structure is required under the grating in order to filter out the undesired wave vectors. Herein, we use a multilayer structure and the optical transfer function (OTF) curve of the multilayer structure is shown in Fig. 3. There are two reasons why we did not fully optimize the OTF curve. First, the multilayer structure consists of silver and silicon dioxide. Unit cell simulation indicates that if the total thickness of the silver film is larger than 30 nm, we would obtain extremely low transmission. Second, only even order vectors would be generated by the grating. The OTF curve (Fig. 3) provides an extra small value when k > 3k0, and the value of 2k0 is about 5-times larger than that of the zero order, so we consider that this structure is acceptable for our design. It is worth noting that the grating-multilayer structure is used to generate the higher order wave vector needed in the design; it is equivalent to a dielectric medium with a certain dielectric constant. The grating-multilayer structure is designed after considering the transmission and the selectivity. More layers lead to better selectivity but worse transmission, while less layers lead to better transmission but worse selectivity. The basic role of the structure is enhancing the specific wave vector via surface plasma (SP) coupling between the multilayers. Theoretically, any structure with the same effective dielectric constant can replace the grating-multilayer structure.
Holography simulation
Fig. 4 shows the total sketch map of the designed meta-hologram. The linearly polarized light is normally incident from the grating side, and the direction of the electric field should be vertical to the direction of the grating in order to generate the higher order wave vector as mentioned above. After passing through the multilayer structure, the undesired wave vectors are filtrated out and the hologram is illuminated by the selected wave vector; hence, the target image will be reconstructed at the designed position.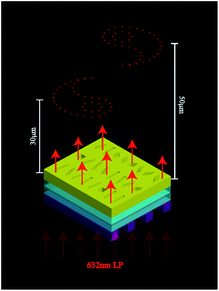 | ||
| Fig. 4 Sketch of the 3D version of the meta-hologram under 632 nm LP illumination and the image at the designed distance from the metasurface. | ||
In order to check whether the structure can gather the information coded in the evanescent wave region, we designed a 2D hologram. First, the original image, shown in the inset of Fig. 5d, is prepared. Then, we obtain the phase distribution of the image using the GS algorithm. Then, the original phase distribution is replaced by its real part; the following calculation is based on the real part of the original phase distribution. The amplitude and phase distribution of the new result are shown in Fig. 5c and d. The calculated phase and amplitude distribution agree well with the antenna's manipulating properties. The simulated results of the hologram with and without the grating-multilayer structure are shown in Fig. 5a and b, respectively. The regions in the white dashed circles are the propagating regions. The light field within these regions can be detected by CCD. Comparing Fig. 5a and b, it can be found that the existence of the grating-multilayer structure changes the result of the hologram. We obtain the hexagram without the multilayer-grating part, and a windmill with the multilayer-grating part. In fact, the reconstructed image is decided by the wave vector illuminating the metasurface. Therefore, if the parameters of the grating-multilayer are not in accordance with our design, the incident wave vector would not be 2k0, but it would be either larger or smaller. The detailed analysis is provided as follows. There are two major limitations of the reconstruction when the parameters of the structure are not well matched: the wave vector and the transmission. As we explained in our discussion of the unit cell structure, the wave vector generated by the grating is decided by the grating period. The windmill is coded in the 2k0 region; only when the incident wave vector in the y-direction is 2k0 can the windmills be moved to the middle of the propagating region and form an entire windmill, which can be detected by CCD. If the parameters of the grating are different from the design value, the incident wave vector would be changed and cannot pick out the windmill. Moreover, the multilayer would not allow all the wave vectors generated by the grating to pass through it. As illustrated in Fig. 3, wave vectors larger than 3k0 possess extremely low OTF, which indicates that they can hardly pass through the multilayer and illuminate the metasurface. In general, the wrong parameters lead to the wrong wave vectors. Most of the wrong wave vectors cannot pass through the multilayer; even if a small amount of the wrong wave vectors passes through the multilayer, they still would not pick out the windmill coded in the 2k0 region. This characteristic satisfactorily ensures a high security level for our design. The 2D hologram result shows a model of hologram encryption and different structures result in different reconstructed images. In the simulation, the windmill is the encrypted information and the hexagram is the misleading image. The multilayer-grating structure with special geometries acts as the password to obtain the correct image.
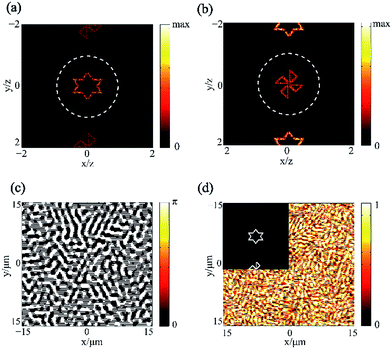 | ||
| Fig. 5 The simulation result of the 2D hologram without (a) and with (b) the grating-multilayer structure. The phase (c) and amplitude (d) distribution of the hologram. | ||
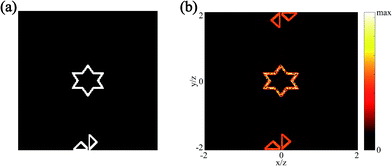
According to the 2D hologram, we know from theoretical calculation that the spectrum region, in which the holography information can be coded, is k ∈ (−λ/2p, λ/2p), in which λ is the wavelength of the incident light and p is the period of the pixel. We have obtained the 2k0 wave vector from the grating-multilayer; then, we should design a proper target image, so that the useful information will be coded near 2k0 in the spectrum region. Fig. 6a shows the target image of our design, a half windmill at the bottom of the image and a hexagram in the middle. Fig. 6b is the simulation result of the Fraunhofer diffraction of the hologram. The half windmill holds the region from 1.6k0 to 2k0 in the y-direction, and the hexagram in the middle, about −0.5k0 to 0.5k0 in both x- and y-directions. However, another half windmill appears in the region central symmetric to the original image, which holds −1.6k0 to −2k0 in the y-direction; the hexagram is a centrosymmetric image placed in the middle, so the centrosymmetric image of the hexagram superposes with itself. To explain this phenomenon, we assumed that the incident light has an intensity I0, the intensity distribution of the original image in the far field is I(x, y), and the calculated phase hologram by the GS algorithm is ϕ(x0, y0). It is easy to know that the relationship between these parameters is
| I(x, y) = I0|FFT(eiϕ(x0, y0))|2 | (1) |
 | (2) |
The intensity distribution changes into I(−x, −y); hence, the reconstructed image is centrosymmetric to the original image. Clearly, if the spin state of the incident light changes, the sign of the calculated phase hologram would also change. In other words, the change of the spin state of the incident light would cause the appearance of the centrosymmetric image. The incident light we used in this study is linearly polarized in order to generate the desired wave vector by grating; the linearly polarized light can be divided into two parts with converse spin states, LCP and RCP. When the hologram is illuminated by linearly polarized light, the reconstructed image would consist of two parts: the original image and the centrosymmetric image, which superpose with each other as shown in Fig. 6b.
The final result of the 2D hologram with the grating-multilayer structure above the metasurface is an entire windmill (and not half a windmill) in the propagating region (and not the evanescent region) as shown in Fig. 5b. We can explain this by the shift theorem of the Fourier transmission. This theorem indicates that the phase shift in the space region will cause a spectrum shift in the frequency region. We can express this theorem by the following equation:33
G(fx − cos(θx)/λ, fy − cos(θy)/λ) = F{g(x, y)![[thin space (1/6-em)]](https://www.rsc.org/images/entities/char_2009.gif) exp[i2π(x exp[i2π(x![[thin space (1/6-em)]](https://www.rsc.org/images/entities/char_2009.gif) cos(θx) + y cos(θx) + y![[thin space (1/6-em)]](https://www.rsc.org/images/entities/char_2009.gif) cos(θy))/λ]} cos(θy))/λ]}
| (3) |
In our design, the metasurface is illuminated by the ±1 level light generated by the grating, this is equivalent to adding a phase shift expressed as exp(j2πfby), where fb = 2y0/λf. According to the theorem, a corresponding shift in the frequency region should be found, and the displacement in our design is ±2k0, which indicates that the spectrum at ±2k0 would be shifted to the central region of the frequency spectrum.
The target image of the 2D hologram is designed to be reconstructed at far field, where the theory of Fraunhofer diffraction should be applied. This theory indicates that the far field distribution is in direct proportion to the Fourier transmission of the field distribution at the aperture plane. Hence, the shift of the spectrum is equivalent to the shift of the reconstructed image. The two half windmills coded near 2k0 and −2k0 in the frequency spectrum are moved to the middle and make up an entire windmill (Fig. 5b). Moreover, the hexagram in the middle is moved to the 2k0 and −2k0 regions in k space, which is the evanescent wave region and cannot be detected. Fig. 5a is the result without the grating-multilayer part, which indicates that the metasurface is illuminated by light without the enlarged wave vector, and there is no phase shift in the space region. Thus, the displacement of the frequency spectrum discussed above would not occur. As a result, the reconstructed image is the unchanged original image; the detectable image is the hexagram instead of the windmill, which would remain in the evanescent region (Fig. 5a).
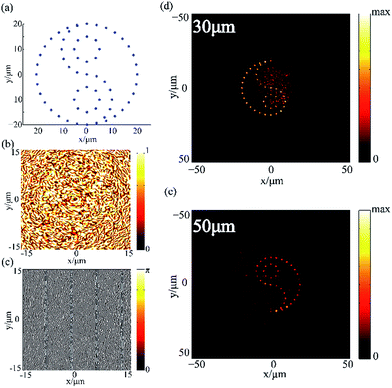
A 3D hologram based on the point source algorithm was also designed. As shown in Fig. 7a, we drew a Taiji that consists of several points. We divided the entire Taiji image into two parts: the left and right halves of the Taiji image would be reconstructed at 30 μm and 50 μm away from the metasurface as shown in Fig. 7d and e, respectively. The light fields that were calculated from the entire Taiji consist of all the point sources according to the point source algorithm and the superposition of all the calculated light fields was taken as the complex amplitude of the hologram. The phase and amplitude distribution of the hologram are shown in Fig. 7b and c, respectively. The continuous amplitude distribution and the two-order phase distribution indicate that the unit cell introduced above is appropriate for our design.
In the design of the 3D hologram, an oblique phase was added into the calculated complex amplitude distribution. The result can be expressed as E = exp(iϕ(x, y)); after adding the oblique phase, it changes into E′ = exp[i(ϕ(x, y) + x × 2k0)]. Following this, a process similar to that in case of the 2D hologram was also utilized here in order to translate the continuous phase distribution into a continuous amplitude distribution. The detailed explanation is provided as follows. As illustrated in Fig. 1c, the unit cell provides continuous amplitude modulation, but the result of the point source algorithm is a continuous phase distribution and the amplitude is a constant. Hence, we should manipulate the original result obtained from the point source algorithm by changing the continuous phase distribution into a two-level distribution and changing the constant amplitude into a continuous amplitude distribution. Assuming that the result of the point source algorithm is eiϕ, the real part of the result is picked out. This process can be expressed as the following equation: cos![[thin space (1/6-em)]](https://www.rsc.org/images/entities/char_2009.gif) ϕ = (eiϕ + e−iϕ)/2. This equation indicates that after picking out the real part of the result, part of the energy of the incident light will be diverged by the metasurface and form a conjugate image at the other side of the metasurface symmetric with the image plane of our design. In addition, the reconstruction quality can be influenced by the diffraction light of the conjugate image because it would become the background light at the image plane. Nevertheless, the intensity of the conjugate image's diffraction light is far smaller than the intensity of the holographic image; however, this influence can be ignored. If we code the metasurface with the amended complex amplitude, light without the enlarged wave vector cannot reconstruct the Taiji images at the target positions and nothing would be found at the 30 μm and 50 μm planes. However, if the metasurface is illuminated with light carrying the proper wave vector (2k0 in our design), the extra oblique phase would be counteracted and the reconstructed Taiji image can be detected as shown in Fig. 7d and e. The oblique phase added into the hologram is similar to the password, which can be designed by us. Then, we found out certain structures, as the grating-multilayer structure utilized in this paper, to decrypt the encrypted hologram (the process of decryption here is illuminating the hologram with the enlarged wave vector) and reconstruct the correct image.
ϕ = (eiϕ + e−iϕ)/2. This equation indicates that after picking out the real part of the result, part of the energy of the incident light will be diverged by the metasurface and form a conjugate image at the other side of the metasurface symmetric with the image plane of our design. In addition, the reconstruction quality can be influenced by the diffraction light of the conjugate image because it would become the background light at the image plane. Nevertheless, the intensity of the conjugate image's diffraction light is far smaller than the intensity of the holographic image; however, this influence can be ignored. If we code the metasurface with the amended complex amplitude, light without the enlarged wave vector cannot reconstruct the Taiji images at the target positions and nothing would be found at the 30 μm and 50 μm planes. However, if the metasurface is illuminated with light carrying the proper wave vector (2k0 in our design), the extra oblique phase would be counteracted and the reconstructed Taiji image can be detected as shown in Fig. 7d and e. The oblique phase added into the hologram is similar to the password, which can be designed by us. Then, we found out certain structures, as the grating-multilayer structure utilized in this paper, to decrypt the encrypted hologram (the process of decryption here is illuminating the hologram with the enlarged wave vector) and reconstruct the correct image.
Conclusions
In conclusion, we have demonstrated a complex structure based on metasurface for gathering information coded in a broad range of k space in a 2D hologram and successfully reconstructed the 3D hologram by adding an oblique phase in the visible band (632.8 nm). The antenna unit cell provides a flexible amplitude modulation and a two-order phase modulation, offering us a proper structure to manipulate the parameter of linearly polarized light. The deepest region to which we can extend is 3k0 in k space; the available information capacity is much larger than that of off-axis illumination.33 The available spectrum region of the off-axis illumination ranges from 0–2k0, but in our design it is 0–3k0, which is a distinct improvement. This scheme can be used for hologram encryption with the same progress as our design. The correct image and the interferential image are coded in the evanescent region and the propagating region, respectively. To pick out the correct image, the wave vector of the incident light should be correctly enlarged. The parameters of the grating-multilayer structure act as the security key of the encrypted hologram. In detail, the grating period should be 316 nm and the grating's space ratio is 1![[thin space (1/6-em)]](https://www.rsc.org/images/entities/char_2009.gif) :
:![[thin space (1/6-em)]](https://www.rsc.org/images/entities/char_2009.gif) 1. The wavelength of the incident light is set to be 632.8 nm and the direction of the electric field should be parallel to the direction of the grating period. Moreover, the light should normally incident onto the grating. Only when all the above conditions are satisfied can we obtain the encrypted image (the windmill in this paper) in the middle of the propagating region. Furthermore, this scheme also shows great potential for information storage.
1. The wavelength of the incident light is set to be 632.8 nm and the direction of the electric field should be parallel to the direction of the grating period. Moreover, the light should normally incident onto the grating. Only when all the above conditions are satisfied can we obtain the encrypted image (the windmill in this paper) in the middle of the propagating region. Furthermore, this scheme also shows great potential for information storage.
Conflicts of interest
There are no conflicts to declare.Notes and references
- X. Li, H. Ren, X. Chen, J. Liu, Q. Li, C. Li, G. Xue, J. Jia, L. Cao and A. Sahu, Nat. Commun., 2015, 6, 6984 CrossRef PubMed.
- S. Zhang, Y. S. Park, J. Li, X. Lu, W. Zhang and X. Zhang, Phys. Rev. Lett., 2009, 102, 023901 CrossRef PubMed.
- H. T. Nguyen, T. S. Bui, S. Yan, G. A. E. Vandenbosch, P. Lievens, L. D. Vu and E. Janssens, Appl. Phys. Lett., 2016, 109, 221902 CrossRef.
- M. Beruete, M. Navarro-Cia, M. Sorolla and I. Campillo, J. Appl. Phys., 2008, 103, 053102 CrossRef.
- Y. Cheng, Y. Nie, X. Wang and R. Gong, Appl. Phys. A: Mater. Sci. Process., 2013, 111, 209–215 CrossRef CAS.
- G. Kenanakis, A. Xomalis, A. Selimis, M. Vamvakaki, M. Farsari, M. Kafesaki, C. M. Soukoulis and E. N. Economou, ACS Photonics, 2015, 2, 287–294 CrossRef CAS.
- L. Liang, M. Qi, J. Yang, X. Shen, J. Zhai, W. Xu, B. Jin, W. Liu, Y. Feng and C. Zhang, Adv. Opt. Mater., 2015, 3, 1374–1380 CrossRef CAS.
- J. Tang, Z. Xiao, K. Xu, X. Ma and Z. Wang, Plasmonics, 2016, 11, 1393–1399 CrossRef CAS.
- W. T. Chen, K. Y. Yang, C. M. Wang, Y. W. Huang, G. Sun, I. D. Chiang, C. Y. Liao, W. L. Hsu, H. T. Lin and S. Sun, Nano Lett., 2014, 14, 225–230 CrossRef CAS PubMed.
- M. Khorasaninejad, A. Ambrosio, P. Kanhaiya and F. Capasso, Sci. Adv., 2016, 2, e1501258 Search PubMed.
- W. Zhao, B. Liu, H. Jiang, J. Song, Y. Pei and Y. Jiang, Opt. Lett., 2016, 41, 147–150 CrossRef CAS PubMed.
- Y. W. Huang, W. T. Chen, W. Y. Tsai, P. C. Wu, C. M. Wang, G. Sun and D. P. Tsai, Nano Lett., 2015, 15, 3122–3127 CrossRef CAS PubMed.
- B. Wang, F. Dong, Q. T. Li, D. Yang, C. Sun, J. Chen, Z. Song, L. Xu, W. Chu, Y. F. Xiao, Q. Gong and Y. Li, Nano Lett., 2016, 16, 5235–5240 CrossRef CAS PubMed.
- M. Khorasaninejad, W. T. Chen, R. C. Devlin, J. Oh, A. Y. Zhu and F. Capasso, Science, 2016, 352, 1190–1194 CrossRef CAS PubMed.
- R. C. Devlin, M. Khorasaninejad, W. T. Chen, J. Oh and F. Capasso, Proc. Natl. Acad. Sci. U. S. A., 2016, 113, 10473–10478 CrossRef CAS PubMed.
- X. Ni, S. Ishii, A. V. Kildishev and V. M. Shalaev, Light: Sci. Appl., 2013, 2, e72 CrossRef.
- X. Chen, L. Huang, H. Mühlenbernd, G. Li, B. Bai, Q. Tan, G. Jin, C. W. Qiu, S. Zhang and T. Zentgraf, Nat. Commun., 2012, 3, 1198 Search PubMed.
- M. Kang, F. Liu, T. F. Li, Q. H. Guo, J. Li and J. Chen, Opt. Lett., 2013, 38, 3086–3088 CrossRef PubMed.
- F. Qin, L. Ding, L. Zhang, F. Monticone, C. C. Chan, J. Deng, S. Mei, Y. Li, J. Teng and M. Hong, Sci. Adv., 2016, 2, e1501168 Search PubMed.
- Z. Wei, Y. Cao, X. Su, Z. Gong, Y. Long and H. Li, Opt. Express, 2013, 21, 10739–10745 CrossRef PubMed.
- P. Y. Chen, J. Soric, Y. R. Padooru, H. M. Bernety, A. B. Yakovlev and A. Alù, New J. Phys., 2013, 15, 123029 CrossRef.
- M. Pu, X. Li, X. Ma, Y. Wang, Z. Zhao, C. Wang, C. Hu, P. Gao, C. Huang and H. Ren, Sci. Adv., 2015, 1, e1500396 Search PubMed.
- A. Euclides, B. Ora and P. Yehiam, Nat. Commun., 2016, 7, 12533 CrossRef PubMed.
- L. Huang, X. Chen, H. Mühlenbernd, H. Zhang, S. Chen, B. Bai, Q. Tan, G. Jin, K.-W. Cheah, C.-W. Qiu, J. Li, T. Zentgraf and S. Zhang, Nat. Commun., 2013, 4, 2808 Search PubMed.
- X. Ni, A. V. Kildishev and V. M. Shalaev, Nat. Commun., 2013, 4, 2807 Search PubMed.
- M. Khorasaninejad, W. T. Chen, A. Y. Zhu, J. Oh, R. C. Devlin, D. Rousso and F. Capasso, Nano Lett., 2016, 16, 4595–4600 CrossRef CAS PubMed.
- Q. Wang, X. Zhang, Y. Xu, J. Gu, Y. Li, Z. Tian, R. Singh, S. Zhang, J. Han and W. Zhang, Sci. Rep., 2016, 6, 32867 CrossRef CAS PubMed.
- X. Zhang, J. Jin, Y. Wang, M. Pu, X. Li, Z. Zhao, P. Gao, C. Wang and X. Luo, Sci. Rep., 2016, 6, 19856 CrossRef CAS PubMed.
- L. Liu, X. Zhang, Z. Zhao, M. Pu, P. Gao, Y. Luo, J. Jin, C. Wang and X. Luo, Adv. Opt. Mater., 2017, 5, 1700429 CrossRef.
- K. Huang, Z. Dong, S. Mei, L. Zhang, Y. Liu, H. Liu, H. Zhu, J. Teng, B. Luk'Yanchuk and J. K. W. Yang, Laser Photonics Rev., 2016, 10, 500–509 CrossRef CAS.
- W. Zhao, H. Jiang, B. Liu, J. Song, Y. Jiang, C. Tang and J. Li, Sci. Rep., 2016, 6, 30613 CrossRef CAS PubMed.
- X. Li, L. Chen, Y. Li, X. Zhang, M. Pu, Z. Zhao, X. Ma, Y. Wang, M. Hong and X. Luo, Sci. Adv., 2016, 2, e1601102 Search PubMed.
- X. Zhang, J. Jin, M. Pu, X. Li, X. Ma, P. Gao, Z. Zhao, Y. Wang, C. Wang and X. Luo, Nanoscale, 2017, 9, 1409–1415 RSC.
- X. G. Luo, Sci. China: Phys., Mech. Astron., 2015, 58, 594201 CrossRef.
- D. Wen, F. Yue, G. Li, G. Zheng, K. Chan, S. Chen, M. Chen, K. F. Li, P. W. H. Wong and K. W. Cheah, Nat. Commun., 2015, 6, 8241 CrossRef PubMed.
Footnote |
| † These authors contributed equally to this work. |
| This journal is © The Royal Society of Chemistry 2017 |

