 Open Access Article
Creative Commons Attribution 3.0 Unported Licence
Flexible tri-layer piezoelectric nanogenerator based on PVDF-HFP/Ni-doped ZnO nanocomposites†
Hemalatha Parangusana,
Deepalekshmi Ponnamma *a and
Mariam Al Ali AlMaadeedb
aCenter for Advanced Materials, Qatar University, P O Box 2713, Doha, Qatar. E-mail: lekshmi_deepa@yahoo.com; Tel: +974 4403 5684
bMaterials Science & Technology Program (MATS), College of Arts & Sciences, Qatar University, Doha 2713, Qatar
First published on 27th October 2017
Abstract
In this work, we report Ni doped ZnO/poly(vinylidene fluoride-hexafluoropropylene) [PVDF-HFP] nanocomposites prepared by sandwiching and their structural, morphological, thermal, electrical and piezoelectric properties. The X-ray diffraction analysis and Fourier transform infrared spectral (FTIR) studies of the nanocomposite films confirm the enhanced β-phase crystallization in the PVDF-HFP matrix due to the Ni-doped ZnO nanoparticles. Microscopic images of the prepared samples substantiate homogeneous dispersion of Ni-doped ZnO nanoparticles in the polymer matrix resulting in higher β-phase nucleation. In addition, the nanocomposite shows a high dielectric constant and low dielectric loss, making it suitable for energy storage. The piezoelectric property increases with the filler concentration and a maximum generated output voltage of 1.2 V is achieved at 0.5 wt% Ni-doped ZnO.
1. Introduction
Over the past few years, great efforts have been dedicated to develop high performance energy harvesters for various applications, such as self powered sensors, smart skins and wearable/portable electronics.1–3 Piezoelectric materials have attracted much interest in the field of smart and biocompatible devices, since they convert mechanical energy into electricity by using nanoscale structures.4,5 The most commonly employed piezoelectric materials are lead zirconate-titanate, barium titanate, lithium niobate, and zinc oxide because of its advantages such as high piezoelectric and dielectric properties; however these ceramics are brittle.6 In order to overcome these problems, new flexible materials are identified with high dielectric constant and good piezoelectric properties. Some of them are poly(vinylidene fluoride) [PVDF] and its copolymers such as poly(vinylidene fluoride-hexafluoro propylene) [PVDF-HFP] and poly(vinylidene fluoride)-trifluoroethylene [PVDF-TrFE]. These polymers are used to fabricate many electronic devices and find considerable applications in several fields such as sensors, capacitors, electromagnetic shield materials, actuators, charge storage capacitor systems etc., due to their flexibility, light weight and ease of processing.7–10 Manipulation of polymer–inorganic nanocomposites with good properties can also be applied in wearable or implantable energy harvesting devices.11,12 A widely used inorganic nano sized filler is the semiconductor ZnO, which is applied in manufacturing piezoelectric energy harvesting device.13 To improve the piezoelectric performance of ZnO, it can be modified with some metal ions; out of which ferromagnetic materials are mostly preferred due to their wide range of applications in sensors, electronics, magnetic recording and biomedical fields.14The effect of magnetic materials in enhancing the piezoelectric properties was extensively investigated and reported. Karan et al.15 reported the Fe-doped reduced graphene oxide (RGO) nanofiller as the main reason for the enhancement of piezoelectric and ferroelectric properties of neat PVDF. Ouyang et al.16 reported five times enhancement in the magnitude of piezoelectric responses with applied electrical field at 35 mV m−1 for the piezoelectric properties of PVDF/iron oxide composites. With 2 wt% of the filler, the mechanical strength, storage modulus and thermal stability of the polymer nanocomposite were noticeably higher than the neat polymer.
The main aim of the present work is to prepare Ni-doped ZnO nanoparticles filled PVDF-HFP nanocomposites through a sandwich technique. The stacked layers of the nanocomposites showed better properties in addition to maintaining the light weight and stiffness nature. To the best of our knowledge no reports are found on the investigation of piezoelectric property of Ni-doped ZnO filled polymer nanocomposites. The piezoelectricity of a polymer nanocomposite typically depends on the β-phase fraction, filler dispersion, filler alignment, alignment of polymer dipole moment, interactions existing between the polymer chains as well as at the polymer–filler interfaces and lattice strain created by the fillers.17–19 All these parameters are discussed in this work. The flexible Ni-doped ZnO/PVDF-HFP nanocomposites were analysed for the dielectric and thermal properties as well. It is found that the addition of Ni-doped ZnO enhances the piezoelectric behaviour of the samples. The present work also explains the mechanism of piezoelectric responses of Ni-doped ZnO/PVDF-HFP nanocomposites in detail and compares the piezoelectricity with its crystalline structure.
2. Experimental methods
2.1 Materials
Monoethanolamine [C2H7NO] [MEA], polyethylene glycol [PEG], ethanol, zinc acetate dehydrate [Zn (CH3 COO)2·2H2O] and nickel acetate were purchased from Sigma Aldrich. PVDF-HFP pellets of molecular weight Mw = 440![[thin space (1/6-em)]](https://www.rsc.org/images/entities/char_2009.gif) 000, N,N dimethylformamide [DMF] and acetone were also obtained from Sigma Aldrich.
000, N,N dimethylformamide [DMF] and acetone were also obtained from Sigma Aldrich.
2.2 Synthesis of ZnO and Ni-doped ZnO nanoparticles
Ni-doped ZnO and pure ZnO were prepared by hydrothermal method. In a typical preparation, required amounts of nickel acetate and zinc acetate dehydrate with different mole ratios (Zn![[thin space (1/6-em)]](https://www.rsc.org/images/entities/char_2009.gif) :
:![[thin space (1/6-em)]](https://www.rsc.org/images/entities/char_2009.gif) Ni = 2
Ni = 2![[thin space (1/6-em)]](https://www.rsc.org/images/entities/char_2009.gif) :
:![[thin space (1/6-em)]](https://www.rsc.org/images/entities/char_2009.gif) 0, 1.94
0, 1.94![[thin space (1/6-em)]](https://www.rsc.org/images/entities/char_2009.gif) :
:![[thin space (1/6-em)]](https://www.rsc.org/images/entities/char_2009.gif) 0.06, 1.90
0.06, 1.90![[thin space (1/6-em)]](https://www.rsc.org/images/entities/char_2009.gif) :
:![[thin space (1/6-em)]](https://www.rsc.org/images/entities/char_2009.gif) 0.10) were dissolved in 50 ml distilled water by magnetic stirring to form a transparent solution. Then 0.5 g PEG surfactant was added to this solution followed by 3 ml MEA. The resulting solution was transferred to a Teflon capped autoclave and kept at 140 °C for 15 min. After completing the reaction, the autoclave was cooled down to room temperature. The obtained precipitate was washed with distilled water and ethanol several times. The precipitate was dried at 80 °C in a hot air oven for 12 h, and then the as-prepared sample was annealed in tube furnace at 400 °C for 2 h to obtain the Ni-doped ZnO nanopowder. The same process was also repeated without the nickel acetate to synthesize the pure ZnO.
0.10) were dissolved in 50 ml distilled water by magnetic stirring to form a transparent solution. Then 0.5 g PEG surfactant was added to this solution followed by 3 ml MEA. The resulting solution was transferred to a Teflon capped autoclave and kept at 140 °C for 15 min. After completing the reaction, the autoclave was cooled down to room temperature. The obtained precipitate was washed with distilled water and ethanol several times. The precipitate was dried at 80 °C in a hot air oven for 12 h, and then the as-prepared sample was annealed in tube furnace at 400 °C for 2 h to obtain the Ni-doped ZnO nanopowder. The same process was also repeated without the nickel acetate to synthesize the pure ZnO.
2.3 Synthesis of PVDF-HFP/Ni–ZnO nanocomposite films
The PVDF-HFP nanocomposites containing undoped ZnO and Ni-doped ZnO were synthesized as sandwich structures. About 2 g of PVDF-HFP was dissolved in a 1![[thin space (1/6-em)]](https://www.rsc.org/images/entities/char_2009.gif) :
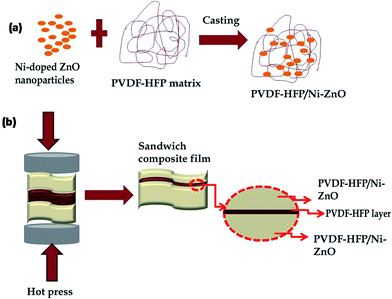
:![[thin space (1/6-em)]](https://www.rsc.org/images/entities/char_2009.gif) 1 mixture of DMF and acetone (15 ml solvent) by magnetic stirring for 3 h at 70 °C. The undoped ZnO in 1 wt% and Ni-doped ZnO in specific weight fractions (0.5, 1 and 2 wt%) were dispersed in the same solvent mixture (5 ml) by bath sonication for 2 h and thereafter mixed with the PVDF-HFP dispersions. The whole mixture was magnetically stirred overnight to ensure maximum rate of dispersion. Afterwards, the well dispersed solution was casted on a clean glass plate into thin PVDF-HFP/ZnO and PVDF-HFP/Ni–ZnO nanocomposite films. The obtained films were kept in a hot-air oven at 80 °C for a few hours to completely remove any residual solvent. The prepared rectangular shaped films were denoted as A1 (PVDF-HFP), A2 (PVDF-HFP/1 wt% ZnO), A3 (PVDF-HFP/0.5 wt% Ni–ZnO), A4 (PVDF-HFP/1 wt% Ni–ZnO), A5 (PVDF-HFP/2 wt% Ni–ZnO) and stacked together in different ways such as A1A1A1, A2A1A2, A3A1A3, A4A1A4 and A5A1A5. The stacked triple layer films were then kept on a hot press and compressed at 170 °C under a pressure of 10 MPa for 3 min to obtain sandwiched homogeneous composite films. Schematic representation of the preparation of nanocomposite films and interaction of Ni–ZnO nanoparticles with PVDF-HFP is shown in Fig. 1.
1 mixture of DMF and acetone (15 ml solvent) by magnetic stirring for 3 h at 70 °C. The undoped ZnO in 1 wt% and Ni-doped ZnO in specific weight fractions (0.5, 1 and 2 wt%) were dispersed in the same solvent mixture (5 ml) by bath sonication for 2 h and thereafter mixed with the PVDF-HFP dispersions. The whole mixture was magnetically stirred overnight to ensure maximum rate of dispersion. Afterwards, the well dispersed solution was casted on a clean glass plate into thin PVDF-HFP/ZnO and PVDF-HFP/Ni–ZnO nanocomposite films. The obtained films were kept in a hot-air oven at 80 °C for a few hours to completely remove any residual solvent. The prepared rectangular shaped films were denoted as A1 (PVDF-HFP), A2 (PVDF-HFP/1 wt% ZnO), A3 (PVDF-HFP/0.5 wt% Ni–ZnO), A4 (PVDF-HFP/1 wt% Ni–ZnO), A5 (PVDF-HFP/2 wt% Ni–ZnO) and stacked together in different ways such as A1A1A1, A2A1A2, A3A1A3, A4A1A4 and A5A1A5. The stacked triple layer films were then kept on a hot press and compressed at 170 °C under a pressure of 10 MPa for 3 min to obtain sandwiched homogeneous composite films. Schematic representation of the preparation of nanocomposite films and interaction of Ni–ZnO nanoparticles with PVDF-HFP is shown in Fig. 1.
2.4 Characterization methods
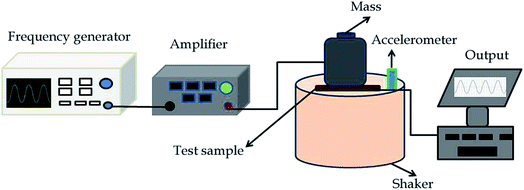
Surface morphology analysis was carried out using scanning electron microscope (Nova Nano SEM 450) and the morphology of the nanofillers was investigated using transmission electron microscope (TEM) (Phillips CM12). All samples were gold coated and the images were taken at an acceleration voltage of 3 kV and 5 kV. The structural properties of PVDF-HFP nanocomposite films were analyzed using X-ray diffractometer (Empyrean, Panalytical, UK) within the 2θ range 10° to 70°. Fourier transform infrared spectrophotometer (FTIR, PerkinElmer Spectrum 400) in transmission mode was used to study the phase variation of polymer nanocomposites. Analysis was done during the 2000–400 cm−1 range with a resolution of 2 cm−1. Thermal analysis of samples was done using thermogravimetric analysis (TGA) perkin Elmer Pyris 6 TGA, from 30 °C to 600 °C at a heating rate of 10 °C min−1. Differential scanning calorimeter (DSC 8500 PerkinElmer) was used to measure the melting and the crystallization behaviour at a temperature range of 20 to 200 °C at 10 °C min−1. Dielectric properties of the samples (circular disks of 2 cm diameter) as function of frequency (10−1–107 Hz) were obtained using broadband dielectric spectroscope GMbH concept 40 (Novo control Technologies, Germany) under room temperature. The piezoelectric studies were done by a specific assembled set up consisting of a frequency generator, amplifier, vibrating shaker, resistance box and data acquisition system. Specific force (2.5 N) was applied on the sample in a longitudinal direction and the corresponding electricity generation was monitored by a computer. The whole piezoelectric setup is shown as a schematic diagram in Fig. 2.3. Results and discussion
3.1 Morphology and structure of ZnO and Ni-doped ZnO nanoparticles
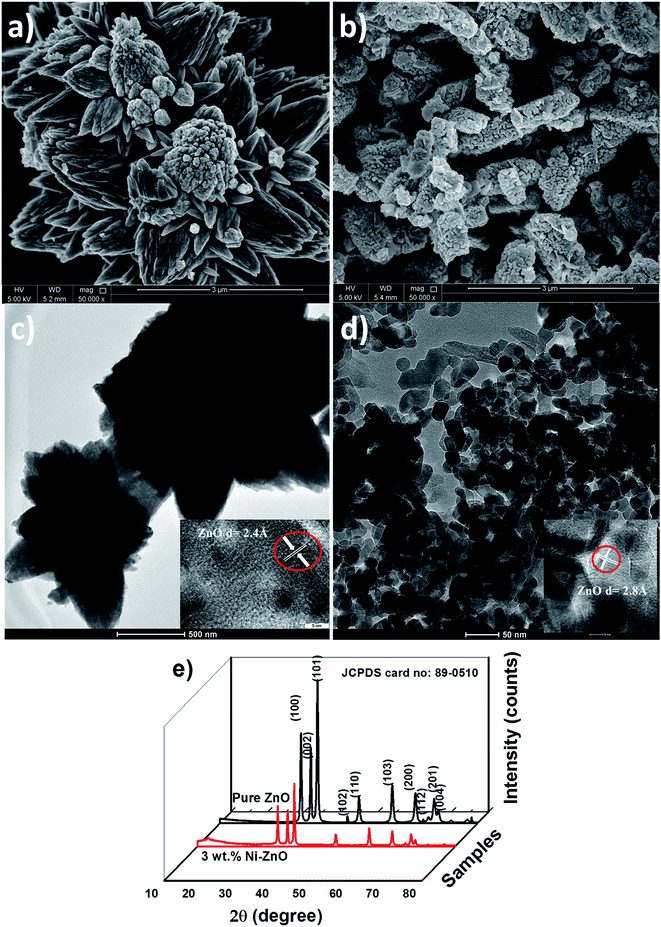
The SEM and TEM micrographs of the pure ZnO and Ni-doped ZnO nanoparticles are shown in Fig. 3a–d. The nanoflower like structure for the undoped ZnO (Fig. 3a and c) is modified into spherical morphology with narrow distribution for the Ni-doped ZnO (Fig. 3b and d). These morphological changes were due to the influence of Ni ions in the ZnO lattice. The HRTEM images of undoped and Ni-doped ZnO samples (insets of Fig. 3c and d) respectively show the fringe spacing of 2.6 Å and 2.8 Å corresponding to (002) and (100) planes of hexagonal wurtzite ZnO. These results demonstrate that the morphology of ZnO sample is influenced by the Ni ions. The X-ray diffraction patterns of pure ZnO and Ni-doped ZnO particles synthesized by hydrothermal method are shown in Fig. 3e. The observed diffraction peaks well match with the standard JCPDS of 89-0510. There are no peaks related to NiO which indicate the crystallographic purity of ZnO. There are no other diffraction peaks found in the sample. From the XRD patterns, the intensity of the diffraction peak is decreased and also the peaks are broadened for Ni-doped ZnO samples. This may be attributed to the lattice disorder of ZnO by Ni ions. These results indicate the substitution of Ni ions in an interstitial position. To study the effect of Ni doping, the positions of XRD peaks are analyzed and found that the peaks are shifted towards lower 2θ values, which indicate the doped samples are in a state of uniform compressive stress.The crystallite size can be calculated using the Debye–Scherrer equation,20
D = 0.9λ/β![[thin space (1/6-em)]](https://www.rsc.org/images/entities/char_2009.gif) cos cos![[thin space (1/6-em)]](https://www.rsc.org/images/entities/char_2009.gif) θ θ
| (1) |
ε = β![[thin space (1/6-em)]](https://www.rsc.org/images/entities/char_2009.gif) cos cos![[thin space (1/6-em)]](https://www.rsc.org/images/entities/char_2009.gif) θ/4 θ/4
| (2) |
The lattice parameters of the hexagonal structure were evaluated based on the data for (100) and (002) planes, respectively, using the following relation.24
 | (3) |
For the (100) orientation, the lattice constant a was calculated by eqn (4)
 | (4) |
And for the (002) orientation the lattice constant c was calculated by eqn (5)
 | (5) |
The lattice constant a and c were determined as a = 3.231 Å, c = 5.164 Å for undoped ZnO and a = 3.244 Å, c = 5.211 Å for Ni-doped ZnO samples.
According to Zhang et al.25 the lattice strain induced by different dopants enhanced the piezoelectric performance of ZnO. Hsu et al.26 also observed large XRD shifts in doped ZnO and slight enhancement in piezoelectric output compared to undoped ZnO nanowires. In the present study, the XRD peaks were shifted to lower angle side and also the lattice parameters and strain values were increased for Ni-doped ZnO. These results lead to the enhancement in the piezoelectric performance of PVDF-HFP polymer as will be seen later on.
3.2 Morphology and structure of composites
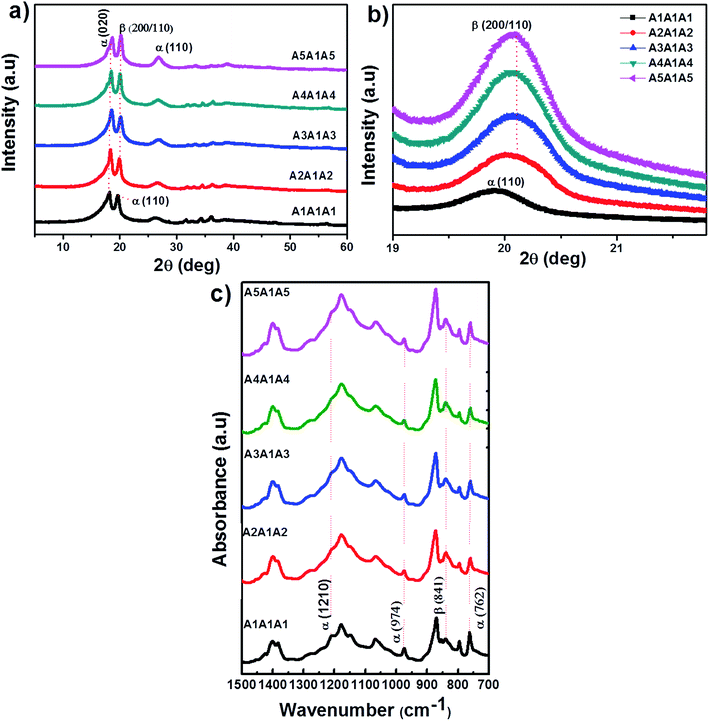
The phase and crystal structure of the PVDF-HFP nanocomposite sandwiched films were characterized by XRD and FTIR spectra. XRD pattern is used to identify the crystalline phases of the PVDF-HFP matrix. The XRD patterns of pure PVDF-HFP (A1A1A1) and PVDF-HFP nanocomposites (A2A1A2, A3A1A3, A4A1A4, A5A1A5) with different concentrations are shown in Fig. 4(a and b). The observed diffraction peaks correspond to the semi-crystalline PVDF-HFP. The diffraction peaks observed at 2θ = 18.1° (110), 18.6° (020), 19.8° (110) and 26.4° (110) correspond to the α-crystalline phase of the polymer. In the PVDF-HFP nanocomposite sandwiches, the α-characteristic diffraction peak at 19.8° (110) is diminished, whereas the peak from the electroactive β-phase at 20.6° (200/110) is appeared.27–30 The observed peak shift towards higher 2θ at 20.6° in nanocomposites in comparison to 19.8° (110) peak position of α-phase in pure PVDF-HFP indicates the formation of electroactive β-phase in presence of nanofillers.Fig. 4b shows the corresponding β-peaks variation in PVDF-HFP nanocomposites under different concentrations. Fig. 4b indicates that the addition of Ni-doped ZnO to the PVDF-HFP matrix enhances the β-phase crystallinity. The peak observed in the range of 30–70° corresponds to the Ni-doped ZnO fillers.
FTIR spectra of pure and Ni-doped ZnO filled PVDF-HFP nanocomposite films are shown in Fig. 4c. The vibrational peaks observed at 974 cm−1, 762 cm−1 are attributed to the α-phase and the vibrational band at 841 cm−1 corresponds to the β-phase.31 From the FTIR spectra, the α-peaks at 974 cm−1 and 762 cm−1 become weaker, while the β-peak at 841 cm−1 increases with the increase in Ni doped ZnO content. This indicates that the addition of Ni–ZnO fillers causes an enhancement in the β-phase and decreases the α-phase. It is evident from the XRD results that the influence of Ni–ZnO fillers has increased the β-phase. The improvement of β-phase content in the PVDF-HFP/Ni–ZnO systems is due to the interaction of the surface charges of the fillers with the molecular dipoles of PVDF-HFP matrix as reported by Mandal et al.32
The β-phase content was calculated from the FTIR spectra by using the following relation.33
 | (6) |
| Sample | β-Phase crystallinity | Crystallinity index (CI) | d33 values (pC N−1) |
|---|---|---|---|
| A1A1A1 | 33.4% | 15.06 | 0.8 |
| A2A1A2 | 45.8% | 19.34 | 1.2 |
| A3A1A3 | 51.1% | 27.62 | 20 |
| A4A1A4 | 50.8% | 30.67 | 3.2 |
| A5A1A5 | 46.1% | 22.80 | 1.2 |
The surface morphology of the pure PVDF-HFP and PVDF-HFP/Ni–ZnO nanocomposite films observed by SEM is shown in Fig. 5(a–e).
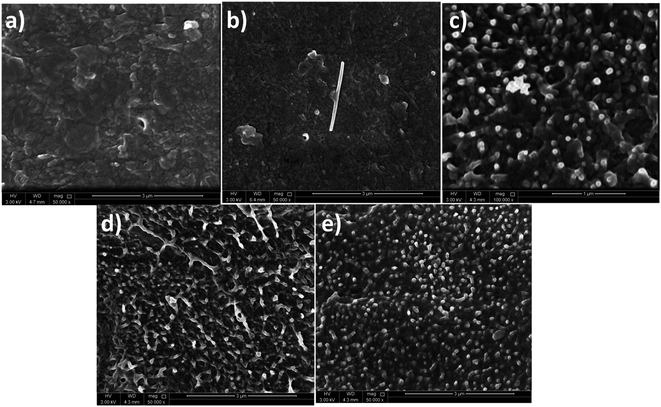 | ||
| Fig. 5 SEM images of PVDF-HFP and its composites (a) A1A1A1; (b) A2A1A2; (c) A3A1A3; (d) A4A1A4 and (e) A5A1A5. | ||
It can be seen from Fig. 5(b), that the pure ZnO nanostructures are dispersed within the PVDF-HFP. Also, the Ni-doped ZnO nanoparticles are uniformly distributed throughout the polymer. No significant agglomerations were observed in the nanocomposite (A3A1A3) with a lower Ni–ZnO loading at 0.5 wt% as shown in Fig. 5c. However, at higher Ni–ZnO content (1 wt% and 2 wt%), the nanocomposites exhibit some Ni–ZnO agglomerates (Fig. 5d and e). With the increase of Ni–ZnO content, the average inter particle distance decreases due to the formation of such agglomerates. As observed from Fig. 5(b–e), the Ni–ZnO particles are almost spherical in shape.
3.3 Thermal properties
Studies on the thermal properties of the sandwiched films also showed interesting results as provided in the ESI.† Fig. S1† shows the melting and crystallization curves for the PVDF-HFP nanocomposite films. The melting curves (Fig. S1a†) show more defined peaks for the Ni–ZnO filled samples and the same is observed for the crystallization peaks at Fig. S1b.† This enhancement indicates the strong nucleation effect of the Ni–ZnO particles which was also reported for the other additives such as graphene nanoparticles.35As shown in Fig. S1b,† when the amount of Ni-doped ZnO increases, a small peak appears and strengthens at 108 °C. The obtained DSC double peaks have been explained in three ways (a) melting/re-crystallization/re-melting during DSC heating, (b) polymorphism, (c) variation in morphology (lamellar thickness, crystal perfection, etc.).36 In our case, the observed double peaks mainly attributed to the different crystalline phase present in the PVDF-HFP polymer.37 Similar results have been observed by many researchers.38–41 The DSC results suggest that the Ni–ZnO containing nanocomposites have enhanced β-phase, which is in good agreement with the XRD and FTIR results.
The crystallinity index (CI) was calculated using the following equation.42
| CI = ΔH100f/ΔH0f | (7) |
The thermogravimetric analysis (TGA) was carried out to study the effect of Ni–ZnO nanoparticles on the thermal stability of PVDF-HFP matrix and the results are provided in Fig. S2.† From the thermogravimetric results (inset of Fig. S2a†), it can be observed that the degradation temperature of A1A1A1 was 455 °C and it was higher for the nanocomposites. By the addition of 1 wt% ZnO (A2A1A2) and 0.5 and 1 wt% of Ni-doped ZnO (A3A1A3) into the PVDF-HFP matrix, the degradation temperature values increased slightly to 462 °C, 468 °C and 474 °C respectively. When the filler concentration increased further (2 wt%), the degradation temperature decreased to 460 °C (A5A1A5). From these results, it is seen that the addition of Ni–ZnO nanoparticles enhanced thermal stability by ∼19 °C compared to that of neat PVDF-HFP. This reveals that the addition of nanoparticles in PVDF-HFP matrix causes good thermal stability and therefore the starting temperature of degradation obviously shifts to higher temperature. Similar effect for iron oxide doping on the PVDF matrix has been observed by Ouyang et al.16 They have also stated that the shifting of degradation temperature may be attributed to the homogeneous distribution and inorganic nature of iron oxide and thus enhances the thermal stability of PVDF-HFP matrix.
3.4 Dielectric properties
Fig. 6 shows the frequency dependence of the dielectric constant (ε′), dielectric loss (ε′′), conductivity (σ) and tan![[thin space (1/6-em)]](https://www.rsc.org/images/entities/char_2009.gif) δ values of the neat PVDF-HFP (A1A1A1) and PVDF-HFP nanocomposite sandwiches. The values of both ε′ and ε′′ increase at low frequency region. This is due to the space charge effects. In these plots, both ε′ and ε′′ increase with the addition of nanofillers, which means that the filler induces more space charge (or) interfacial polarization among fillers, polymers and their interfaces. In other words, there is a tendency of dipoles in the PVDF-HFP and PVDF-HFP/Ni–ZnO to orient themselves in the direction of the applied field in the faster manner. In the high frequency region, the values of dielectric constant (ε′) and dielectric loss (ε′′) were decreased. This is attributed to the lower contributions of dipolar effects.43–45 On the other hand, the dipoles could not orient themselves in the direction of the applied field. The increase in dielectric constant (ε′) with the increase in filler concentration promotes more dipole polarization in the nanocomposites. This high dipole polarization is responsible for the enhancement of the piezoelectric properties.46,47 The applied electric field causes the alignment of dipoles in the material. The dielectric constant of the polymer nanocomposite is 87 for the A5A1A5 sample, which is the highest dielectric constant among all other samples. By using the impedance data, the dielectric constants ε′ and dielectric loss ε′′ can be expressed as.48,49
δ values of the neat PVDF-HFP (A1A1A1) and PVDF-HFP nanocomposite sandwiches. The values of both ε′ and ε′′ increase at low frequency region. This is due to the space charge effects. In these plots, both ε′ and ε′′ increase with the addition of nanofillers, which means that the filler induces more space charge (or) interfacial polarization among fillers, polymers and their interfaces. In other words, there is a tendency of dipoles in the PVDF-HFP and PVDF-HFP/Ni–ZnO to orient themselves in the direction of the applied field in the faster manner. In the high frequency region, the values of dielectric constant (ε′) and dielectric loss (ε′′) were decreased. This is attributed to the lower contributions of dipolar effects.43–45 On the other hand, the dipoles could not orient themselves in the direction of the applied field. The increase in dielectric constant (ε′) with the increase in filler concentration promotes more dipole polarization in the nanocomposites. This high dipole polarization is responsible for the enhancement of the piezoelectric properties.46,47 The applied electric field causes the alignment of dipoles in the material. The dielectric constant of the polymer nanocomposite is 87 for the A5A1A5 sample, which is the highest dielectric constant among all other samples. By using the impedance data, the dielectric constants ε′ and dielectric loss ε′′ can be expressed as.48,49
 | (8) |
 | (9) |
![[thin space (1/6-em)]](https://www.rsc.org/images/entities/char_2009.gif) δ versus frequency for the prepared samples. The loss tangents slightly increase for the filler added systems.
δ versus frequency for the prepared samples. The loss tangents slightly increase for the filler added systems.
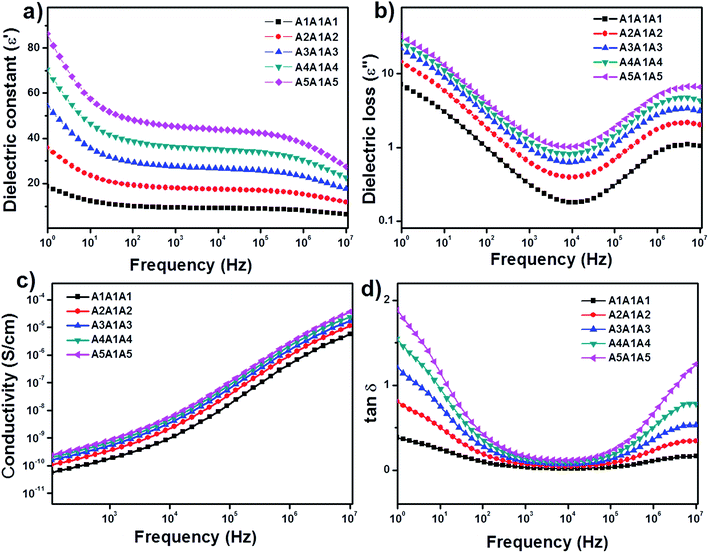 | ||
Fig. 6 Dielectric properties of the PVDF-HFP and PVDF-HFP/Ni–ZnO nanocomposite sandwiched films vs. frequency (a) dielectric constant (ε′), (b) dielectric loss (ε′′), (c) conductivity and (d) tan![[thin space (1/6-em)]](https://www.rsc.org/images/entities/char_2009.gif) δ. δ. | ||
The increase in dielectric constant and loss tangent with increasing Ni-doped ZnO filler loading could be interpreted by interface charge polarization between Ni–ZnO nanofiller and polymer matrix and intrinsic electric dipole polarization inside the composites in applied alternating field.50,51 This is related to the Maxwell–Wagner–Sillar effect. When the current flows across the interface of two materials with different electrical conductivity, charges accumulate at the interface of the dielectric materials. This interfacial polarization increases with the concentration of nanofillers and it results in higher dielectric constant at higher concentration of Ni-doped ZnO nanoparticles.52
3.5 Piezoelectric property
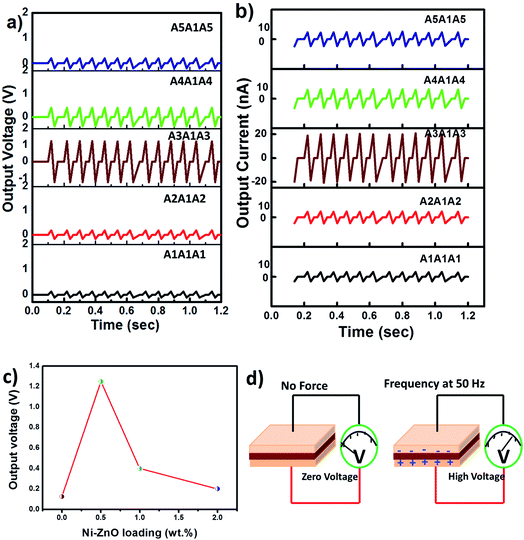
Fig. 7 shows the piezoelectric responses of the tri-layered PVDF-HFP and its nanocomposites. The samples were coated with silver paste prior to the piezoelectric experiments. Many studies observed the piezoelectric properties of PVDF-HFP and its nanocomposites,53,54 but less attention was paid to the piezoelectric effect enhanced by lattice strain of the nanofillers.55 So far, the piezoelectric property of the composites was attributed to the β-phase fraction, filler dispersion and alignment of dipole moment.56 Zhang et al.25 prepared pure and halogen ions doped ZnO and found the enhancement of piezoelectric properties as mainly attributed to the lattice strain present in such nanomaterials. In this work, the presence of lattice strain in the nanofillers was confirmed by the XRD studies. Chen-liang Hsu et al.26 also suggested the correlation between piezoelectric property of ZnO with the X-ray peak shift and lattice strain.The output voltage with respect to time for the PVDF-HFP based sandwiched films in Fig. 7a exhibits piezoelectric response at all doping concentrations of Ni–ZnO. A close look into the figure shows an increased output voltage for the composite containing 0.5 wt% Ni-doped ZnO (A3A1A3). However at higher loadings of the filler, the output voltage was decreased (Fig. 7a). This can be due to the uniform filler dispersion in the PVDF-HFP matrix at lower loadings (see the SEM micrographs). The piezoelectric coefficient d33 is an important parameter that can define the piezoelectric activity of a material and it is defined as the charge produced for an applied stress or the strain at an applied voltage.12 The piezoelectric coefficient d33 values are shown in Table 1. The piezoelectric property and magnetoelectric property are related to each other. In our case, Ni ions in ZnO lead to an enhancement in piezoelectric properties and are ferromagnetic in nature. Ummer et al.57 confirmed that the higher piezoelectricity of the nanocomposites is expected to contribute towards the enhancement in the electric and magnetic properties of the composites.
Fig. 7b shows the piezoelectric output current (nA) exhibited by all composite films. The neat PVDF-HFP (A1A1A1) has the smallest value of current 3.5–4.2 nA and the ZnO containing sample, A2A1A2 also gives nearby values of 4.8–5.2 nA. However, A3A1A3 sample containing 0.5 wt% of the Ni–ZnO shows the highest output current of 19–21 nA. This is in accordance with the voltage results (Fig. 7c) and with increase in wt% of the nanofillers (A4A1A4 and A5A1A5), the output current shows a decrease due to the changes in volume resistivity and lattice strain effects.58 A possible piezoelectric mechanism is also shown in Fig. 7d, which illustrates that without any force there is no impact on piezoelectric output voltage.
Addition of nanofillers to PVDF-HFP influences the structural and functional properties of the final nanocomposites by initiating nucleation, interfacial interaction and super cooling effect. This also varies with respect to the nature and size of particles, concentration, dispersion and composite processing conditions.59 Here the Ni–ZnO particles induce the β-phase formation through ion-dipole interactions and enhance the β-phase nucleation, permittivity and thus piezoelectric property. The large surface area of the fillers and the typical spherical appearance increase the β-phase and degree of crystallinity of PVDF-HFP. Thus the ferroelectric β-phase nucleates in the composites through ion-dipole and dipole–dipole interactions. In PVDF composite case, the crystalline morphology changes with filler addition and number of spherulites increases as reported.60 This contributes to nucleation and crystallization. However higher filler concentrations creates charge accumulation and deteriorates the piezoelectric performance.
Moreover, the charged polar surfaces of Ni–ZnO particles interact with PVDF dipoles and induce surface charge polarization in composites. This enhances the β-phase and thus the piezoelectric response. When mechanical force is applied, a potential is created in the nanoparticles and helps the PVDF dipoles to align through stress induced polarization. This self-polarization is responsible for the higher piezoelectric voltage generation in the PVDF-HFP nanocomposite containing Ni–ZnO.61
4. Conclusions
In summary, we have successfully synthesized the pure ZnO and Ni-doped ZnO nanoparticles by hydrothermal method. Neat PVDF-HFP and its composites containing different concentrations 0.5 wt%, 1 wt% and 2 wt% Ni–ZnO nanoparticles were prepared by solution casting followed by sandwiching technique. The structural property of the synthesized Ni-doped ZnO nanoparticles was investigated and lattice strain was calculated. High lattice strain can be achieved by the variation of dopant concentrations. The dielectric studies indicated the improvement of the electrical properties with the addition of the filler concentrations. The investigation on the piezoelectric properties revealed excellent piezoelectric performance for the 0.5 wt% Ni-doped ZnO containing nanocomposite with a d33 constant of 20 pC N−1. This enhancement in the piezoelectric properties reflects the ability of these composite films in constructing piezoelectric nanodevices with higher efficiency.Conflicts of interest
There are no conflicts to declare.Acknowledgements
This publication is made possible by NPRP grant 6-282-2-119 from the Qatar National Research Fund (a member of Qatar Foundation). The statements made herein are solely the responsibility of the authors.References
- U. Yaqoob, A. S. M. Iftekhar Uddin and G. Chung, Appl. Surf. Sci., 2017, 405, 420–426 CrossRef CAS.
- C. Sun, J. Shi and X. Wang, J. Appl. Phys., 2010, 108, 034309–034320 CrossRef.
- J. H. Jung, M. Lee, J. I. Hong, Y. Ding, C. Y. Chen, L. J. Chou and Z. L. Wang, ACS Nano, 2011, 5, 10041–10046 CrossRef CAS PubMed.
- X. Liu, J. Ma, X. Wu, L. Lin and X. Wang, ACS Nano, 2017, 11, 1901–1910 CrossRef CAS PubMed.
- L. Persano, C. Dagdeviren, Y. Su, Y. Zhang, S. Girardo, D. Pisignano, Y. Huang and J. A. Rogers, Nat. Commun., 2013, 4, 1633 CrossRef PubMed.
- V. Nguyen, D. Rouxel, B. Vincent, L. Badie, F. D. Dos Santos, E. Lamouroux and Y. Fort, Appl. Surf. Sci., 2013, 279, 204–211 CrossRef CAS.
- H. S. Nalwa, Ferroelectric Polymers: Chemistry, Physics, and Applications, Marcel Dekker, New York, 1995 Search PubMed.
- T. T. Wang, J. M. Herbert and A. M. Glass, The Applications of Ferroelectric Polymers, Chapman and Hall, New York, 1988 Search PubMed.
- A. A. Issa, M. A. Al-Maadeed, A. S. Luyt, M. Mrlik and M. K. Hassan, J. Appl. Polym. Sci., 2016, 133, 2–13 CrossRef.
- A. Al-Saygh, D. Ponnamma, M. A. Al Maadeed, P. Vijayan, A. Karim and M. K. Hassan, Polymers, 2017, 9, 33 CrossRef.
- M. Staples, K. Daniel, M. J. Cima and R. Langer, Pharm. Res., 2006, 23, 847–863 CrossRef CAS PubMed.
- Y. Qi and M. C. McAlpine, Energy Environ. Sci., 2010, 3, 1275–1285 CAS.
- Z. L. Wang and J. H. Song, Science, 2006, 312, 242–246 CrossRef CAS PubMed.
- S. Hazra and N. N. Ghosh, J. Nanosci. Nanotechnol., 2014, 14, 1983 CrossRef CAS PubMed.
- S. K. Karan, D. Mandal and B. B. Khatua, Nanoscale, 2015, 7, 10655–10666 RSC.
- Z. Ouyang, E. C. Chen and T. M. Wu, Mater. Chem. Phys., 2015, 149–150, 172–178 CrossRef CAS.
- L. Wu, G. Huang, N. Hu, S. Fu, J. Qiu, Z. Wang, J. Ying, Z. Chen, W. Li and S. Tang, RSC Adv., 2014, 4, 35896–35903 RSC.
- G. H. Kim, S. M. Hong and Y. Seo, Phys. Chem. Chem. Phys., 2009, 11, 10506–10512 RSC.
- X. Wen, W. Wu, Y. Ding and Z. L. Wang, Adv. Mater., 2013, 25, 3371–3379 CrossRef CAS PubMed.
- K. N. Harish, H. S. Bhoja Naik, P. N. Prashanth kumar and R. Viswanath, ACS Sustainable Chem. Eng., 2013, 1, 1143–1153 CrossRef CAS.
- A. Goktas, I. H. Mutlu and Y. Yamada, Superlattices Microstruct., 2013, 57, 139–149 CrossRef CAS.
- S. Singhal, J. Kaur, T. Namgyal and R. Sharma, Phys. B, 2012, 407, 1223–1226 CrossRef CAS.
- S. Muthukumaran and R. Gopalakrishnan, Opt. Mater., 2012, 34, 1946–1953 CrossRef CAS.
- B. D. Cullity and S. R. Stock, Elements of X-ray Diffraction, Prentice Hall, NJ, 2nd edn, 2001 Search PubMed.
- Y. Zhang, C. Liu, J. Liu, J. Xiong, J. Liu, K. Zhang, Y. Liu, M. Peng, A. Yu, A. Zhang, Y. Zhang, Z. Wang, J. Zhai and Z. L. Wang, ACS Appl. Mater. Interfaces, 2016, 8, 1381–1387 CAS.
- C. L. Hsu, I.-L. Sua and T.-J. Hsueh, RSC Adv., 2015, 5, 34019–34026 RSC.
- A. C. Lopes, C. M. Costa, C. J. Tavares, I. C. Neves and S. L. Mendez, J. Phys. Chem. C, 2011, 115, 18076–18082 CAS.
- S. Abbrent, J. Plestil, D. Hlavata, J. Lindgren, J. Tegenfeldt and A. Wendsjö, Polymer, 2001, 42, 1407–1416 CrossRef CAS.
- V. P. Singh, R. Ramani, V. Pal, A. Prakash and S. Alam, J. Appl. Polym. Sci., 2014, 131, 40163 Search PubMed.
- A. H. Stephan, K. S. Nahm, M. A. Kulandainathan, G. Ravi and J. Wilson, Eur. Polym. J., 2006, 42, 1728–1734 CrossRef CAS.
- L. Li, M. Zhang, M. Rong and W. Ruan, RSC Adv., 2014, 4, 3938–3943 RSC.
- D. Mandal, K. Henkel and D. Schmeißer, Phys. Chem. Chem. Phys., 2014, 16, 10403–10407 RSC.
- P. Martins, A. C. Lopes and S. Lanceros-Mendez, Prog. Polym. Sci., 2014, 39, 683–706 CrossRef CAS.
- R. E. Sousa, J. Nunes-Pereira, J. C. C. Ferreira, C. M. Costa, A. V. Machado, M. M. Silva and S. Lanceros-Mendez, Polym. Test., 2014, 40, 245–255 CrossRef CAS.
- B. Mayoral, E. Harkin-Jones, P. N. Khanam, M. A. AlMaadeed, M. Ouederni, A. R. Hamilton and D. Sun, RSC Adv., 2015, 5(65), 52395–52409 RSC.
- K. P. Pramoda, A. Mohamed, I. Y. Phang and T. Liu, Polym. Int., 2005, 54, 226–232 CrossRef CAS.
- K. Prabakaran, S. Mohanty and S. K. Nayak, J. Mater. Sci.: Mater. Electron., 2014, 25, 4590–4602 CrossRef CAS.
- L. F. Malmonge, J. A. Malmonge and W. K. Sakamoto, Mater. Res., 2003, 6, 469 CrossRef CAS.
- H. Kodama, Y. Takahashi and T. Furukawa, Jpn. J. Appl. Phys., 1999, 38, 3589 CrossRef CAS.
- A. C. Jayasurya and I. Jerry, Appl. Surf. Sci., 2001, 386, 175–176 Search PubMed.
- L. Priya and J. P. Jog, J. Appl. Polym. Sci., 2003, 89(8), 2036–2040 CrossRef CAS.
- S. Lanceros-M_endez, J. F. Mano, A. M. Costa and V. H. Schmidt, J. Macromol. Sci., Part B: Phys., 2001, 40, 517–527 CrossRef.
- R. I. Mahdi and W. H. A. Majid, RSC Adv., 2016, 6, 81296–81309 RSC.
- Y. Lu, J. Claude, L. E. Norena-Franco and Q. Wang, J. Phys. Chem. B, 2008, 112, 10411–10416 CrossRef CAS PubMed.
- W. C. Gan and W. H. A. Majid, Smart Mater. Struct., 2014, 23, 045026 CrossRef.
- S. Paria, S. K. Karan, R. Bera, A. K. Das, A. Maitra and B. B. Khatua, Ind. Eng. Chem. Res., 2016, 55, 10671–10680 CrossRef CAS.
- M. Inoue, Y. Tada, K. Suganuma and H. Ishiguro, J. Appl. Polym. Sci., 2009, 111, 2837–2843 CrossRef CAS.
- S. K. Tripathi, A. Gupta and M. Kumari, Bull. Mater. Sci., 2012, 35, 969–975 CrossRef CAS.
- N. G. McCrum, B. E. Read and G. Williams, Anelastic and Dielectric Effects in Polymeric Solids, Wiley, London, 1967, p. 450 Search PubMed.
- H. T. Vo and F. G. Shi, Microelectron. J., 2002, 33, 409–415 CrossRef CAS.
- G. C. Psarras, E. Manolakaki and G. M. Tsangaris, Composites, Part A, 2002, 33, 375–384 CrossRef.
- K. Vasundhara, B. P. Mandal and A. K. Tyagi, RSC Adv., 2015, 5, 8591–8597 RSC.
- Y. Huan, Y. Liu, Y. Yang and Y. Wu, J. Appl. Polym. Sci., 2007, 104, 858–862 CrossRef CAS.
- A. Gaur, R. Shukla, K. Brajesh, A. Pal, S. Chatterji, R. Ranjan and P. Maiti, Polymer, 2016, 97, 362–369 CrossRef CAS.
- X. Han, L. Kou, X. Lang, J. Xia, N. Wang, R. Qin, J. Lu, J. Xu, Z. Liao, X. Zhang, X. Shan, X. Song, J. Gao, W. Guo and D. Yu, Adv. Mater., 2009, 21, 4937–4941 CrossRef CAS PubMed.
- A. Salimi and A. A. Yousefi, Polym. Test., 2003, 22, 699–704 CrossRef CAS.
- R. P. Ummer, B. Raneesh, C. Thevenot, D. Rouxel, S. Thomas and N. Kalarikkal, RSC Adv., 2016, 6, 28069–28080 RSC.
- C. Li, W. Luo, X. Liu, D. Xu and K. He, Nanomaterials, 2016, 6(4), 67 CrossRef PubMed.
- C. Wan and C. R. Bowen, in Polymer-Engineered Nanostructures for Advanced Energy Applications, Springer International Publishing, 2017, pp. 537–557 Search PubMed.
- J. Xue, L. Wu, N. Hu, J. Qiu, C. Chang, S. Atobe, H. Fukunaga, T. Watanabe, Y. Liu, H. Ning and J. Li, Nanoscale, 2012, 4(22), 7250–7255 RSC.
- S. K. Karan, R. Bera, S. Paria, A. K. Das, S. Maiti, A. Maitra and B. B. Khatua, Adv. Energy Mater., 2016, 6(20), 1601016 CrossRef.
Footnote |
| † Electronic supplementary information (ESI) available. See DOI: 10.1039/c7ra10223b |
| This journal is © The Royal Society of Chemistry 2017 |

